Moving Average is one of the most popular trend indicators for technical analysis of charts. It is on the basis of the moving average that tens of thousands of different indicators and advisors, as well as a huge variety of different trading strategies, have been created. Despite the fact that the Moving Average indicator (abbreviated as MA or, as it is also popularly called, MA-shka) is a lagging indicator, it can be very effectively used to make a profit, which I will discuss in this article.
Content
- Method and formulas for constructing a moving average on a price chart
- Simple Moving Average (SMA) - simple moving average
- Exponential Moving Average (EMA) – exponential moving average
- Linear Weighted Moving Average (LWMA) – linearly weighted moving average
- Moving average as a dynamic support level
- Moving average as a dynamic resistance level
- Moving average period doesn't matter
- The correct time frame for working with the moving average
- Fast and slow moving averages
- Identifying sideways movements using moving averages
- Strategy “three moving averages in trend trading”
- Strategy of “price crossing the moving average line”
- Moving average with a period of “50” - a trend trading strategy for higher time frames
- Moving average with a period of “50” - a trend trading strategy for short-term trading
- Strategies with the intersection of two lines of the Moving Average indicator
- Strategies with the intersection of three lines of the Moving Average indicator
- Envelope of moving averages – price channel from Moving Average
- The intersection of moving averages with a period of “50” and “200”
- The intersection of moving averages with a period of “10” and “30”
How to use in technical analysis
Next we will look at the 4 most important moving average functions for a trader, with short comments on each.
- Determining the trend. This is the main function of this indicator. It is lagging, so it does not predict the beginning of a new trend, but only says what is already visible. But, this is an ideal indicator for selecting trending securities using filters. We'll talk about this later in the article.
- Definition of momentum. This is momentum, or the speed at which the price is moving. The closer to the vertical the slope of the moving average, the higher the momentum. If there are 2 MAs: fast and slow, then the greater the distance between them, the higher the momentum. Momentum is best viewed by the MACD, which works based on moving averages.
- Support and resistance. Very often, the price, approaching the moving average, finds a level in it and reverses. This is especially common with the 200-period MA. But considering a line on a chart to be support or resistance is a very contradictory statement. Be careful with it, especially if you see trading strategies based on it.
- Setting a stop loss. The idea is to "hide" the loss limiter behind the MA based on the latter being support or resistance. You already know how you feel about such a statement.
Method and formulas for constructing a moving average on a price chart
First of all, you need to understand the principles and methods of constructing a moving average on a price chart. There are several basic methods for constructing the Moving Average indicator:
- Simple Moving Average (SMA) - simple moving average
- Exponential Moving Average (EMA) – exponential moving average
- Linear Weighted Moving Average (LWMA) – linearly weighted moving average
The differences between the methods are not significant, but they still exist - some lines are more smoothed, others less smooth.
Simple Moving Average (SMA) - simple moving average
It doesn't take much intelligence to understand how a moving average is constructed. The standard SMA (Simple Moving Average) indicator has:
- Period “14” - takes data from the last 14 candles on the price chart
- Construction type “Close” - accepts for calculation only price values recorded when the candle closed
The formula for constructing SMA is as follows:
- SMA = SUM (CLOSE (i), N) / N
Where:
- SUM – sum
- CLOSE (i) – closing price of a specific candle
- N – number of candles (indicator period)
To put it in simple terms, you need to add up all the elements involved in the calculations and divide the resulting amount by the number of these elements. For example, to calculate the current value of a simple moving average, we need the last 14 closing values of candles (with standard indicator settings):
For the last 14 candles, the average value level will be set to “12”. But what happens after the next candle closes? The first number “15” will disappear from the calculation formula and a new number will be added, after which the changed value of the simple moving average will be revealed:
The period of the Moving Average indicator will always indicate the number of candles, the data of which will be included in the calculations. In this case, the last candles will always be taken:
Exponential Moving Average (EMA) – exponential moving average
EMA or Exponential Moving Average is a smoother version of the regular MA. This became possible after adding a certain share of the use of the current price to the formula. The calculation formula itself is as follows:
- EMA = (CLOSE (i)*P) + (EMA (i -1) * (1-P))
Where:
- P – share of price value usage
- CLOSE (i) – closing price of a specific candle
- EMA (i-1) – value of the moving average of the previous period
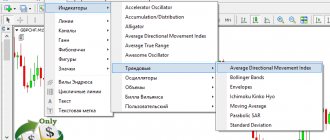
If you look at a chart and compare a simple moving average with an exponential moving average, you will notice some differences:
The exponential moving average, unlike the SMA, is smoother and reacts faster to price changes. This property is the reason why traders most often prefer the EMA to the simple moving average.
Linear Weighted Moving Average (LWMA) – linearly weighted moving average
LWMA (or simply WMA) is another popular moving average method. When calculating a linearly weighted moving average, more weight is given to recent candles and less weight to earlier candles. Each element of the calculation in the Linear Weighted Moving Average is multiplied by a certain weighting factor, which allows you to give weight to some values and take it away from others. In this case, the LWMA formula looks like this:
- LWMA = SUM (CLOSE (i)*i, N) / SUM (i, N)
Where:
- SUM - sum
- CLOSE (i) – closing price of a specific candle
- SUM (i, N) – sum of weighting coefficients
- N – smoothing period
If we compare LWMA with SMA on the chart, we get the following picture:
The LWMA line is smoother and reacts faster to price changes. The weighted moving average also outperforms the EMA in terms of construction speed - it reacts faster to price reversals and trend changes.
Main disadvantages of MA-based strategies
One of the main disadvantages of all the above strategies is the large delay of signals supplied by MA. After all, in essence, the MA is just the average value of all price values on a given time interval. Therefore, before the corresponding signal is given (for example, the intersection of two moving averages), the price sometimes manages to complete most of its movement.
This problem can be partly solved by reducing the MA period. After all, the shorter the period, the more sensitive it will react to every price movement. In this case, the price movement can be caught at its very origins, but another problem arises here - a large number of false signals.
The mass of false signals is another major drawback of MA-based strategies. And it manifests itself, as mentioned above, the stronger, the shorter the periods of the moving averages used. A number of methods are used to filter out these types of false signals.
Moving Average indicator parameters
The moving average is used in various trading strategies.
The reason is the flexibility of setting the Moving Average indicator. To properly configure the indicator, a trader must understand how it works and what data he needs as an output - on the price chart. Apart from the methods for constructing the Moving Average, we can highlight the main settings that you will have to work with:
- Period
- Shift
- Data to build (“apply to”)
The moving average period is the number of last candles that the indicator will take to calculate the current value.
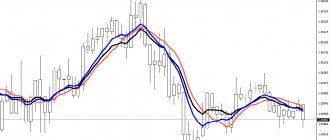
The higher this number, the farther the moving average line will be from the chart. Moving average shift - this parameter is necessary to shift the moving average on the chart. In standard settings, the shift is 0 – the Moving Average indicator line is formed at the same level as the current candle. If you change the shift, for example, to “2” or “-2”, then the indicator line will move two candles forward or two candles back:
As you can see, the blue Moving Average line with a shift of “-2” lags behind the chart, and the red moving average line with a shift of “2” is two candles ahead of the chart.
The data to be plotted (“apply to”) is the data that will be taken from each candle. According to the standard, this is “Close” data - the closing price of the candle. You can also build a moving average using the following data:
- Close – candle closing price
- Open – candle opening price
- High – maximum price of the candle
- Low – minimum candle price
- Median Price (HL/2) – average price (Maximum * Minimum / 2)
- Typical Price (HLC/3) – typical price (Maximum * Minimum * closing price / 3)
- Weighted Close (HLCC/4) – weighted price (Maximum * Minimum * closing price * 2 / 4)
What is the MA indicator
There are different forms of moving averages and their types are not very different, to be honest. But the main goal for everyone remains the same: to help the trader determine the trend of a trading instrument by averaging and smoothing its price and displaying it on the chart as a line.
Purpose of moving average:
- Markets used : stock, Forex, futures;
- Instruments : stocks, currency pairs, futures, etc.;
- Preferred timeframes : from minute or hourly chart to daily and weekly;
- Group : refers to trend indicators;
- How it is used : often for filtering and selecting trending securities; less often for trade.
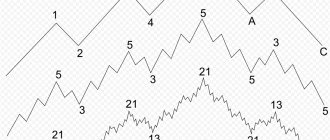
Moving average as a trend line or price reversion to the mean value
From previous articles you already know that the price moves in waves. Every uptrend has pullbacks down, and every downtrend has pullbacks up. The price moves along support and resistance levels, and also reacts to trend lines. If we depict this schematically, we get the following picture:
But any level of supply and demand is an area of interest for traders. This is where we need moving averages. For example, if you add an EMA with a period of “10” and an EMA with a period of “20” to the chart, they will act as dynamic trend zones of support and resistance:
The price tends to return to the average price value - to the support zone or resistance zone, built by two lines of the exponential moving average.
Please note that the stronger the price movement, the further the EMA lines diverge - the larger the support zone and resistance zone become. Such zones perform very well in trending price movements, but you can also use just one moving average line, which will indicate a dynamic trend line:
In this example, we used the Exponential Moving Average indicator line with a period of “15” on the H4 chart (4 hours). Notice how precisely the moments of trend continuation are indicated - the EMA line serves as resistance, after the price breaks upward it becomes support, and then again resistance. This indicator can easily solve all the problems associated with finding trend lines and adding them to the price chart.
Basic signals given by the indicator
I will list the main points that you should pay attention to when initially analyzing a chart using the moving average method:
The following line directions serve as a signal to buy:
- the curve goes up;
- the curve crosses the trend line from bottom to top (rapid growth of quotes);
- MA turned from bottom to top with a growing trend.
And for sellers the signals are:
- the line goes down;
- MA crosses the trend line from top to bottom (quick drop in quotes);
- The MA turned from top to bottom in a downward trend.
Moving average: overbought and oversold assets - traders’ mistakes
Very often traders make the mistake of entering the market on price impulses.
In appearance, everything is logical - the transaction is in the direction of the trend, which means there should be no problems. But, as a rule, most trend impulses are followed by a price rollback to the average value - to our support zone or resistance zone. Overbought occurs at moments when the bulls are not ready to pay a high price for an asset - they go over to the side of the bears and begin to sell the product. Oversold, on the contrary, occurs when sellers are not ready to continue selling an asset so cheaply - they become buyers and begin to drive the price up. All this is very easily visible on the graphs - this is indicated by the following factors:
- Horizontal support and resistance levels
- Candlestick formations
- Doji candles (candles with long shadows and a small body)
White rectangles indicate the moments of overbought and oversold prices.
As a rule, these moments arise at support and resistance levels, and very often you can observe reversal candlestick patterns - at these points you cannot enter in the direction of the current trend! For an uptrend, we must avoid overbought zones and, just like in trading from support levels, wait for the price to return to the average value zone, and only then open a trade for an increase:
A very simple scheme - we open up at the most advantageous point (at the very bottom of the price rollback). Of course, there are also more protracted pullbacks, and no one has canceled price reversals, so, like any other trading strategy, this trading idea does not guarantee 100% results. Don't forget about the risks!
For a downward trend, everything is exactly the opposite - we do not open trades in presold zones, but confidently open downwards from the resistance zone formed by two EMA lines with periods of “10” and “20”:
But there are situations when the trend is very strong and the price does not return to the moving average lines for a long time. In such cases, you need to use common sense and look for entry points based on other indicators, for example, support and resistance levels. As a rule, the price still breaks through the levels, and after that it fixes on them - these are our entry points in strong trend movements:
Using EMA with other indicators
EMA works well with trend indicators and oscillators. When using several instruments, you can cut out false signals and receive double triggers, which will more accurately show the market entry points.
So, it works well with EMA Stochastic. To use the system, you need to plot EMA 50 (blue), EMA 13 (red), EMA 4 (green), Stochastic Oscillator with levels 60, 40 and values 12, 9, 5 on the chart. The example uses the EUR currency pair /USD and time period H4.
The image shows that the Stochastic lines are ahead of the EMA signals.
A sell order should be opened when:
- The green SS will cross the blue one from top to bottom.
- The Stochastic indicator will break through level 60 from top to bottom.
- The blue EMA line will be crossed from top to bottom of the red one.
- Stop loss is set at a distance of 50 points from the entry point. Profit is taken when the price leaves the blue moving average.
Determining Momentum Using Moving Averages
Momentum is the rate of change in price movement.
In simple terms, momentum shows us the strength of the trend, which gives us knowledge about the possible duration of the trend movement, as well as the likelihood of a price reversal. For example, momentum can be determined using three moving averages:
- Moving Average (SMA) with period “50”
- Moving Average (SMA) with period “100”
- Moving Average (SMA) with period “200”
Accordingly, in a “correct” (strong trend) the lines will line up in the following order:
- SMA (50) will be closest to the price
- SMA (100) will be between SMA (50) and SMA (200)
- SMA (200) will be furthest from price
As soon as this order is violated, it is worth carefully analyzing the market - perhaps a violation of the order of the moving average lines tells us about an imminent price reversal:
The intersection of SMA “50” with SMA “100” indicates a possible end to the trend:
At the same time, lining up the MA lines in the correct order (50, 100, 200) away from the price indicates the emergence of a new trend:
You should also definitely pay attention to the distance between moving averages - the larger it is, the stronger the trend. Accordingly, the smaller the distance between the lines of the Moving Average indicators, the weaker the trend movement.
Moving average as a dynamic support level
Any moving average line should be regarded as a dynamic support level if it is below the price. But do not forget that the shorter the period of this line, the weaker its support level. The opposite is also true - the longer the period of the moving average, the stronger the support level:
Typically, round numbers are used as a moving average period (10, 50, 100, 150, 200, etc., etc.), but traders also use periods associated with chart time frames. For example, period “60” for a minute chart – the number “60” means 60 minutes of an hour.
Moving average as a dynamic resistance level
Just like in the horizontal levels of supply and demand, the moving average line has the property of becoming resistance after breaking through support. Everything can be remembered very simply and quickly: if the moving average line is below the price, then this is support and we should expect upward reversals from this level; if the Moving Average indicator line is above the price, then this is a resistance level - from this level it is worth opening trades down:
Do not forget that the moving average settings are selected for the time frame, and may also vary depending on the asset used.
Types and parameters
MA lines are also classified into types depending on their use in technical trading analysis:
- MA to determine momentum (direction and rate of change in quotes). Usually, several curves constructed based on calculations for different periods are plotted on a graph and how similar they behave is compared. With strong momentum (rapid price growth), the lines on the chart are located one below the other and have the same direction. If the curves intersect with each other and the trend line, the price changes slightly.
- MA lined up as a support level. We remember that the support level is the minimum below which the price should not fall in a certain time period (time frame). The curve is drawn based on historical lows. When it is located below the trend line, a perpendicular is drawn from the minimum acceptable value. At the point of its intersection with the MA, a stop loss is set.
- MA, built as a resistance level for setting a stop loss in an uptrend.
Moving averages: practice of use
As for the practice of using moving averages, there are tens of thousands of strategies using the Moving Average indicator, as well as a countless number of tips for setting up these lines in certain situations. We will not be able to analyze all the options, but there are universal tips that will help you simplify the use of the moving average in your trading.
Moving average period doesn't matter
Very often you will come across strategies using the Moving Average indicator and in most cases, the MA settings will be different.
Why is that? The fact is that the indicator is very flexible in settings and depends directly on what the trader wants to get in the end:
- Earlier signal
- Smoothed data
- Strong support and resistance levels
- Good confirmation of the beginning or end of a trend
There may be many options, but all indicator settings, one way or another, will depend on the indicator period (the number of candles that will be used to calculate the moving average line).
Much also depends on the type of construction (calculation formula) of the MA-shka. A trader should always know what he wants to get from this indicator and “adjust” it to the current asset, chart and time frame. Literally, you need to take the indicator and “play around” with the settings. See how it shows itself on history or, even better, run the indicator through the strategy tester (available in the MT4 terminal).
The correct time frame for working with the moving average
The effectiveness of the Moving Average indicator itself directly depends on the choice of time frame.
For example, there is no point in using a moving average with a period of “100” or “200” to search for a signal on the minute (M1) time frame. At the same time, “fast” MAs are not suitable for long-term trading. To search for signals in order to open trades for a period of no more than an hour, “fast” MAs are suitable:
- EMA with periods from 5 to 50
- It is also recommended to use at least two Moving Average indicators with different settings
For trading on hourly charts, it is better to use stronger and slower moving averages:
- MA with periods “50”, “100”, “200”, etc.
Fast and slow moving averages
“Fast moving averages” refer to lines that inform the trader about the smallest changes in the market situation.
Simply put, they change their readings faster. Such MAs include indicators with periods from 1 to 50 (opinions may vary among different traders). The disadvantages of “fast” moving averages are that when using them it is very difficult to get a global picture, but it is enough to simply find a situation to open a short-term trade:
It is also worth taking into account “noise” - false signals from fast moving averages. Accordingly, the shorter the MA period, the more “noise” there will be.
“Slow” moving averages include lines that do not react to small price changes, but show global trends. For example, these are MAs with a period greater than “50”:
Of course, the “slow” moving average also has its disadvantages. For example, if the trend changes sharply to the opposite one, the indicator line will not react to the changes immediately, but after some time.
For greater efficiency, fast and slow moving averages are used together:
- Slow MAs - to determine the global situation and identify strong trends
- Fast MAs – for finding entry points in trend movements
Identifying sideways movements using moving averages
It would seem that what could be simpler than determining a sideways trend using moving averages?
It seems that everything is clear - the MA lines often intersect, and the price moves horizontally - this is a sideways movement. The problem is how to then determine when the flat has ended, but here everything is not so simple. To determine the end of a sideways movement, the lines of the Moving Average indicator are practically “useless”. First of all, you will need to look at the tops and bottoms, which will mark the beginning of a new trend. If the trend is downward, then new depressions will appear lower than the previous ones. For an uptrend, you should pay attention to the tops, which should be higher than the previous ones.
But MA lines can also be useful and confirm the beginning of a trend. You need to wait for the moment when the trend pullback does NOT break through the line of the Moving Average indicator, but bounces off it and continues its fall or rise in price. This will confirm the trend that has begun:
Trading system "Alligator"
To use the system in your work, you need to install 3 EMA with different parameters and time shifts, as well as the Fractal indicator.
Best options:
- EMA 9 (with shift 3)
- EMA 15 (with shift 5)
- EMA 25 (with shift

All exponential averages are lined up at half the sum of each of the closed candles. You need to pay attention to the location of the current price: if it is above the moving average, you need to buy, if below it, you need to sell. Profit is recorded when the movement slows down. For ease of installation, you can find the Alligator indicator in MT4 and install it.
In the example below, you can see that price is outside of all exponential MAs when a bullish trend appears. The first local maximum is created (marked by the fractal indicator), the EMA 9 indicator breaks through two slow moving averages from the bottom up.
Two signals are generated at once: the EMA lines intersect and a fractal appears. Cautious traders wait for a price pullback and only then enter the market, but here they can already conclude a sell deal.
Moving averages (Moving Average indicator): popular binary options trading strategies
Where would we be without trading strategies based on moving averages?! Let's look at some interesting binary options strategies that are most often used by experienced traders.
Strategy “three moving averages in trend trading”
We will need three moving average lines with the following settings:
- EMA with a period of “200” - a slow MA for determining the global trend
- EMA with period "50"
- EMA with period "20"
The conditions of the strategy are as follows:
- Using the EMA “200” indicator line, you need to determine the global trend: if the price is above this line, then the trend is upward and you should look for entry points only in the upward direction; if the price is below the EMA line, then the trend is downward and you should only work out downward signals
- We are waiting for the intersection of EMA “20” with EMA “50” - the 20th moving average should be closer to the price than the 50th
- We are waiting for confirmation of the trend, namely two price rollbacks from EMA “20” or EMA “50”
- At the time of the third and subsequent approaches of the price to the MA lines, we open transactions in the direction of the current trend
To downgrade, it's exactly the opposite:
Do not forget that the Moving Average indicator is a lagging indicator, therefore, as soon as the price stops updating highs or lows, or the indicator lines intersect, it is better to refuse to enter trades.
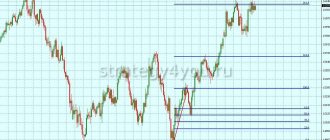
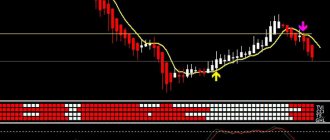
Strategy of “price crossing the moving average line”
As you already understood from the name, the strategy will be based on the price crossing the moving average line. In this case, the EMA line with a period of “20” will be used. The essence of the strategy is that after trending price movements, sideways movements or consolidation appear. It is the sideways that we will look for as part of this strategy.
- Using the moving average, we find a trend with at least one rollback from the MA line
- Based on technical analysis, we determine that the price has stopped updating highs (in an uptrend) or lows (in a downtrend)
- We set the upper and lower horizontal boundaries based on the latest highs and lows (these will be the boundaries of the sideways movement)
- We trade pullbacks from sideways borders
In practice it looks like this:
Signals for entering a trade are marked with red and green arrows. For a downward trend, everything is exactly the opposite:
We pay attention to the moments when the price begins to update highs or lows - we consider that this is a possible beginning of a trend and stop trading sideways movement.
Moving average with a period of “50” - a trend trading strategy for higher time frames
For this trading strategy, we will need an SMA or EMA with a period of “50” (see for yourself which is better for the assets you are going to trade), as well as a time frame of one hour (H1 and higher).
The essence of the strategy is very simple:
- We wait for at least one price rollback from the moving average line with updating of bottoms or tops
- We open trades in the direction of the trend when the price, during a rollback, approaches the moving average line
- As soon as the bottoms or tops (depending on the trend) stop updating (the trend is over), we stop opening trades and wait for a new trend
After each transaction, you need to wait for the minimums or maximums to update, and only then look for a new signal to open a transaction. The strategy is very simple and reliable, but since this is a senior time frame, you will have to wait a very long time for signals.
Moving average with a period of “50” - a trend trading strategy for short-term trading
Now let’s look at an example of a strategy with a Moving Average line and a period of “50”, but for intra-hour trading.
- The SMA or EMA line with a period of “50” is used to determine the trend
- It is necessary to wait for at least one rollback from this line with subsequent updating of the price highs or lows
- During a rollback against the trend, rollback boundaries are formed and when they break through towards the trend, a deal is opened
After each trade, we wait for the update of the maximums (in an uptrend) or minimums (in a downtrend).
Strategies with the intersection of two lines of the Moving Average indicator
Very often, traders use simple but effective strategies that include not one, but two moving average lines.
A trade is opened at the intersection of these lines, which inform the trader about the beginning of a trending price movement. The most commonly used periods for moving averages are:
- 4 and 8 (or 9)
- 6 and 24
- 15 and 50
- 20 and 60
- 30 and 100
The disadvantage of this strategy is that it is very difficult to determine the beginning of a sideways movement, but, in most cases, the strategy will be profitable.
Strategies with the intersection of three lines of the Moving Average indicator
Formations with three Moving Average lines are also very often used. The most popular settings (periods) of such strategies:
- 4, 8, 18
- 5, 10, 20
- 8, 13, 21
A trade is opened when the fastest moving average line crosses two other, slower lines:
It is worth understanding that the longer the periods of moving averages, the fewer false signals there will be during trading.
Envelope of moving averages – price channel from Moving Average
Another interesting method of searching for signals is an envelope of moving averages.
To create an envelope, the “Envelopes” indicator is used - it is this indicator that plots the desired price channel on the price chart. In fact, Envelopes simply draws additional lines above and below the regular Moving Average indicator. To build such lines, in the Envelopes settings you need to specify percentages - the distance at which auxiliary lines will be added. This indicator simply builds a price channel and should not be compared with Bollinger Bands, since their operating principles are different.
Working with such a channel is simple - if the settings are selected correctly, the channel boundaries will serve as overbought and oversold zones, which means they will push the price towards the center of the channel:
You can also use the Envelopes indicator with Bollinger Bands to determine more reliable entry points. For example, if a candle opened outside the Bollinger Bands and on the border of the Envelopes indicator, then this is a good entry point for a price reversal:
Here it is worth understanding that the periods of Bollinger Bands and the period of the Envelopes indicator must coincide. In the example above, the periods are "14".
The intersection of moving averages with a period of “50” and “200”
This strategy uses two SMAs with periods of “50” and “200”. The intersection of the Moving Average lines indicates a change in trend.
These moving average settings are very popular among Forex traders, but you can also benefit from them in binary options. For example, use indicators to identify strong trends, and then, using additional tools, find entry points in the direction of the current price movement.
The intersection of moving averages with a period of “10” and “30”
A simpler and faster variation of MA-sheks (in comparison with SMA “50” and “200”), but its principles are the same. A crossover indicates a trend, but these trends can already be used in day trading:
If you can clearly see the wave-like price movement, then you can open trades at the intersection only in the direction of the current trend. The effectiveness of the strategy will increase significantly.
Determining Market Phases Using a Slow Moving Average
A moving average with a long period can tell you a lot about the market. For example, what phase is the market in now? For example, we will use EMA with a period of “200”. As we know, the market is either in a state of rest (lateral movement or accumulation) or in a trend. The trend using the moving average is not difficult to determine:
- Price above EMA “200” – upward trend
- Price below EMA “200” – downward trend
If the price constantly breaks through the EMA “200”, then there is an accumulation phase or sideways movement, which will certainly be followed by a trend. The longer the accumulation phase, the stronger the trend will be:
In protracted trends there is another interesting feature - rollbacks can take place in three stages, which means that the moving average acts as a confirmatory tool, signaling a change in trend (until the price breaks through the EMA line, the trend has not changed):
It would seem that the rule for the end of a trend should work (a new peak is lower than the previous one - the trend is over), but no - the rollback was complex and consisted of three stages, after which the price crawled up again.
Many traders are not aware of such situations and naively believe that it is time to enter a bear market. The moving average line with a period of “200” (our example) very easily determines the boundaries of the trend and does not allow making such a mistake. It is worth considering that in an uptrend, transactions after a rollback should be made only if the price has updated the previous maximum. In a downtrend, we must wait for the previous depression to update and only then look for a downward entry point.
A moving average with a long period indicates to us the presence of a trend: as long as the price is above the line, the trend will be upward, so trades should only be opened for an increase; the price is below the MA line – the trend is downward and transactions should also be opened only for a decrease. Those. The trading scheme is simple:
- Using a slow moving average, we determine the current trend
- We are waiting for the update of the highs or lows
- On pullbacks we find the entry point towards the trend
- If the high or low has not been updated, then wait until the trend continues or until the price breaks the slow moving average
Moving averages: summing up
Moving averages are not just lines with average values.
A huge number of different technical chart analysis indicators have been created based on the Moving Average indicator. What can we say, if moving averages themselves are capable of indicating entry points - it is not without reason that they are included in Price Action patterns. Also, varieties of moving averages (with different calculation formulas and settings) are part of a huge number of trading strategies and trading systems, as well as trading robots. Now it is very difficult to imagine an indicator strategy that does not use the average price value.
For us traders, the moving average is a way to better understand the market and find the right points to open trades. If you have a tool at hand that can simplify the process of trading and understanding the market, then why not use it?!
- Previous lesson: Trend lines in binary options trading: how to build trend lines and what they show
- Next lesson: Technical analysis patterns in trading: basic technical analysis patterns with images and examples of use
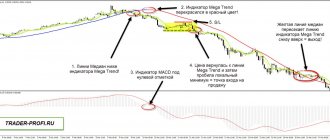
EMA+ADX+MACD strategy
This trading system works with any currency pairs, but with the H1 time frame. First, EMA 21, EMA 7, MACD 12, 26, 9, ADX 14 are set. The example shows when you can enter the market with the euro/dollar currency pair.
Entry rules:
- The faster EMA 7 crosses the EMA 21 line.
- ADX 14 is directed upward, located above level 25.
- The MACD indicator crosses the zero mark.
The image shows entry points that are carried out in accordance with all the rules. The deal is closed at the moment the price crosses the EMA in a different direction.