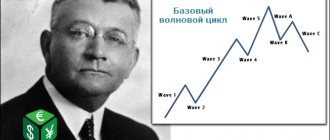
It's no secret that the price moves in waves. For a long time, traders have tried to find ways to analyze these movements and predict the future of prices. Taking wave analysis as a basis, many different theories were created, the main one of which was “Elliott Wave Analysis”. Ralph Nelson Elliott was a professional accountant who had access to extensive data on price movements going back decades. Elliott noticed that price movements looked like waves and began analyzing the charts. He analyzed the price charts of many trading instruments, and devoted time to annual price charts, as well as monthly, weekly, daily, hourly and minute ones.
Elliott's theory was that any trend consists of three impulsive price movements and two pullbacks against the trend - a total of 5 waves, after which the trend ended. Each impulse wave can be decomposed into 5 smaller waves, and each correction into three more waves. The resulting waves could also be viewed on a smaller scale:
Elliott outlined the results of his work in the book “The Wave Principle,” which was published in 1938. But the theory of wave analysis was not popular among traders. Only 50 years after Elliott's death did they begin to take a serious interest in the theory of wave analysis. Such popularity is the merit of Robert Prechter, who popularized “Elliott Waves” and also brought them to mind.
Brief historical background
Ralph Nelson Elliott proposed that market movements have a wave nature in the 1930s. He carefully studied the charts, which allowed him to notice certain patterns in the development of prices in the stock markets. Each pattern corresponded to a specific model. The author laid a mathematical basis for his theory in the form of Fibonacci numbers - a numerical sequence that was discovered back in the 18th century.
The patterns that Elliott was able to substantiate were repeatable in form, but could differ in time and amplitude characteristics. The author identified 13 similar patterns, called waves, that constantly appeared in market price data. He was able not only to identify them, but also to present them graphically with full justification:
- illustration of each model
- the relationship between all waves;
- the formation of larger-scale similar models, each of which can form even larger waves of the same size.
Thus, the theory was called the wave principle, and in 1938, Ralph Elliott published his own book with the same title, “The Wave Principle.”
Subsequently, a significant contribution to the popularization of this theory was made by financier Robert Prechter, who also contributed to the development and relevance of this approach as one of the methods of market analysis.
Robert Prechter
Of course, Robert Prechter did the most work here. It was thanks to him, when he took up the banner from Frost, that Elliott waves gained widespread popularity, almost 50 years after the accountant Elliott wrote a book on them.
Many technical systems have a similar fate. They are forgotten, not appreciated during their lifetime, and then suddenly they become popular when they are promoted by a fanatical follower. To this day, Prechter is considered the leading expert on Elliott waves, and his website elliottwave.com is the world's premier resource on this topic. There are a lot of cool forecasts, for example, experts from Prechter’s website predicted the 2008 crisis without any problems several years before it appeared. In fact, the modern Elliott is Prechter and his school.
It is the books of Robert Prechter (including those co-authored with Frost) that need to be read to understand this topic.
Elliott waves, at their core, have a fractal basis and the task of their practitioner is to decompose the waves into understandable elements. We will look at them now.
What are Elliot waves and their features
Elliott waves can be interpreted as a graphical method of technical analysis, thanks to which it is possible to assess the behavior of market participants by directly studying price movement waves.
Each trend has its own structural sections, called waves, and they often repeat themselves. It is customary to distinguish two types of waves – impulse and correctional.
Impulse models are characterized by movement along the main trend, while correctional ones reflect the adaptation of the movement to them. The key analytical figure is presented as a combination of an impulse and a corrective wave. Schematically this is indicated as 1-2-3-4-5/ABC. Next, division into lower-order waves occurs.
All impulse waves are designated by numbers from 1 to 5, and corrective ones are assigned the letter value A, B and C. As Ralph Elliott stated in his theory, in every trend there can be seen a combination of fives and threes, that is, a combination of impulse and corrective patterns .
What's the difficulty?
one can definitely say how to correctly apply this method in practice. Therefore, in order for this article to be as useful as possible , I suggest doing the following.
- Think and answer the question : do you want to spend several years studying to learn how to trade according to the rules of wave theory?
- If the answer is no , then you only need to look at two sections: “ Elliot Waves: A Simplified Version of a Complex Theory ” and “ Case Study: How Elliott Waves Can Strengthen an Indicator Strategy .”
- If the answer is yes , then you need to thoroughly study all the material in this article and then draw up a self-preparation plan for 2-3 years.
Whatever answer you give, reading this article will give you a whole range of benefits .
- From a series of selected videos you will learn the basic principles of wave theory;
- You will immediately understand what the main problem of all wave traders is and why this forecasting principle is not as popular as technical analysis;
- You will have access to a selection of textbooks that will allow you to gain in-depth knowledge about the wave structure of the market. All books are available for free download and do not require any response from you.
So let's begin!
Five-wave model
Market price movement is displayed as a 5-wave form. The first, third and fifth are waves of directional movement, that is, impulse ones. The second and fourth are waves of the opposite movement, that is, correctional, or pullback.
The author of the theory attributes three immutable properties to the five-wave model:
- the second wave never crosses the starting point of the first wave;
- the third wave is never characterized by the shortest length of all five;
- the fourth wave can never enter the price territory of the first wave.
Moving models have a five-wave structure, while correctional models have a three-wave structure with various variations. In one complete cycle you can count two phases and eight waves:
- a five-wave driving phase is formed (numerical designation);
- then a three-wave correction phase appears (letter designation);
- provided that the second wave corrects the first, then the sequence A-B-C will correct the sequence 1-2-3-4-5.
Each trend will last such a time during which all five waves are formed, and then a correction or reversal may follow. In the second case, two pulse-type waves will be observed, the structure of which is represented by ten segments.
As noted above, the 1st, 3rd and 5th waves are characterized as impulse waves because they follow a trend movement. But the 2nd and 4th waves will be of a correctional type. Analyzing the A-B-C structure, the situation will change as follows:
- this structure is part of the downward wave;
- A and C become impulse waves;
- B is a wave that is directed upward and is corrective in nature.
Nature of vibrations
At first glance, the trading process is absolutely chaotic, especially if you watch it on a one-minute time frame. However, even on it one can distinguish Elliott waves. They are made up of a constantly shifting balance of supply and demand , and this happens cyclically, not necessarily due to changes in market conditions, but at least because someone takes profit without having any idea what will happen next and thus creates a movement in the opposite direction side. This entire process of forming new Elliott waves can take from minutes to months, depending on the scale of the money involved in the formation of the movement. The author has introduced a special system for marking, which provides a variety of notations for separating fluctuations by their magnitude and length - from a global supercycle of two Elliott waves to hourly ones. For smaller periods, there is no particular point in marking, since the effect of market noise is too strong, which some attribute to automated algorithmic systems.
So, Elliott waves consist of two types - impulse waves and corrections . They differ as follows: an impulse wave has five components, a correctional wave has only three. The logical question of why exactly 5 and 3 can be answered if you try to select the simplest combination of identical components so as to distinguish one from the other and none of them was an integral part of the other. So it turns out that this number pair is the simplest solution. The following picture shows the decomposition of such a 5-3 cycle into its component parts with a sequential decrease in scale.
Fractality of wave structures.
Click the button to go through a step-by-step guide to Elliott Wave Theory and master it in a few simple steps Explore »
Advantages of Elliott Wave Theory
The main advantage, which is also a unique characteristic, of this method of technical analysis is that such structures are formed both during an increasing and decreasing trend.
If we consider the second case, when the market belongs to bears, then the market situation will be a mirror image of the bullish structure:
- impulse waves 1-3-5 become downward;
- waves 2-4 are upward correctional waves;
- A and C become upward corrective, and B becomes downward corrective.
It is important to take into account the fact that the trend structure is not tied to a time frame, so intervals cannot in any way affect the formation of waves.
Let's summarize the information received
Wave theory is a complex forecasting method that traders with many years of market experience are trying to master. If you are new to the market, start with the basics and gradually move on to learning more complex patterns. For example, right now you can find out why investing in stocks is interesting.
Friends, if you have completed a full course of preparation and are ready for decisive action, you should not wait . Choose a suitable broker and try to convert your knowledge into money. Here are the companies I recommend you work with: Just2Trade and Amarkets .
Subscribe to my publications, share articles on social networks and don’t forget to leave comments . Thank you for your attention!
If you find an error in the text, please select a piece of text and press Ctrl+Enter. Thanks for helping my blog get better!
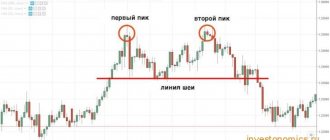
Elliott Wave Theory Rules
In fact, it is not so difficult by eye or just visually to see the five-wave pattern. If you can count to ten, then you are welcome - just look at the graph and indicate the cycle. However, there is a catch - and it lies in subjective judgments. Two traders, analyzing the same chart at the same time, can express completely different variations and opinions about the structure of the waves that are formed in the trend.
It is in order to ensure that the subjectivity factor does not interfere, that the key rules for the formation of Elliott waves were developed. The author himself partially introduced them, and the remaining principles were added by other theorists and experts over time.
The basic rules of Ralph Elliott wave theory are as follows:
- the second impulse wave cannot fall to the level of the starting point of the first wave. If such a phenomenon occurs, then there is no point in asserting the formation of a trend;
- the third impulse wave cannot be higher than the maximum point of the first wave, and it cannot be the shortest among all three, unless we are talking about long time intervals;
- the fourth impulse wave cannot be below the low point of the first wave. Sometimes this rule can be circumvented, but the following principle written below cannot be ignored;
- the fifth impulse wave should always be higher than the maximum point of the third.
Additional rules that determine the correct and correct definition of waves include the following postulates:
- intra-pulse corrections must be of varying complexity, and also have their own unique parameter of nominal size or creation time. If the values of at least one parameter coincide, then it is impossible to assert that a trend has formed. There is always a possibility that a complex correction model is being formed at the current moment in time;
- if the structure follows all the rules of construction, then one of the driving waves will always be stretched, thus its nominal size will be larger than the other two impulse waves;
- three waves in a row that form a wave structure must appear at different times.
Taking into account all the listed rules, a trader can analyze the chart and identify where there is an impulse structure and where there is a correctional structure. If all the rules are followed, then the chart now displays an impulse type wave. If one or more rules are not met, we can assume that the situation is characterized as a correction or an impulse wave that has not yet fully formed.
How to correctly identify Elliott waves on a price chart?
Follow the following recommendations to correctly and effectively identify wave structures on a chart during analysis:
- in the case when the third wave is larger compared to the first and fifth, then they will be equal in length - this technique is useful when you analyze the state of the market at the end of the fifth wave. If the length of the fifth wave turns out to be greater than the third, and the length of the third is greater than the first, it means that the fifth wave is fully formed and now we are focusing on the top of the fourth;
- When studying the structures, experts identified the following pattern - correctional waves the second and fourth can be of different sizes, while alternation at certain intervals is acceptable. For example, the strength of the correction in the second wave could be quite noticeable, therefore, in the fourth it will be much weaker, and vice versa. This recommendation is useful to calculate the time of the onset of correction by the time the fourth wave appears;
- if the correctional wave A-B-C ends, then this process should occur only at the minimum point of the fourth wave.
Content
- Elliott Wave Analysis Theory - Impulse Wave Pattern
- Elliott Corrective Waves
- Types of Elliott Corrective Waves
- Elliott wave labeling
- Practical advice on Elliott waves
Elliot waves and their graphical interpretation
It all starts with charts, so to apply wave theory you will need to use indicators. It is best to display a chart in the form of Japanese candlesticks, which combines information content and objectivity.
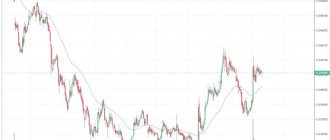
On the chart, the wave structure looks like this:
It is important to perform the following sequence of actions:
- We determine a significant turning point, most often this is implemented using the “Signal Line” tool. When it intersects, a new period will begin - this will be our object of analysis;
- When we have decided on the turning point, it is necessary to identify each wave in the structure. This process is considered the most complex and the quality of the subsequent analysis depends on its literacy. Always remember that the assigned structural designation cannot be revised or changed in the future unless there are compelling reasons for doing so. You determine the time scale yourself, but it is better to use an interval that is no longer than 30 microwaves. Now you can place all motion markers;
- the final stage is characterized by compaction of the wave, when it will be assigned the corresponding number of a structural element in a larger scale system. The graph will be assembled from several entire structures into one large one - microwaves will form a complex model.
In this way, we can see the market structure and make predictions about its further development.
Practical interpretation of Elliott waves
Most often, traders resort to the Elliott wave theory to implement their trading strategy when an impulse wave appears from a trend reversal point. All trades are opened within the first three driving waves, and it is extremely important to be careful, since there is always a risk that the chosen structure may turn out to be an element of a correctional model.
If an impulse wave has formed, we wait for the moment when the first correction occurs. At the moment of its completion, you can receive a signal to enter the market. Next we will look at methods of trading using waves.
Trader's library
In this section, I have collected for you a selection of thematic literature for self-study . If you want to receive accurate analytics and forecasts on Elliott waves, then it is advisable for you in detail with all the textbooks listed below.
You can download all material for free and without any registration . To read you will need programs that open PDF and DjVu .
- Download PDF reader
- Download the program for reading DjVu files
Safronov’s book “ Practical use of Elliott waves in trading ” is available at this link .
You can download Robert Balan's textbook here .
Download the complete course from Frost and Prechter.
Get the book Mastering Elliott Wave Analysis by Glen Neely .
Continue reading Dmitry Vozny's reference book.
Download Joseph's tutorial on simplified Elliott wave analysis.
All listed books on wave analysis are in this archive .
Friends, I understand that the proposed list of references is far from complete. Therefore, if in the process of getting to know the topic you discover any useful book, please write its name in the comments under this article. Let's study together .
We open trades using the conservative method
When the movement in the direction of the original impulse resumes, we draw a signal line through the reversal point and the point of the expected end of the correction.
It is appropriate to open a long position at the high of the first wave of movement. If the price chart has not reached the order level and begins to reverse with a breakdown of the signal line, then you monitor its behavior so that the fall does not reach the reversal point and below. When growth resumes, the line will adjust relative to the new minimum level.
If you placed an order immediately, you continue to monitor the behavior of the signal line. When the price reaches and touches this level, it is necessary to close the deal and place a new order, the level of which will correspond to the extreme maximum.
If, after touching the signal, the price chart moves again in the direction of the trend, there is no need to despair and panic. Such work moments happen often, so take such phenomena from a philosophical point of view. You can always compensate for your losses if you open a new contract.
Opening trades using a moderate or aggressive method
The initial stage of trading when using a moderate strategy remains the same as with a conservative technique. However, the significant difference is that placing an order occurs at the end point of corrective wave B. Remember that the expected correction may last longer than you expect. We adjust the signal line according to the principle of a conservative approach, and similarly close the trading position. This option is relevant in trading if you are a beginner.
If you are trading aggressively, this assumes that the order will only be placed after the signal line has been broken. The very fact of intersection is a signal of the completion of the structure and the beginning of the construction of a new wave.
How are indicators used when trading Elliott waves?
There is no ideal indicator that can be used to quickly and effectively form a wave cycle. Now it offers a large selection of different modifications, and traders can choose instruments that suit their strategy and financial goals.
The most popular indicators for technical analysis and identification of wave structures are the following:
- Elliot Wave Oscillator;
- Elliot Wave Prophet;
- Watl.
Let's look at each of them in detail.
Elliot Wave Oscillator
This indicator displays a histogram, reminiscent of MACD. The highest peaks will correspond to the third driving wave. Can be used to analyze any time frame, but it is better not to use it if you trade on too short time intervals.
When the histogram crosses the zero mark in the direction from below or from above, divergence will appear, which signals the end of the next wave structure.
When, during the first corrective movement, the oscillator breaks through the zero level in the opposite direction, then the creation of the third wave should be confirmed by a new divergence. If it does not occur, it means that the calculation of the starting point of the model occurred incorrectly.
When the histogram falls by 30-50 percent relative to the local extremum, this is evidence that the third wave has ended and the second corrective segment is beginning to form. The completion of the creation of the fifth wave should be accompanied by divergence, that is, the ascent or decline of the price chart is supported by a corresponding decrease or increase in the histogram bars.
Referring to the first trading rule, the trader must wait for the moment when the zero level is crossed with confirmation of this action. When we have a growing trend, the histogram will be displayed above the middle level, if there is a falling trend, then below the middle level. You can open a trade after the first divergence. Rising prices and falling oscillator values will indicate a favorable moment to open a short position, and if the opposite divergence occurs, then a long position is relevant.
If the corrective movement falls or rises by about a third relative to the first impulse wave, you can enter the market after that. The stop loss is placed at the extremum level and the signal to complete the trading operation will be the moment after the appearance of a new divergence.
Why are Elliot waves criticized?
The theory put forward by Ralph Elliott has often been criticized and many opponents have argued that it is useless for practical application because it is characterized by a subjective approach. Some traders claim that this method of analysis results in losses rather than profits in most cases.
According to Benoit Mandelbrot, the predictions obtained using the wave theory are not unique. This art is subjective, but the priority should be an objective assessment based on calculations and combined characteristics.
When criticizing Elliott’s original methodology, the following aspects are most often raised:
- it is impossible to predict the price movement, since the chart may have significant discrepancies with the formed waves;
- wave analysis is accompanied by many nuances that not every trader can understand. For example, it is not always possible to determine the beginning and end of a wave;
- the best waves are visible only on historical charts, and their practical application is too difficult due to the influence of various factors.
How to make wave markings from scratch: a practical example
Select a trading asset and, using the “ Wave Marking Notations ” table, identify the waves on the senior cycle and all the associated connections.
Wave notations
After this, make markings on the chart, determine the current position of the wave and make your own forecast. Below you can watch a video in which a visual description of the considered algorithm is made.