We have already discussed the topic of constructing Simple Moving Averages once. Here we will talk in more detail about the theory that is associated with the EMA indicator for MT4.
In particular we will consider:
- how do moving averages differ from exponential averages?
- how to build EMA correctly;
- how to use the EMA indicator;
- how you can use EMA in conjunction with other Forex indicators;
- what trading strategies exist using EMA.
As a reference, let us recall what moving averages exist:
- Exponential Moving Average.
- Simple Moving Average.
- Linear Weighted Moving Average.
- Smoothed Moving Average.
EMA construction
Forex traders often use moving averages SMA and EMA in trading. EMA is calculated using the following formula:
(CLOSE (i) * P) + (EMA (i - 1) * (1 - P) = EMA,
Where:
- EMA (i - 1) – displays the value of the moving average for the previous period;
- P – share of price value usage;
- CLOSE (i) – closing value of the current period.
The formula of the EMA indicator for MT4 is constructed in such a way that the value of the first prices will have a minimum value, and the price of the last ones will have the greatest value. As for the simple moving average, for it the value of all Japanese candles will be the same.
Which period to choose
This is probably the most difficult question, if everything is clear with types and you can somehow understand what you need, then with periods it’s more difficult...
I myself chose for myself for quite a long time, but I still found ones that suit me and are understandable.
There are many different options in various technical analysis books and other sources. But it is not always clear why exactly this period and where it came from.
And you just need to remember why and where these periods come from, period 10 is information for a period of ten days, 20 is for twenty days. And then you can easily understand what period is needed for information for 1 month, 3 months or six months.
But this is not the only way to select a period; many traders prefer to use numbers from the Fibonacci series for this. By the way, when selecting one period, I also took the Fibonacci number, because I myself use Fibonacci levels in my trading.
So all the periods have been tried and selected a long time ago. But this can also play into our hands, because we can use the most famous and used periods, because they are used by a huge number of traders, which means this is an opportunity to see the same thing as them. Just don’t think now that if everyone uses it, it means it doesn’t work... That’s not true...
Timeframe: Average periods
5-day: 8, 13, 21
1-day: 8, 13, 21, 55, 89
4-hour: 8, 34, 55, 89, 144
1-hour: 8, 34, 55, 89, 144, 200
In order to select the MA for any trading instrument, you need to select the type of moving average and the number of the period. The period number is selected depending on the mobility of the trading instrument (currency pair, stock, futures), its tendency to trend and, of course, personal preferences. The more mobile the instrument, the more smoothing is required and, consequently, the longer MA (longer period). In general, the selection method, trial and error, is most effective in this case. The main thing to remember is what to do: if it is clear that many breakouts are occurring, you should lengthen the MA (increase its period), reducing the sensitivity of the moving average and vice versa. And, of course, combine the MAs themselves, use both simple and exponential ones.
What are the differences between SMA and WMA from EMA?
Below in the screenshot of the chart there are three moving averages that have the same periods. Faster EMA (black) compared to SMA (red), but smoother compared to the WMA indicator (blue).
Thus, the applied moving averages in relation to the current price will move either closer or further .
Figure 1. Currency pair – EUR/USD, indicators – SMA10, WMA10, EMA10.
Calculation of the EMA instrument
In order to calculate the required point on the timeframe, you should add part of the real closing cost to the previous price. In practice it looks like this:
EMA (t) = EMA (t-1) – EMA (t-1)) + 2*(P(t) , where:
- EMA (t) – exponential indicator for a specific cycle;
- P(t) – the price at which the previous Japanese candle closed;
- EMA (t-1) – the size of the previous segment to be measured.
Many traders do not study the rules for calculating the indicator, but only remember when to use EMA and when not to. The main advantage of the indicator remains its quick response, and if the trader’s system is based on entry precisely at the moment when a new trend in the market is just emerging, you just need to correctly set the parameter for the time frame on which trading is taking place. You can find a description of the EMA indicator on the website of any Forex broker.
Application of exponential moving average in trading
The EMA indicator is used in trading for the following purposes:
- Stop-Loss settings.
- Determine the direction of the trend.
- Trading signal after moving averages cross.
- Acts as resistance/support zones.
- Can be used with a number of other indicators.
Note that Exponential Moving Average perfectly determines the current market trend. For a bullish Forex trend, the following conditions must be met:
- the EMA indicator should look up;
- the current price is above the EMA;
- an exponential average with a shorter period should be above an EMA with a longer period.
Let us note that a correctly selected period of the exponential average line for the specifically considered time frame will qualitatively indicate the levels of resistance and support. To limit losses through Stop Loss, this stop order should be placed far beyond the EMA indicator for MT4, and not forget beyond local extremes.
Many traders continue to consider the moment of crossing the EMA at various time intervals as a strong signal to enter the market. But this approach to market trading no longer works , since the EMA lags behind the market movement, especially when it is in sideways movement.
We recommend the EMA indicator for MT4, but still use it for charts up to H4 . The fact is that this indicator reflects the current price position more accurately than all other moving averages.
This is how the EMA indicator with a period of 50 looks on the chart of the EUR/USD currency pair, timeframe H4:
Figure 2. EUR/USD, H4, EMA50.
Installation and configuration of the indicator
Since EMA is one of the most common technical analysis tools, the vast majority of trading programs and platforms have included it as part of their basic set of analytical tools.
Therefore, installation will not cause problems: just go to the trading platform settings, enter the “Indicators” menu, go to the “Moving Averages” subsection, then select EMA.
Now let’s look at the main parameters of this tool, which traders often have to configure. They directly affect its efficiency and performance:
- Period
. For trading on the binary market, the recommended value is 21 bars. But some strategies also use shorter periods. - Shift
. This setting means shifting the lines a certain number of candles forward. Due to this shift, the moment of price reversal can be determined in advance. - Moving Average method.
To use the EMA indicator for analysis, you need to select the Exponential setting. - Mode of application.
Here the trader can choose to work on the closing, opening, high or low of the candle. - Style
. In this settings item, you select the color and thickness of the moving average line. The display does not affect the functionality of the tool, but it can greatly simplify the process of reading data for a trader.
Remember that EMA is a trend indicator that reacts to the trend direction vector. And it reflects not only the current state of the market, but also provides an up-to-date forecast of the nearest developments. At the same time, it is important to understand that in some situations its use is not only ineffective, but can simply be associated with huge financial risks - here we are talking about sideways movement of the trend. In this case, it is possible to achieve at least some efficiency from the indicator only if you set the minimum number of periods.
About false EMA breakouts
Like any indicator in the Forex market, it cannot be called an ideal tool for making money . The EMA indicator also shows false entries, which are not always identified by market participants within the framework of breakdowns of moving averages. Often, false breakouts are observed during sideways market movements. After all, the price periodically breaks through the EMA from top to bottom, then from bottom to top.
Naturally, in such cases, the Stop Loss will need to be moved far beyond the limits of the opposite polarity of the exponential moving average. You need to focus on nearby local extremes.
Figure 3. Examples of false breakouts.
2.2. How to use the OSMA indicator
The OsMA indicator is included in many popular trading platforms, including MT4. It is located in the oscillator group.
When setting up the Moving Average of Oscillator, four main parameters are used.
Let's look at them in more detail.
1. Slow EMA – exponential moving average of price with a relatively long period. The default here is 26.
2. Fast EMA - the same moving average, but with a short period (12).
3. The MACD indicator is calculated by subtracting the fast EMA from the slow one. MACD SMA is a simple moving average of MACD values (signal line), the task of which is to smooth the histogram. Its period is usually short, in our particular case it is 9.
4. For the price type parameter, you can use any source data. Traditionally, this is the closing price of bars (Close). But you can also use other initial data: price minimum (Low) or maximum (High), opening price (Open), as well as various average prices (Typical Price, Median Price, etc.).
////////////////// You may be interested in the article “Forex Trading Systems”. //////////////////
The main disadvantages of working with the EMA indicator
To better understand what the Forex EMA indicator is, let’s talk about its disadvantages:
- All moving averages follow price, and therefore they are late in identifying a new trend. They become effective only on pronounced price movements.
- The pair can move long enough until the EMA indicator shows a signal to enter the market.
- There are many false signals within the “sideways” trend.
- Due to the fact that the indicator does not keep up with the price, its signals will be delayed, which increases the risk of making a profit on the transaction.
2.3. How OSMA indicators work
Since the OsMA oscillator is very closely related to the MACD indicator, it is not possible to talk about its trading signals in isolation from the MACD itself. Therefore, the behavior of both “OsMA” and MACD, in different market situations, will be analyzed by us simultaneously.
First, let's look at the simplest trading signals:
1. Signal to buy (long position) – it occurs when the “OsMA” histogram crosses the zero level in the upward direction. Further growth of the oscillator bars tells us that the bullish trend is strengthening.
If at this moment we look at the MACD, the parameters of which were configured in the same way as the “OsMA” parameters, we will see that the MACD histogram crosses its signal line (SIGNAL) also in the upward direction.
In the future, as the distance between MACD and SIGNAL decreases, the growth of the OsMA indicator bars will also slow down and begin to decrease. The very fact of such a fall means that the trend is weakening and calls for thinking about closing the transaction.
2. Signal to sell (short trade) – this will be the opposite situation, namely the “OsMA” histogram crossing the zero line from top to bottom. If the OsMA bars then continue to rise downwards, this will confirm the emerging bearish trend.
Look at the MACD at this moment and you will see that its own histogram also crosses the SIGNAL line from top to bottom. At first, the distance between MACD and SIGNAL will increase, causing the “OsMA” oscillator bars to grow, but then as this distance decreases, the height of the “Moving Average of Oscillator” bars will begin to decrease in direct proportion. There is a weakening of the downward trend! It's time to think about closing the sell position.
It is also worth noting the possibility of false signals. Therefore, for reliability, it is recommended to additionally use some other technical indicators that will strengthen protection against trading against the trend and help in determining the most profitable entry points.
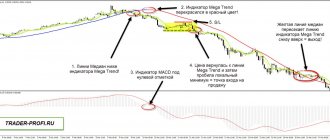
Trading system “Alligator”
For the work to be considered completed, we need to install 3 EMA indicators, which will have different parameters and shifts over time periods. In addition to them, you will need to install the Fractal indicator.
For deeper trading efficiency, it is best to pay attention to the following parameters:
- EMA 9 (shift 3);
- EMA 15 (shift 5);
- EMA 25 (shift 8).
The construction of all exponential averages is based on half the sum of each closed candle.
Please pay attention to the location of the current price . If it is above its value, then only purchases are considered. If it is under the moving average, then sell. You should take profits when the movement slows down.
In the example below, we showed examples of work using the Alligator strategy. Price moves beyond all exponential moving averages when a bullish trend occurs.
The 1st local maximum is formed (it is marked with the fractal indicator). Our EMA 9 indicator breaks through two slow moving averages from bottom to top. So, we can observe how 2 signals are generated simultaneously:
- The EMA lines are crossing.
- Fractal appears.
Figure 4. Alligator trading.
More cautious traders who have read the description of the EMA indicator prefer to wait for the price to roll back to the lips of the “Alligator” and only after that enter the market. However, in this case, it was possible to open a sell transaction.
Conservative traders can wait for the price to fall back to the alligator lip line before entering trades. From our point of view, this approach is the most correct.
1.3. How EMA indicators work
This indicator will be required if you need to adapt the EMA to any external parameter (volatility, volume, speed, etc.).
You can use a fractional period in calculations (for example, 21.5), and also use a coefficient instead of a period. For example, Wilder uses EMA with a coefficient of 0.07143 (1/14) in his ADX indicator.
The indicator also adds two price options for calculation: the arithmetic mean (O+H+L+C)/4 and the median option calculated as (O+C)/2. By definition, the median must meet the condition that 50% of the sample prices are above it, and 50% are below it. And since we are dealing with a sample of 4 points (Open, High, Low, Close), the median (H+L)/2 entered into MT does not always correspond to the 50/50 condition.
Indicator parameter for selecting the price type SetPrice:
0:Close; 1: Open; 2:High; 3:Low; 4: (High+Low)/2 5: (High+Low+Close)/3; 6: (High+Low+2*Close)/4; 7: (Open+High+Low+Close)/4; 8: (Open+Close)/2;
If the EMA rises, this is a signal to open a buy position. When the price approaches the EMA indicator line or just below it, you need to enter the game. The stop loss is placed below the previous low, tightening it as the price rises.
When the EMA falls, you should play short. We open a sell position when the price is located near the EMA line. Stop-loss is placed above the previous high, lowering it as the price decreases. If the EMA has a horizontal tendency to move with small fluctuations, then this indicates the presence of a flat. In this case, you cannot play using EMA.
The EMA indicator works without delay, so be careful as you can accidentally react to the wrong signal, which will lead to erroneous actions.
The main signal produced by the indicator depends on the direction of the movement of the foreign exchange market. Once the indicator goes up, the trader, in turn, needs to immediately start trading for an increase. If it starts to go down, then, accordingly, you need to play short.
////////////////// You may be interested in reading the article “Trading Terminal”. //////////////////
Using EMA with other indicators
As we wrote above, exponential average lines can be used in conjunction with the Stochastic indicator.
To do this, you need to plot the following indicators on the chart :
- EMA50 (blue);
- EMA13 (red);
- EMA4 (green);
- Stochastic Oscillator with levels 60 and 40, as well as values 12,9,5.
Let's look at an example of this strategy on the EUR/USD pair Н4 .
If we look below, we can see that the lines of the Stochastic indicator are significantly ahead of the signals from the EMA.
So, let's figure out when to open a sell order:
- When the green moving average crosses the blue one from top to bottom.
- Stochastic will break through level 60 from top to bottom.
- The blue EMA will be crossed from top to bottom by the red moving average.
Figure 5. EMA + Stochastic.
Stop Loss is set 50 points from the entry point. Profit taking occurs when the price goes beyond the blue moving average.
2.1. Description of the OSMA indicator
The name of this indicator is translated as “Moving average of the oscillator”. And this perfectly reflects the essence of this analytical tool.
Its main purpose is to identify bearish and bullish divergences (discrepancies between the directions of movement of the oscillator and price).
The indicator is calculated as the difference between the values of the MACD oscillator and its signal line, which is the moving average. The results obtained are displayed on a graph in the form of bars that rise or fall relative to the zero line.
It turns out that when MACD is above the SIGNAL line, the OsMA histogram will be located above the zero level. Conversely, when the MACD is below the SIGNAL line, the OsMA bars will be placed below the zero line.
Also, the greater the distance between MACD and SIGNAL, the longer the bars of the histogram of the OsMA indicator. The opposite is also true - the closer MACD and SIGNAL are, the shorter the oscillator histogram.
If MACD and SIGNAL coincide, the “OsMA” value will be zero, and the corresponding oscillator bar will simply not be drawn (usually this can be observed at the moment the histogram transitions from a negative to a positive area and back)
EMA+ADX+MACD strategy
To work with this TS we can use absolutely any pair with the H1 timeframe . But first, let's set the following indicators:
- EMA21;
- EMA7;
- MACD12,26,9;
- ADX14.
As an example, let’s look at how we will enter the market on the EUR/USD pair, H1 timeframe. The entry rules are as follows:
- The faster EMA7 crosses EMA21.
- The ADX 14 indicator is directed upward and is above level 25.
- The MACD indicator crosses the zero mark.
In the screenshot below we have marked the entry points numbered 1,2,3. Entry is made in accordance with all rules. It is necessary to close the trade as soon as the price crosses the EMA in the other direction.
Figure 6. EMA+ADX+MACD.
As a conclusion, we note that we talked about the exponential moving average, as well as how it can be used with other indicators. Still wondering if you need to download the EMA indicator or if it’s not worth your time? We hasten to assure you that it is definitely worth using in conjunction to filter profitable signals.
Some tips for using EMA
In order for a trading operation to be as profitable as possible and minimally risky, it is recommended to take into account a number of nuances when using this analytics tool. In particular:
- since trading is focused on short-term positions, you should not pay attention to economic news and extrapolate them to the price chart - the events simply will not have time to affect the price before the order is closed;
- It is best to conclude a deal within the first ten minutes of the hour;
- do not use large time frames - in this case the information content will be very low;
- do not trade exotic binary pairs - the optimal solution would be EUR-USD or either gold;
- it is necessary to select the time for closing transactions so that it falls at the end of the day or trading session;
- do not take risks: if there are doubts about the forecast, then it is better to wait for a more favorable moment for trading;
- watch out for fatigue: since turbo options are usually traded in a series, a series of successful transactions dulls control and attention, which is fraught with mistakes.
EMA is widely used not only as a stand-alone analytical solution, but also perfectly combined with tools such as RSI and MACD.
Exponential Moving Average is an effective and, for most experienced traders, an indispensable assistant in trend trading on the binary market. It will be an ideal option when working with both short-term and medium-term orders; it shows the greatest performance when used with 15-minute options. The EMA indicator allows you to almost accurately determine the direction and strength of the price and reduce the risks inevitable for this field of activity.
3) WMA
By analogy with the previous option, weighting is used over a sequence of values, but now it is no longer exponential, but linear. That is, the weight of each subsequent term decreases by a certain amount, depending on the period. The result is a uniform decrease in significance over the entire range used.
The difference between EMA and other MAs
Sliding simple is like a journey in which you have to either walk in a straight line, or climb a mountain, or dive to the bottom of the sea, or fly by plane from one continent to another. And only the average time spent on the entire journey is taken into account.
Sliding weighted is more like moving on steps. More important is the place where the price is located or the level where you need to rise. The steps that have already been completed are no different from those that lie ahead.
The EMA indicator can be compared to climbing a mountain. Sometimes the path is straight and simple, sometimes it turns into a serpentine path, sometimes flat, sometimes steep, but the only thing that matters is the place where the price is now. The path taken is completely irrelevant.