The EMA (Exponential Moving Average) indicator is an effective modified tool that takes into account the values of simple/weighted moving average parameters.
Translated from English, the name of the indicator sounds like “exponential moving average”. Essentially, this is an ordinary Moving Average with the Exponential method specified in the settings. Thanks to this indicator, a trader has the opportunity to more accurately monitor the dynamics of an asset, determine trend change points, and make profitable trades.
There are 4 types of moving averages:
- indicated above - Exponential Moving Average;
- simple (Simple Moving Average);
- smoothed (Smoothed Moving Average);
- and Linear Weighted Moving Average.
Exponential is considered the most convenient and successful option.
The EMA indicator takes a set of data (closing price levels for a specified period) and provides their average price. Moreover, the MA moves along with the price, not limited by any ranges or boundaries. Time frames can be different, moving averages at all time frames can lag - as a rule, the longer the period, the stronger the lag (on small time frames the lag is minimal).
Application of exponential moving average in trading
EMA is most often used in combination with other indicators, since even the strongest signals generated by the moving average alone may not be accurate and sufficient to open a trade.
How to use the indicator in trading:
- In trading strategies - combining with other indicators, wave or Japanese candlestick analysis, etc.
- In order to determine the current trend.
- To find Stop-Loss installation locations.
- To receive trading signals after crossing moving average lines.
- As support/resistance zones.
EMA is good at identifying the current trend in the market. So, if bullish reigns, then the indicator looks up and the current value is located above it, and the exponential average of the shorter period is above the EMA of the larger period.
The correctly selected exponential average period for the timeframe used will show support/resistance levels. To limit losses with a stop loss, the order is placed outside the indicator, keeping in mind local extremes.
Traders often perceive the moment of lines crossing on different timeframes as a powerful signal to enter the market, but this is incorrect, since moving averages lag (especially if there is a sideways trend).
It is best to use the exponential moving average indicator for charts up to H4 (for MT4, there may be other settings in Quik). At this interval, prices and the necessary indicators will most accurately be displayed.
The main features of the EMA (in comparison with the conventional moving average):
- The setting provides a larger number of signals and increases sensitivity to price changes.
- All signals need to be filtered, as the number of false positives also increases.
- EMA still has higher accuracy compared to SMA with a shorter period, for example (even if the parameter value is reduced and the sensitivity and number of signals are increased, SMA does not give the same result as EMA).
EMA is considered the most effective of similar tools.
Advantages of the indicator
Before using the tool, it is advisable to carefully study the description and test the indicator using a demo account or cent accounts ⇒. EMA has both pros and cons, which are discussed below.
Main advantages of Exponential Moving Average:
- Simplicity and clarity – easy to understand even for novice traders. The simple form and accuracy make it possible to effectively analyze the behavior of the asset price.
- Increased accuracy - after all, EMA is an already modified tool (it takes into account indicators of simple and weighted average values).
- Taking into account fresh data in calculations, providing up-to-date information.
- More rapid response to trend changes (compared to a simple moving average) - short periods imply increased sensitivity and false positives. Over long periods, the EMA is resistant to fluctuations and shows fewer turns. On long-term trends, the tool works better and is more stable.
- Help in accurately determining market direction and identifying flats.
- Possibility of use as support/resistance levels.
- EMA weighs nearby indicators and takes into account previous price information, which improves accuracy.
Main disadvantages
Among the disadvantages of the EMA indicator, it is worth mentioning such as a slight lag (especially with unexpressed price changes), the presence of false signals (often in a sideways trend), and a low level of efficiency in an unstable market. Because the exponential moving average is sensitive to rapid price changes, it is often used for short-term trading. But long-term trends are difficult to identify with EMA.
It must be remembered that EMA is more accurate and sensitive (compared to a simple one), but at the same time it can generate a greater number of false signals, so it is usually used in combination with other indicators, and not independently.
EMA construction
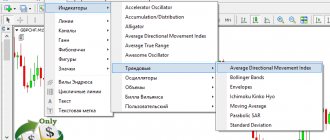
EMA is one of the built-in tools in the MetaTrader 4/5 trading terminal and other trading platforms; you just need to find it and install it on the chart. Let's look at the setup for MT4:
- first select the Moving Average indicator;
- then set the Exponential method. EMA is configured according to the type of work with other moving averages.
The trader has the opportunity to choose the thickness and color of the line, time intervals, and period. There is also an “Apply to...” setting with 7 values. This parameter shows which price to use: opening/closing, lowest/highest, average options.
In its work, EMA uses the exponential in the current and past periods. The default calculation is based on closing prices, but you can choose another option. In the “Help” tab (if used for MT4) the exact formula for calculating EMA is indicated.
Calculation formula
The indicator is calculated using this formula:
EMA (t) = EMA (t-1) + 2 x P(t) – EMA (t-1)) , here:
- EMA (t) – exponent in the current period;
- EMA (t-1) – identical indicator in the previous period;
- P (t) – closing price of the last session.
What are the differences between SMA and WMA from EMA
There are three popular moving averages - simple SMA, exponential EMA and weighted WMA.
The term “moving average” by default means a simple moving average (SMA). It averages price indicators, uses a certain number of past prices, slowing down the chart. When a new price appears, the old one is removed from the calculation and thus the SS seems to slide along the chart with the price.
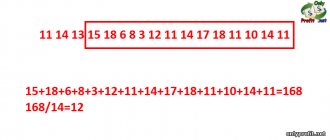
A simple moving average calculates the arithmetic average of the price (indicators are added and the sum is divided by their number).
The exponential moving average makes the latest data the most important, reacting more quickly to changes.
Here the calculation is more complicated: the arithmetic mean is calculated, but with the condition that the latest price is more significant than the earlier ones.
WMA is a weighted moving average, which also takes into account later prices as more important, but in a simple version: when calculating a five-day WMA, the current price has a five-fold weight, for yesterday - four times, for the day before yesterday - three times, etc.
The calculation is as follows: each price used in the calculation is multiplied by its serial number, after which the entire amount is divided by the number of serial numbers.
All calculations are performed automatically; the trader does not necessarily need to be able to perform them. The difference between the types of moving averages is not very big, but there is.
The simple moving average SMA lags the most, the exponential one is the most responsive and dynamic.
SMA works better in a sideways trend, EMA – in a pronounced trend (in a flat it gives false positives). For short periods it is better to work with EMA, for long periods - with SMA. Although, each trader chooses the instrument with which he is most comfortable working.
Description of the Forex strategy here ⇒
About false EMA breakouts
The EMA shows false breakouts, especially when the market is not showing clear direction. In sideways movement, false EMA signals appear especially often when the EMA breaks through the price either from bottom to top or from top to bottom. In such cases, a stop loss is placed far beyond the opposite polarity of the EMA and is guided by nearby local extremes.
When to open trades
For successful trading, you should choose periods of 5, 15 or 30 minutes. And the optimal time to open orders is 15–30 minutes before expiration. But the possibility of speculation with fast options with a closing time of 1–5 minutes is also not excluded. It is important to understand that each selected asset has its own quotation characteristics, so you need to configure the indicator for the specific trading pair used.
As an example, let's look at the features of trading by setting the EMA indicator signal with a rollback of 5 minutes and a period of 14 bars. This example will most clearly show all the features of working with options using this analytical tool.
To purchase an asset (open a CALL order), you must wait for the following signals to be generated:
- The price of the traded asset rises significantly above EMA 14.
- A candle appears, the value of which is 30–55% less than the maximum level exceeding the indicators of the chart of the middle line of the candle.
- If the subsequent second and third candles show a stable upward trend direction, then you need to enter into a trade.
To purchase a PUT option, the following conditions must be met:
- The price of the selected asset is below the indicator indicator.
- A candle appears, the value of which is 30–50% higher than that of the level curve.
- The contract must be concluded for 2 or 3 candles, provided they are directed towards the current trend.
Let us note once again that it is possible to minimize possible trading risks only if you do not resort to trading during a sideways movement of quotes. It is necessary to trade only if there is a stable trend and with the active use of trend lines. It is also important to consider that the forecast will be reliable only if the next candle after the signal does not belong to the Doji type (that is, it cannot be classified as a reversal).
Trading system "Alligator"
To use the system in your work, you need to install 3 EMA with different parameters and time shifts, as well as the Fractal indicator.
Best options:
- EMA 9 (with shift 3)
- EMA 15 (with shift 5)
- EMA 25 (with shift

All exponential averages are lined up at half the sum of each of the closed candles. You need to pay attention to the location of the current price: if it is above the moving average, you need to buy, if below it, you need to sell. Profit is recorded when the movement slows down. For ease of installation, you can find the Alligator indicator in MT4 and install it.
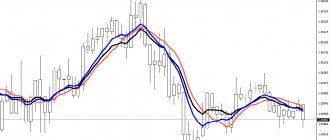
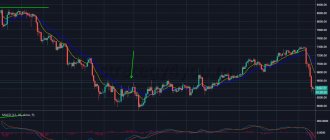
In the example below, you can see that price is outside of all exponential MAs when a bullish trend appears. The first local maximum is created (marked by the fractal indicator), the EMA 9 indicator breaks through two slow moving averages from the bottom up.
Two signals are generated at once: the EMA lines intersect and a fractal appears. Cautious traders wait for a price pullback and only then enter the market, but here they can already conclude a sell deal.
Advantages and disadvantages
EMA benefits:
- One of the easiest technical analysis indicators to set up and use,
- Wide range of applications in investment strategies,
- Can be used in all markets from foreign exchange to stock and commodity markets,
- Gives a clear signal to buy and sell,
- Allows you to determine not only the direction, but also the strength of the trend.
The disadvantages include:
- The need for customization for each instrument and interval,
- Additional indicators are often required to filter signals.
Trader reviews
When it comes to using moving averages, traders are divided. Individual traders on forums often complain that testing and adapting EMA-based strategies to familiar trading tools takes a lot of time. Nevertheless, many are satisfied with the results.
When trading EMA-based strategies, remember to pay attention to phases when the market is not moving with the trend. At these moments, trend indicators often give false signals, including the EMA indicator. You can recognize an off-trend phase of the market by the fact that the EMA fluctuates and does not rise or fall for an extended period of time. This is usually a period of low activity or, conversely, increased volatility without a clear trend. At such stages of the market, it is better not to use moving average signals at all or use them as an auxiliary indicator.
Source
Using EMA with other indicators
EMA works well with trend indicators and oscillators. When using several instruments, you can cut out false signals and receive double triggers, which will more accurately show the market entry points.
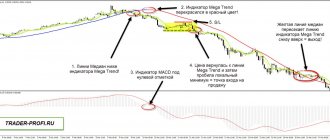
So, it works well with EMA Stochastic. To use the system, you need to plot EMA 50 (blue), EMA 13 (red), EMA 4 (green), Stochastic Oscillator with levels 60, 40 and values 12, 9, 5 on the chart. The example uses the EUR currency pair /USD and time period H4.
The image shows that the Stochastic lines are ahead of the EMA signals.
A sell order should be opened when:
- The green SS will cross the blue one from top to bottom.
- The Stochastic indicator will break through level 60 from top to bottom.
- The blue EMA line will be crossed from top to bottom of the red one.
- Stop loss is set at a distance of 50 points from the entry point. Profit is taken when the price leaves the blue moving average.
Example of EMA calculation
We will take a ready-made chart with an EMA plotted and check whether our calculations are correct.
We will skip the first step with calculating the simple moving SMA, because the history of quotes goes very far to the left.
At the second step, we obtain the “weight” of the values in the EMA. Since the chart uses a 10-period EMA, we will take the result from the calculations above = 0.1818.
Third step: take the current closing price (123.718), yesterday's EMA (121.763) and substitute it into the formula.
Rice. 3. Get the closing price of the “last” bar.
Rice. 4. Get “yesterday’s” EMA.
Having received the necessary values, we proceed to the calculations:
EMAtoday = (Closing price today - EMAyesterday) * weight + EMAyesterday
EMAtoday = (123.718 – 121.763) * 0.1818 + 121.763
EMAtoday = 122.118
Let's check this directly on the chart.
Rice. 5. The desired EMA.
The calculations turned out to be correct.
EMA+ADX+MACD strategy
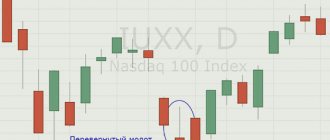
This trading system works with any currency pairs, but with the H1 time frame. First, EMA 21, EMA 7, MACD 12, 26, 9, ADX 14 are set. The example shows when you can enter the market with the euro/dollar currency pair.
Entry rules:
- The faster EMA 7 crosses the EMA 21 line.
- ADX 14 is directed upward, located above level 25.
- The MACD indicator crosses the zero mark.
The image shows entry points that are carried out in accordance with all the rules. The deal is closed at the moment the price crosses the EMA in a different direction.
Download the EMA indicator for free
In most trading terminals, EMA is among the installed tools by default and there is NO NEED to install it (it is definitely present in MetaTrader 4/5). If other platforms do not have it, then downloading an exponential moving average on the Internet will not be difficult. You can find them either separately or as part of trading strategies.
The exponential moving average EMA is an effective and informative trading tool that is best used in combination with other indicators to be able to cut out false signals.
Concept of MA
A moving average is a chart built using averaged data for a certain period. Used in statistical, technical, economic calculations. The indicator helps to identify trend changes and smooth out the impact of random events on our perception. We use the method in a simplified form in everyday life subconsciously because it is logical and simple.
The way the actual quantities are mixed and divided affects the final result. Returning to the example, we may place greater emphasis on speed in a traffic jam because it is characteristic of the area, or vice versa. Perhaps the avenue is located at the exit of the city, and during the summer season the traffic becomes denser. Then, when planning our trips, we attach more importance to the time spent yesterday than a week ago.
It’s the same on the stock exchange: varieties of moving averages allow you to make forecasts taking into account various factors. The trader determines their relevance independently, based on real market conditions.