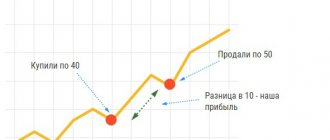
Pin bars 2.0 – Forex trading strategy
What is a pin bar?
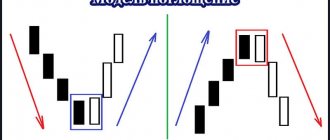
Pin bar is one of the main price action models. Its name comes from the name of the famous character Pinocchio from the fairy tale by Carlo Collodi.
Let's imagine we have a graph. The trend is upward and the price is rising. Then a candle with a small body appears. And at the same time it has a small shadow on one side and a huge shadow on the other:
This is nothing more than a pin bar.
A pin bar is a reversal pattern that suggests a price reversal. This is a candle that has a small body, a long tail on one side and a small one on the other.
Moreover, the body of the setup must be within the range of the previous candle, that is, from the High point to the Low point of the previous candle.
If its body were not in the range of the previous candle (as in the example shown below), then we would not call it a pin bar, since it does not meet the characteristics of the pattern:
How can we explain the appearance of this figure on the chart?
We watched the price move upward. Then there was a strong reversal on the candle that later became the pin bar. People bought for a very long time, and then, due to various factors, the price went in the opposite direction.
What will happen to the positions of the players who placed buy orders? They will lose their money because their stop losses will be triggered. And that was precisely the purpose of this reversal. Collecting stop losses of those who were in purchases.
Since this movement was sharp, many more sell orders were activated, which were probably placed by other traders expecting a similar situation.
And all this led to the fact that the candle had a long tail and a small body on the chart.
Now buyers whose stops were triggered will begin to enter sales, and those whose pending orders were triggered will not rush to exit them, because they are already a little in profit.
Thus, we can observe a change in market sentiment, as well as a pattern called a pin bar .
This is a reversal pattern, so we expect a downward movement in the future. Namely, bearish candles:
In order to take this pattern, we need the pin bar to have a fulcrum. This should be an additional factor that gives us the right to assume that a downward movement will occur next. We need a reference level, a support or resistance level from which the pin bar is repelled:
If there is no support point, then we will not use this pattern to open trades.
How to make it easier to find patterns on a chart
The Pin bars indicator automates the search for these patterns. There are a lot of such algorithms, the code is quite simple, you just need to set the relationships between the individual elements of the candle. Here is an example of several free tools of this type:
- Pin Bar Dashboard – marks corresponding candles on the chart with emoticons. The “footer” displays an information table with the results of searching for patterns based on the pairs and timeframes specified in the settings. Convenient if you work with several currency pairs at once;
The buttons in the last column of the table are clickable; by clicking on the button, the trader goes to the chart of the corresponding currency pair
- Pin bar detector – there is no information table, but there are flexible settings for searching for a reversal pattern. This Pin Bar indicator only works with one type of pattern;
Reversal candles are marked with markers
- OGT Price Action – works with several types of candlestick patterns. Pin bars are marked with numbers, each number shows how many candles before the current one the High or Low pattern was not reached. The remaining markers are responsible for other patterns.
This is how the custom OGT Price Action indicator works
There are many more Pin Bar indicators; in one market in MT4 there are dozens of paid and free algorithms. They can be used on Forex and other markets.
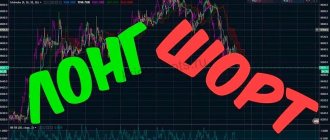
How to enter the market using a Pin Bar?
Entry with pending orders below the short shadow
A standard pin bar entry is made by placing a pending order below the short shadow of the candle:
If the pin bar looms in the opposite direction after the downward movement, then place a pending buy stop order above the short shadow of the candle:
This classic method is based on the fact that if the price does not want to reverse, but continues its active movement along the previous trend, then our pending order will not be activated, and we will be able to delete it.
Second method: “Wait for a rollback at 50% of the candle”
In order to use the second method, we need to place a pending order approximately in the middle:
This is called a limit order. In this case, sell limit.
The advantage of this entry is that we will receive more profit, since we will be able to enter at a more favorable price for us.
The downside is that the market doesn’t owe anyone anything, so the price is not obliged to roll back to the middle of the setup. And if the order is not activated, then we will not earn anything at all.
Third method: “Enter with a pending order near the level”
Let me clarify right away that I use this exact method in my trading.
Place a pending order just below the level:
Please note that the level may not necessarily be at the very edge of the candle. It can be located anywhere and anywhere:
A pending order is placed directly below the level.
Similarities with candlestick patterns
A pin bar in trading can resemble some candlestick patterns - Shooting Star and Hammer. However, unlike them, the pin bar places key importance on the multiple difference between the body size and the shadow. This is the key point that defines the very essence. The movement turns out to be much sharper, we return to where we started. Also, the main advantage of the pin bar is that it does not lose its relevance when switching to short periods. This means that it can also be used in intraday scalping, but candlestick analysis cannot be used in this way, there from four-hour and above, and H4 does not show very high efficiency.
A bit like a pin bar, the “Hammer” pattern
It is also worth noting that a pin bar is often part of candles that form the Tweezers pattern. And it is found in both versions of tweezers - both in adjacent candles and in those separated by a time interval. In this case, the model turns out to be even stronger, and the signal is more reliable, since a repeated sharp reversal indicates great interest near the level. It turns out that entering using a pin bar can be an excellent start for holding a position later using a new model. And this, by the way, is a common case for other models. In general, of course, you shouldn’t focus on this particular situation, but those who use a fractional working lot and leave part of the position at breakeven and for the long term often make a good profit after the development of the trend, which began with a small pin bar.
Which of these methods is better?
There is no clear answer which login method is better. It all depends on the situation. I’ll add on my own that if I’m not sure about the pin bar, then I place a pending order just below the shadow. If there is a noticeable level, then I try to place a pending order next to it.
I don’t use a 50% rollback in my trading because I focus on the level.
Sometimes a pending order near the level coincides with the 50% level of the candle. But this is an optional factor.
In order not to confuse yourself too much, I recommend using the classic login method. Namely, place a pending order just below the short shadow of the pin bar. For beginners, this will be quite enough at first.
Trading is a psychological activity
You want to change your quality of life for the better. We earned money and set aside some money for it. But we are not psychologically ready to lose it - we are only ready to increase it, and as quickly as possible.
The situation is that you have built up certain expectations of easy and quick earnings in a short period of time. And then a series of unprofitable trades begins - it’s just mentally devastating. Expectations in trading are a destructive thing. The pain from this event will inevitably leave a mark.
I destroyed a lot of such deposits. The problem of emotional control remained unsolved. I have already started to blame non-working pin bars, having started trading other patterns at the same time. But the situation repeated itself.
Stop loss
In any transaction, do not forget about Stop loss, limiting possible losses.
Let's say we placed a pending order slightly below the short shadow of the candle:
It activated and we entered the trade, but we need a stop loss. For what? Because the price can reverse at any time without any particular reason.
Even the most beautiful setups will sometimes result in stop losses.
The classic method of setting stop losses on a pin bar states that the stop loss should be set just above the long tail of the candle.
That is, like this:
I believe that it is better to place a stop loss per level.
Like this:
Why is it better this way? Because the stop loss placed behind the level is more logically justified. It has greater power and at the same time reduces the number of points you risk.
In certain cases, you can enter a pin bar trade with a very small stop loss. But on condition that the entry into the market will be made near the level, and the stop loss will be set just above the entry, behind the level.
Such transactions are more profitable, more enjoyable, and generally only benefit your trading account.
That's why I try to set my stop loss as low as possible on every trade.
Other tailed bars
There are other patterns of tailed bars; let’s look at the most common ones.
Below is a combination of pin bar and inside bar patterns. A combination of the Fakey pattern (false breakout) and a pin bar is also common.
Below we can see a real example of a bearish pin bar inside an inside bar combination pattern. This resulted in a significant decrease, as expected. Also, note the bearish tail bar that followed - another good sell signal in this downtrend.
Here is a real example of a pin bar combination with an inside pin bar:
Take profit
In addition to entering a trade, we also need to be able to exit it.
The easiest way to exit is to exit at the next resistance support level. This is the level that is in the direction of price movement. In order not to sit in front of the monitor for hours, waiting for the moment when the price reaches the expected target, it is enough to set Take Profit in the right place:
If it is not possible to find the level on the chart, then you can multiply the stop loss by 2 or 3 and thus obtain the take profit size.
Let's say that your stop loss is 20 points. Multiply by 3 and get 60 points:
Also, I would advise you to take the trade to breakeven after two stop losses. If you have a stop loss of 20 points and the price has passed 40 points, then you need to move the stop loss to the opening price of the transaction. Thus, you insure yourself against a possible price reversal.
And another possible way to set take profit is to measure the length of the pin bar. The take profit size is equal to the size of the pin bar candle.
Acquaintance
It so happened that when getting acquainted with the financial markets, the question arose in front of me - which price action pattern should I choose?
It should be clearly visible and easily identified on the chart. The totality of the structure should not be complex, but absolutely understandable when used. It must be versatile and work in different markets.
After analyzing all the existing patterns in the form of Japanese candles, my choice fell on a candle with a long shadow and a small body. Using historical and theoretical long-term data, I noticed a pattern of development and a good powerful movement after the appearance of such a candle. This inspired me. I downloaded and printed out a mini guide to pinbars. I topped up the deposit with a small amount and was already preparing to buy a new car. How wrong I was...
What should you pay attention to when trading pin bars?
First of all, it is best to enter with the trend.
In fact, the best option would be to enter the market only following the trend:
Why?
Because trading with the trend significantly increases the profitability of transactions. I think you have to agree with this.
Since we have discussed trend trading more than once, I think you should not have any difficulties with this issue.
If you really want to take a pin bar against the trend, then it should be very “beautiful”. It should have a small body in the range of the previous candle and a long, prominent tail. You need to clearly and without doubt see that this is a pin bar.
In general, we have a separate article , where we examined various nuances. I recommend checking it out .
In general, I would not recommend taking counter-trend pin bars because it is an unnecessary risk. Try to always follow the trend.
As I said earlier, we are always looking for level support.
And if the tail of the pin bar forms a false breakout, then this is a good sign for us:
Why is this a good sign?
After the breakout, the price collected stop losses and pending orders that were at this level. This gives the setup strength. Therefore, if there is a false breakout of the level that forms the tail of the pin bar, this is an additional reinforcing factor.
There is an opinion that a bullish pin bar must have a bullish body, and a bearish pin bar must have a bearish body.
I have not seen statistics that support this statement. In practice there is not much difference. It doesn't matter what body the pin bar has.
If the pin bar is bearish, as in the screenshot above, and its body is bullish, then this is normal and you should not be afraid of it.
Do not forget that there are random fluctuations in the market and if the body is small, then the price can roll back by 10-15 points and the body will become bullish.
This is not a factor that needs to be thought about.
There is another point about which there is a lot of debate and discussion on the Internet.
Should a pin bar stand out on the chart?
In my opinion, this is not a necessary condition and it is quite possible to enter using the pin bar if it does not stand out too much.
For example, in this area there is a pin bar that does not stand out, but as we see later, it works:
The only thing I would like to note is that patterns that stand out well on the chart usually work out better.
Therefore, if you want to take only the strongest signals, then you should pay attention to bright setups that are visible on the chart with the naked eye. But this is not some 100% criterion. All the same, it is impossible to predict which of them will be more profitable until the chart begins to move forward.
There must be some kind of movement before the pin bar. There shouldn't be a flat. If a signal is preceded by a flat, then taking it is dangerous.
This nuance is demonstrated very well by the chart of USDJPY, which has been in a flat for several months:
During all this time, there were many pin bars in all directions. But they did not bring any effect.
Then there was a move down, a pin bar appeared and then a sharp jump up.
From here we conclude that this setup must always be preceded by some noticeable movement.
Remember this and try not to take unnecessary risks.
Summarize
The pin bar is one of the very famous and quite noticeable candlestick patterns on the chart. It is formed due to the behavior of market participants and indicates a price reversal. Patterns formed near strong levels, especially those that are false breakouts of strong support or resistance, provide excellent signals for entering positions.
If you intend to use this pattern in your trading, consider the following points:
- Identify the pattern correctly. It must meet all the criteria described above.
- Trade the pin bar with the trend or rely on technical levels.
- A pin bar signal can be used as a complement to your strategy based on technical analysis or computer indicators.
- Take screenshots of signals with a pin bar if you use this pattern in your strategy. The screenshots will become the basis of your algorithm, which you will upload into the “Algorithm Designer”, and will help you quickly navigate the market, just like the trading algorithm itself.
- Reduce the influence of emotions and work with a cool head.
Find out how to correctly register your trading algorithm here.
In the following articles we will talk about other popular and not so popular figures of graphical analysis, which can also be used in your strategies and which are important when drawing up an algorithm. Indeed, in their analysis, not everything is so clear.
Trading examples
Let's look at some examples of pin bar trading.
For the first example, let’s use the previous situation and consider how the pin bar that was preceded by the flat worked:
Let me remind you once again that before this we had a flat movement. After it there can be a breakout in any direction, so here it was possible to take this pin bar, although it was against the trend.
Why? Because there is a noticeable movement, then there is a breakdown of the level and support on the round level.
The body of the pin bar was below the level, so entry was made by placing a pending order to buy just above the top point of the pin bar:
Since the level is located there, confirmation is required that the price is fixed to it.
I would recommend setting the stop loss just below the low point of the previous candle:
If we put a stop loss behind a long tail, then it would turn out to be very large, and this is not in our interests.
I would set take profit at the border of the previous flat. Because we don’t know whether the upward movement will continue or whether the price will again begin to move zigzag in this corridor.
Thus, the take profit for this trade would be 127 points, and the stop loss 68 points.
I would like to immediately note that this was an example of a complex situation that does not appear on the chart every day.
Let's move on to the next example, but let's take a simpler situation for it.
We see a long flat, where there is no clear trend. Recent moves indicate bullish sentiment, followed by a pin bar and then another next to it.
What would we do here?
Since the upper limit of the pin bar is not far from the level, it is logical to place a pending order just above the high pin bar point:
Note that it does not stand out much on the chart, but it is not a critical entry factor.
The stop loss could be placed behind the tail using the classic method, and then moved closer to the tail of the new pin bar:
So we would reduce the risk a little on this trade.
The most logical thing would be to exit purchases at the round level 101, which could very well turn out to be an obstacle:
Let's look at another example of a trend pin bar:
We see that it is based on a weak level. In this case, I would enter near him:
The stop loss would be set just below the low point of our pin bar:
It is not far from the level, so here everything would happen according to the classic method of setting a stop loss.
After the next candle formed, you could move your stop loss just below its low.
This would reduce its value, and, consequently, our costs:
Would I exit the deal after the gap:
We know that gaps are heading towards closure. Therefore, I would not take unnecessary risks.
Even if we had exited at the gap, the stop loss would have been 60 points and the take profit 490 points.
Quite a good deal.
Another trending pin bar on the daily chart for everyone’s favorite EURUSD pair.
This figure has support, the level is not far from the pin bar.
But it is worth considering that the pin bar rests on the level only with its tail, so in this case we place it behind the tail of the candle:
The trade's stop loss would be approximately 54 pips.
Since the pin bar is not very clearly highlighted on the chart, the entry would only be above the high point:
I would put the take profit at the top point at this place:
Despite the fact that the stop loss was large, the take profit allowed us to exit the trade with a profit.
Conclusion
In this article, you learned what a Pin Bar is - a candlestick pattern, the appearance of which at significant price levels in most cases gives true signals of subsequent price movement.
In addition, it is quite simple to recognize and interpret, since it stands out on the chart from other candles that precede its formation, both in shape and location.
Professionally studying Pin Bar formations in the Forex market will help you make profitable trades when they appear.
⇐ “Wedge” pattern in the Forex market “Inside Bar” pattern in the Forex market ⇒
What does pin bar mean?
In the case discussed above, it is clear that some events in the market led to the growth of the asset. As a result, an up trend was observed, since there were many people willing to buy. But at some point, either the situation changed, or the price became too high, but there were no people willing to buy, and the price succumbed to the pressure of the bears, starting to fall.
The last decisive battle took place within the pin bar, when buyers continued to push the price up for some period, but were unable to close it high. At the same time, the bears easily sold everyone who was still trying to buy and by the time the candle ended, they returned the price to its original position, which formed a small, almost imperceptible body and a high upper shadow, thereby showing the activity of buyers and their inability to control the price anymore.
The appearance of such a pattern after the observed growth indicates that the strength of buyers has dried up, so it will be easier for the market to turn around and go down than to continue moving. Therefore, more and more people want to fix their buy positions and enter the market to sell. Taken together, this does not leave the price a chance and it begins to fall, as a result of which a correction from growth or even a change in trend develops in the market.
But in trading you can almost never use only one method, approach, indicator or anything else for analysis. You should always look for an additional confirming factor that will show that the appearance of a pin bar is not a random phenomenon. Ideally, this reversal pattern should appear near strong support and resistance levels.
Below it is shown that there is some level of resistance on the chart and when approaching it, a Forex reversal pin bar is formed, piercing it with its tail.
In the case where there are no such confirming factors, it is better to skip the pin bar formation signal.
Stage: Awareness
Sooner or later you will come to the point that you will find all the answers to your questions within yourself.
Systems will suddenly begin to work, an understanding of price movements will come, and intuition will develop. It will be a new fresh way of looking at things. In this regard, trading is an absolutely unique thing - it allows a person to develop as an individual, improve in various areas and discover new levels of knowledge through a series of defeats and victories.
We will discuss how to stabilize the psychological background and find harmony in trading another time, since this is a separate topic.
Pattern 1-2-3
The 1-2-3 pattern is a reversal formation and is quite often found on charts at the end of the main trend movement. During a bearish model, this model consists of a directional price movement ending with a peak, followed by a short-term decline, the formation of a minimum, again a short-term increase, a peak, but lower than the previous one, and a transition to a decline.
In a bullish pattern, the pattern is formed after a downward movement that ends with two lows, the second of which is higher than the previous one, after which the price begins to rise. In addition to trends, the 1-2-3 pattern is also found in flats.
A bearish pattern forming in an uptrend is called the “1-2-3 High Pattern” and indicates a transition from a rising market to a downward trend.
Similarly, a bullish pattern forming in a downtrend is called the “1-2-3 Low Pattern”, and is a signal of a reversal of the downtrend and the market transition to growth. Both pattern formations can be used to determine the end level of the correction.
That is, you can use it as a signal to enter the market in the direction of the dominant trend.
So, on the chart, the 1-2-3 pattern is formed by two impulses and a pullback, which are, in fact, two market waves that create three base points for constructing this pattern. Moreover, the more candles there are between the points, the greater the movement will follow after the formation of the figure is completed.
You can notice that a 1-2-3 pattern begins to form in the market when, after a strong directional movement, a countertrend movement forms in the market, creating point 1 and point 2 of the model on the chart. This impulse is the first element of the pattern. At point 2, a rollback towards the trend movement begins to form.
However, the impulse for this movement is not enough, and the price does not reach the previous extremum, and, having formed point 3 on the chart, proceeds to form a trend in the opposite direction.
How to trade when the 1-2-3 pattern appears
1. Wait until the figure is formed. All points 1,2 and 3 must be formed. 2. It is important that after the third point the price breaks through the level of point 2 on the chart. 3. If we are dealing with a 1-2-3 low pattern, place a pending order buy stop slightly above the level of breaking point 2. Stop loss at In this case, we set point 1 beyond the level, and after the price moves a little towards the open transaction, you can move the stop loss beyond point 2.
4. When trading the 1-2-3 high pattern, place a sell stop order slightly below the level of the second point, and move the stop loss above point 1. After the price moves some distance down after opening a trade, the stop loss can be moved above point 2.
5. The minimum potential for price movement after the 1-2-3 pattern is measured by the distance from point 1 to point 2, and by deferring this value from point 3 towards the movement that began after it. 6. If you have an aggressive trading style, you can open a deal after point 3, without waiting for the level of point 2 to be broken. However, this is risky, since after point 3 the price may go flat.
In this case, you need to enter the market after breaking through the trend line drawn through points 2 and 3. In this case, when the price approaches the level of point 2, you can either close the deal and fix the profit, or wait for further price movement in this direction. You can also partially fix the transaction, and move the stop loss for the remaining volume of the position to breakeven and wait for an increase in profit.
It is worth noting that the 1-2-3 pattern can be found on the market in combination with other technical analysis patterns. For example, in combination with the Three Indians pattern, it can form a head and shoulders reversal pattern.
In this case, the signals of the 1-2-3 pattern and the “head and shoulders” are superimposed, which strengthens the signal in the general direction. In this case, you can prepare to enter a trade from point 3 of the 1-2-3 pattern, anticipating the formation of the third shoulder, and without waiting for the neck level to be broken. In overbought and oversold zones, the 1-2-3 pharmacy is a stronger signal of the start of a correction.
Dependence of the pattern signal on the time frame
The strength of the signal and the duration of the trend emerging after it also depend on the time frame. The higher the timeframe the figure is formed, the stronger the signal.
For example, the formation of a pattern on the daily timeframe indicates the emergence of a directional movement that will last from two to eight weeks. If it is formed on a weekly basis, then the new trend can last from four to sixteen weeks.
The formation of a pattern on the monthly chart can be the beginning of a directional movement for a period of two to twelve months. If you notice this figure on lower timeframes, you can use its signal for intraday trading.
Key reversal bars
A key reversal bar forms after a long trend or market reaction and represents extreme exhaustion among market leaders.
When a really strong key reversal bar appears in the market, the trend by that time often accelerates greatly, often vertically, in a parabola.
Main characteristics of a reversal bar
A classic key reversal bar looks like this:
- The price opens confidently in the direction of the main trend. Ideally, if this happens at all with hep.
- The trading range is very long compared to previous bars.
- The price closes near or below the previous close (or near/above if it is a downward trend)
- The volume, if present, should jump.
In Fig. 15-1…
Rice. 15-1. Key reversal bar, market top
...and 15-2 shows two examples of key reversals that occur at the top and bottom of the market.
Rice. 15-2. Key reversal bar, market bottom
The Psychology Behind Reversal Bars
A strong price movement when the market opens indicates the urgency with which the powers at the helm are assessing the current market situation. At the top of the market, buyers reach new highs in their greed, and at the bottom, sellers plunge into the depths of panic. An opening gap is often associated with unexpectedly good news at the top of the market or very bad news at the bottom. Exactly how the market reacts to changes in the underlying trend is critical to understanding the short-term technical picture of what is happening.
Here's an example: If a company announced higher-than-expected earnings, it could cause a gap at the opening of the trading session. However, if at the end of the day the price returned to a level that was close to or lower than the previous close, then this news, in general, did not seem particularly positive to the market. Since the key reversal day (with daily timeframes) follows a strong uptrend, only weak, poorly informed traders remain among the buyers, and investors in general react to the “good” news.
There is also a stage when many short sellers who are shorting the market give up. Many of them jump out of the stock in panic and all this happens at the beginning of the formation of the day bar. Ultimately, if even such good news does not push the price higher, who can handle it?
At the bottom of the market, a gap on the down open causes panic liquidation of weak long positions, while shorts are confident and open new trades. The downward fall becomes decisive and the only question left in the market is how far prices will fall and where they will then go from there. When the price returns to a level near the previous close, carefree shorts are locked in at lower prices.
And since everyone who wanted to has already left the longs, prices refuse to fall further and short sellers have to cover their positions (shorting a stock - a share is borrowed and bought back (covered) at a lower price, Binguru’s note). This is not a sour surprise for them, because there was bad news, there was even a gap associated with it, and all this did not push the price lower. If even such bad news cannot cause further closing of positions, then what?
The size of the key reversal bar is very important here, since it directly indicates volatility. She is the Queen of Volatility - often a harbinger of a reversal in the entire market. When price opens confidently in the direction of a key trend, a wide trading range can be expected. If the price closes near the level where it opened, then a lot of people are locked in unprofitable positions. And the larger the volume, the more such people are in distress.
This also means that buyers tried to push the trend higher, but their luck was temporary. And they tried very, very hard, but... they failed because at the end of the day bar the price was almost unchanged from the previous market closing price. The situation would be exactly the opposite for sellers in a downtrend.
Because key reversals form after a rapid, almost vertical trend or market reaction, they symbolize much stronger emotions than the usual 1- or 2-bar reversal patterns. It is for this reason that their effect is much more significant; it often lasts much longer than the standard 5-10 day bars.
Key reversal bars often anticipate a strong trend reversal. However, it will gradually become clear that after the formation of several subsequent bars, a rollback is likely to occur.
An example is shown in 15-3.
Rice. 15-3. Key reversal bar indicates pullback
And this rollback is nothing more than a test. If it fails, then the market mood has changed and this is serious. The pullback also gives sellers another chance to successfully exit trades and buyers a second chance to enter them at the bottom.
As a rule, the maximum level of a key reversal bar is not exceeded. But if this happens, the pattern is cancelled. Since this is an important emotional zone on the chart, it also acts as a potential support and resistance zone, making it an excellent place to place a stop loss. If this is the top of the market, the stop can be placed slightly above the reversal bar, if the bottom is slightly lower.
Key reversal bars: market examples
On the left, Chart 15-1 shows a classic example of a key reversal for Barrick Gold stock.
Schedule 15-1. Barrick Gold shares, 1999-2000, daily timeframe
Notice how the short-term trend ended with a literal burst of volume and a long, key reversal bar. The opening price is almost at the maximum. Often a key reversal is accompanied by a strong trend change followed by a pullback. Which is what happened in this case, and the price went into a rollback on the 4th and 5th trading sessions after the key reversal. Then an outside bar appeared and the short pullback ended.
As a rule, such 1-bar patterns play only a short-term role, but often they act as the first domino from which a global trend reversal begins. It all depends on how mature such a trend is, as well as what long-term indicators show. In this case, the key reversal marked the top of a new trend that lasted more than 6 months.
The second example of a key reversal, shown on the right, is also good, because it is accompanied by increased volumes, and the bar itself is quite long. However, no super trend followed. Therefore, bullish expectations were not as strong as in September. This pattern, in general, does not gain many effectiveness points compared to the first one.
Chart 15-2 shows the market bottom for Merrill Lynch stock.
Schedule 15-2. Merrill Lynch shares, 1998, daily TF
A classic key reversal bar formed at the very minimum; volumes also contributed, jumping sharply at the very bottom. Here you can even draw a small downward trend line. When it was broken, it confirmed the signal that the reversal bar had issued.
At the same time, one bar was absolutely not enough to understand that we were facing the very bearish bottom of the market. All he indicated was that there might be a good trend ahead. At the same time, extremely strong volumes suggested that such a reversal would be longer than the standard 5-10 days.
On the other hand, if we found out that the entire market (“the entire market” refers to a stock index like the S&P 500, Binguru’s note) bottomed on the same day, then both the characteristics of the pattern and the accompanying volumes are quite could point to the bottom for this particular stock as well. Of course, if you look closely, this bar also closely resembles an outside bar rather than a key reversal bar, as the price closed significantly higher than the previous low.
However, this is a purely rhetorical question. All that is important to us is to determine a specific technical situation, which reflects a change in the psychology of market participants. And what it’s called is not at all important. The important thing is that the bar worked technically.
Chart 15-3 shows how a key reversal bar formed on the NYSE Composite chart in July 2002.
Schedule 15-3. NYSE Composite Index, 2002, daily timeframe
The opening price was at the same level as the previous closing price, however, the original problem is not visible on the chart. This is because the opening price did not include shares with problematic orders. Because the market opened weakly, a number of stocks had a delayed opening, resulting in the NYSE's "opening" price only including stocks that had traded since 9:30 a.m. The resulting bar was very long compared to all other bars on the chart, and before it the market fell steadily and for a long time.
Here you can immediately see the potential for a reversal in bearish psychology. The key to understanding was the record volume during this trading session - such volumes just don’t happen, and certainly don’t happen every day. When such volume forms after a long bearish trend, this is usually an indication of new market growth.
Then in October, the market formed a small lower low, however, the July low was much more significant before that, because it marked the 52nd week of the market decline, and accordingly, it was much more significant.