The topic of our conversation today will be of interest to fans of candlestick analysis and trading using the Price Action method. We will talk about the internal bar (otherwise - Inside Bar or, if you prefer, IB). We will study the anatomy of this pattern, its position on the chart, and its semantic meaning. We will learn how to trade using the IB method.
Under the guise of the “inside bar” model there is an ordinary Japanese candlestick, which at its “High” and “Low” points does not jump out beyond the internal range of the same points of the candle preceding it. Such a candle is called a “defining” or “mother candle” . On the price chart there are:
- Single IB.
- Groups of inside bars following sequentially, where each previous inside bar becomes decisive for the next one.
- Groups of bars, where each, relative to the first defining bar, is internal.
Example of a group of bars.
What needs to happen in the market for an inside bar to form? What trading situations contribute to the birth of this Price Action pattern on the chart? These include events leading to the following factors:
- uncertainty of price movement (usually a powerful impulse is recorded on the chart before this event);
- price consolidation.
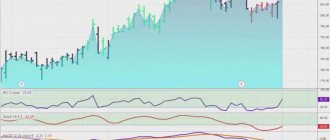
On the chart itself, on its small and medium time frames, you can see a clearly formed price corridor, a “shelf”, but more often – a “Forex triangle”. If, during the price movement, the mother candle breaks the level, the pattern suggests that the dominant trend is likely to continue.
The location of the pattern can be the “bottom” or “tops” of the market, side channels and resistance/support levels. The presence of inside bar candles on the chart curve, in one case, is associated with the likelihood of successfully entering the market with the least risk. In another situation, the inside bar suggests the presence of a logical zone that recommends closing the deal.
How do IBs work?
It is more rational to use the inside bar when the trend is in force. When a true breakout is fixed, the stop loss should be set no higher than the middle third of the outer or mother candle. You can also place a stop loss under/above the defining bar itself.
The pattern has proven itself well on the daily chart trend . It can be used to search for market redirection zones. Not often, of course, but Inside Bar can show entries for trading against the trend. Most often, the appearance of an inside bar is associated with a natural stop of the market, its “bell” to rest, with the subsequent resumption of a strong trend.
Example of bars on a chart.
How to set stop loss correctly?
In any transaction, we always set a stop loss. This is necessary in order to secure your trading account and not incur large losses. There are several options for setting stop loss for this setup.
The first of them is classic. The stop loss is placed beyond the opposite edge of the mother candle:
This option is not very effective, since the mother candle can be very large, therefore, the stop may be too large, and if such an order is triggered, it will seriously harm your deposit.
The next option is to set a stop loss per level:
This option is already more reasonable, since crossing the level will mean that we were wrong. It should be used when it is adequate. That is, it does not carry risks in a huge number of points. If the level is not very far from the entrance, then this option can be used.
And the final option is to place a stop loss beyond the opposite edge of the innermost bar.
This is also an adequate trading option.
You might think that such a stop loss would be very easy to hit. Let this force us to make mistakes many times, but it will also allow us to periodically take profitable trades that will be several times larger than our original stop loss.
Thus, if we make a mistake, we will lose a minimum number of points.
Types of indoor bars
Among the variety of types of this pattern, we should highlight its classic form , when the mother candle holds it in its range. Moreover, its maximum/minimum values are limited by the maternal values. In turn, the inside bar with its range can become the mother bar for several more inside bars. The body of the mother candle or its shadow can be used as a range, but this is not important.
A situation is allowed when the mother candle and the inside bar candle are characterized by equal minimum values. Then the mother candle has a higher maximum value. If they have the same maximum values, then the mother candle will definitely have a larger minimum value. Inside Bar cannot have “High” and “Low” indicators like the mother bar - this is its distinctive feature.
The anatomy of IB is simple and easy to read on the graph. For example, if we consider the model of a spiral inner bar , then in its principle it resembles a “Russian nesting doll”. Here, each new inside bar is included in the range of the bar in front of it. The length of this spiral measures the possible force of its breakdown.
Spiral inner bar.
Tip: Since IB can be considered as a breakout setup, it can be traded on the breakout of the mother candle in both directions. Eg:
- If you entered via Buy, then set the Stop a little higher than the mother candle.
- If the entry is made via Sell, then it is better to place a Stop slightly below the mother candle.
The chart sometimes shows the possibility of an earlier entry (when the mother candle has not yet been broken), which is inherent in a strong trend. For beginners, such an entry is not relevant, since it requires a good trading strategy. The inside bar sends a signal that requires serious verification and confirmation. If you do not have sufficient trading experience, do not open a position without confirmation.
The Forex Academy employs trading professionals. They are familiar with all the intricacies of the trading game. Do you want to chat with them for free and get good advice? You can sign up for an individual lesson with a trader-teacher using the link below:
Sign up for a free test lesson with a Forex Academy trader here.
To contact you and agree on the details of an individual online consultation, we only need your contact information.
Inside Breakout with Narrow Range (ID NR4)
We will now turn our attention to another variation of the inside day bar trading pattern. This is an inside daily bar combined with a narrow range of the last 4 days (NR4). This pattern was originally popularized by Toby Krabel in his book entitled: Day Trading with Short-Term Price Patterns and Opening Range Breakout. This book is a true classic and typically sells for $300 to $400 on Amazon. Crabel is the founder of Crabel Capital Management, LLC, and currently has more than $1 billion in assets under management.
In order to confirm the last 4 days Inside Day Bar/Narrow Range pattern (ID NR4), you will need to have an Inside Day Candle that is also the narrowest Range Candle for the last 4 days.
Although it may seem a little confusing at first, it is quite simple and just takes a little time to figure it out.
This NR4 trading pattern ID is a very fruitful and reliable setup that can be taken advantage of by astute traders. The power of this formation is hidden in the consolidation nature of the formation. Since the inside day candle is the smallest of the last four daily sessions, this means the range is relatively tight and is likely to flare up with a sharp reaction.
The entry points of the trading characteristics of this model completely coincide with the typical inside bar technique. Let's look at the inside daily bar/narrow range of the last 4 days (ID NR4) on the price chart:
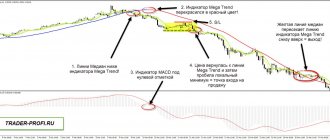
Now we look at the GBP/USD daily chart. The image shows an inside day bar with a narrow range pattern ID NR4.
The blue circle in the image indicates the inside daily candle. Also take note of those three blue arrows on the left side of the image, which show that the previous three candles on the chart are actually larger than the inside candle. Thus, we confirm that the inside candle is also the narrowest daily range of the last 4 daily sessions.
We mark the high and low of the morning candle, as in the two previous examples (black lines). A conservative trader will identify a breakout of ID nr4 when the closing price of the candle is below the bottom of part of the pattern. An aggressive trader will identify a breakout of ID nr4 when the price moves just a few pips below the bottom of the pattern. In each case, this will mean that the consolidation range is ending in favor of a downward price movement. The trader can prepare to enter a short position and place a stop loss above the high of the pattern, as shown in the image.
As you can see, after a short signal the price creates a strong decrease.
Inside Bar Trading Methods
The simplest, most effective and easy-to-learn IB trading method is considered to be “breakout entry” during the day trading session. Below you can see an informative example of a daily chart where the inside bar takes different shapes.
An example of different shapes of an inside bar.
Advice: keep in mind that trading IB is easier on larger timeframes. There are too many of them in the middle and junior periods, which brings a lot of inconvenience. The most rational option is an inside bar containing 2 candles. Use it wisely in periods below the 4-hour time frame, where false breakouts are missed and stops are hit. Beginners are advised to trade with IB only on the daily chart.
Typically, an inside bar on a chart raises a lot of questions among some traders. If you practice candlestick technical analysis, then to enter the market profitably you should already have your own proven strategy. The inside bar is sometimes part of a trading strategy or is considered separately on the chart.
You can use the trading strategy that the Forex Academy will provide you for free. We will not only give you the “key” to profit, but also teach you how to use it correctly.
Get a complete special course on the Sniper trading system here.
“Sniper” is a system that can be easily mastered by a novice trader. Trading without indicators with Sniper will bring you a solid (over 50% of the deposit) profit.
How to increase profits
To get stable profits, use trading systems with entry confirmation. There are a number of requirements that optimize the accuracy of using the pattern:
- Trading according to market movements . When correcting against the trend at the level, the Price Action signal turns the market around well. You should trade against the trend only when you receive an accurate reversal signal.
- Use different time frames. In this case, there is a higher probability of receiving the exact command to open an order. Some experienced traders, when using scalping systems, make profits on small time intervals, but the risks increase.
- Accurately identify and use support and resistance.
- Selection of optimal risk management and risk-to-reward ratio. The basis for choosing trading rules is always the trader’s statistics. Conduct a thorough analysis and determine your own algorithm.
Inside bars on a flat
How does IB behave on the flat? Like the sea after a storm, the market is resting after a strong trend. If the sea is calm, then the calm in the market is often characterized by a flat (or sideways movement). A flat usually ends with a breakout, so the Inside Bar strategy is ideal for finding areas of consolidation. This process itself can last more than one day before inside bars begin to form.
Consolidation and breakout.
Rails reversal setup in trading
This pattern configuration uses two candles of different colors (white and black). A graphical reversal formation indicates a change in the direction of the exchange movement.
As a rule, model candle rails are long. They have short shadows or no shadows at all . Often a setup is formed when large players have left the market. Then a change in movement begins, which can lead to the opposite trend, or may end in a flat . Therefore, this setup must be used with caution. If the impulse of the second candle was weak, then you can get stuck in the quagmire of an uncertain market.
If the exchange outlines this setup, then go to a higher time frame - it will be easy to find a pin bar there.
More about the spiral setup
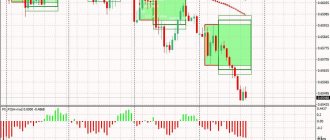
This Inside Bar model consists of two or more candles. Each subsequent candle in it is smaller than the one in front, which is maternal for it. The candles are stacked like a “matryoshka” and each one does not go beyond the range of the one that lies to the left of it. As a clear example of this model, consider the following graph.
Spiral IB before breakout and trend continuation.
So, in the mother range there are 2 internal bars at once, where the second one will obey the range of the first one. This is a simple setup, it allows you to enter the market as soon as the breakdown of the mother candle is outlined. A spiral inside bar with a large body of the mother candle allows entry into the market if one of the inside (nested) mother candles is broken. This, however, requires considerable experience. Therefore, beginners are recommended to start with simple setups.
The main property of all spiral bars is that they signal a strong trend breakout . The inside bar is a unique reflection of the market situation during the period of price consolidation. First, the price contracts in a narrow corridor, then, like a spring, it rebounds. The market begins to move powerfully in one direction.
The meaning of the level in trading
Using support and resistance levels with a pin bar is considered the best way to make a profit in the market.
The fusion of these two strategies forms one formidable technique that, when used correctly, guarantees the trader excellent and accurate results . Both parameters are suitable for technical analysis when used on a Japanese candlestick chart. The combination of these two algorithms will give a clear picture regarding many aspects at once in time, price, and also reversal.
Level also to determine the output:
Let's consider a trading algorithm against dynamic resistance and support zones. For example, let's take the Moving Average indicator .
The problem with this approach is that the level is redrawn with the price changing at the moment.
IB at supply and demand
Today, the inside bar strategy for a market reversal has shown good results in trading based on supply and demand levels. The main function of the setup here is a signal about a likely trend reversal. Beginners to trading should not start looking for such signals. They should first study the inside bars that signal trend continuation.
It is imperative to get acquainted with the reversal setup, since it is this kind of inside bar that acts as an activator of a strong trend. He is even able to change its direction. The chart below shows an example of the influence of an inside bar lying above the support level.
Signal of a trend reversal.
We see that the price has already tested the level twice. On retesting, a clear bullish pinbar was drawn. Next came the process of consolidation, which ended with the construction of the classic “inside bar” model. This means that you can now open profitable positions with a Stop Loss below the mother candle. As you can see in the screenshot above, the inside bar at the support line became a signal of an upward trend reversal.
And here is another example, when the inside bar at the resistance level was broken by the price upward, but due to a powerful attack by the bears, the trend was thrown back. This false breakout can be seen in the chart below.
False breakout of resistance level.
If an inside bar appears on the daily chart, be prepared for false breakouts and various types of fakes. In themselves, they are also good signals of a reversal in the market.
False pin bar in trading
The difference between a real and a fake pattern is determined by the recent price action. If a long shadow emerges from recent prices, then the pattern is reliable. This movement led to the emergence of a new group of buyers (or sellers in the case of a bearish formation).
If the long shadow does not protrude from the previous group of candles, these are fake pin bars.
FAQ
Before you start trading IB on a large time frame, learn to “recognize” and understand it on small time frames. The hourly and four-hour timeframes too often show false breakouts on inside bars . A little training and you will be able to combine the inside bar on TF4 with the trend of the daily chart. We are often asked a variety of questions about IB, so we decided to answer several of the most pressing questions here at once.
- About the color of the mother's candle.
The color of the innermost bar, like the color of the mother candle, does not play any role when closing . It doesn't matter which direction they closed. If this is definitely an inside bar, and it is in harmony with the daily chart, the situation can be considered normal.
- Internal bars are modified into fake ones.
It is sometimes difficult to recognize where a fake is and where a setup is, just as it is difficult to predict how reliable, for example, your new strategy will be. A fake inside bar can be recognized, but this requires good practice.
- How to prevent IB from being modified into a fake?
Try not to trade the inside bar against the direction of the market! It works perfectly and reliably on daily charts. You can enter in the opposite direction to the trend when the support/resistance level has already been clearly worked out. Remember that the strategy for Inside Bar outside the daily chart is the prerogative of experienced traders; we recommend everyone else not to leave the daily chart.
Anatomy of a pin bar
The pattern represents one Japanese candlestick, so its structure is simple . The model consists of such elements as nose, tail and body . Each of them has its own characteristics that are taken into account when trading:
- For a reliable signal, the length of the shadow is a couple of times the size of the body.
- The size of the tail should exceed the dimensions of the shadows of nearby candles .
- itself is short in length.
- The nose is absent or excessively small.
The engulfing pattern of candlestick analysis easily transforms into a pin bar on a higher timeframe :
The pin bar is often . Their cardinal difference is the absence of a nose on the pin bar and approximately equal shadows on both sides of the top.
Several practical examples of IB work
Among all the existing methods of working with internal bars, I can highlight two main directions:
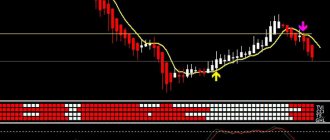
- In a strong trend, when the price rolls back to the average value, the inside bar gives a good signal about the continuation of the trend.
- When one of the support/resistance levels in a trending market is broken through, the inside bar signals the continuation of the main market direction.
Below on the chart you can see a strong downward trend and the formation of an inside bar. Here it looks perfect because:
- Formed in an obvious trend.
- It has a good structure.
- On the chart it lies next to the “talking” zone of the EMA 8 indicator.
Breakdown of the mother candle.
In the example below, let's look at an inside pinbar (a regular pinbar that the inside bar holds in its range). It lies below the resistance level, before the breakdown. The new trend is gaining momentum after crossing EMA 8 and the appearance of an inside bar. As you can see, the level was tested by the price several times; in the next price approach to it, the mother candle was broken. This signal tells us that the price is trending upward.
Internal bar.
Trading strategy for 50% retracement
It is a recognized fact among traders that most moves end up retracing half of the previous move.
When there is a price action signal on the MT4 chart, you need to stretch the Fibonacci lines onto the pin bar and determine the 50% zone. in this area , which is triggered the next time you touch . A buy transaction occurs during a pullback at the bottom, and an upward correction is required to sell.
The problem with this technique is that it rarely returns to the target reversal area. The advantage is that the profit of the transaction is doubled.
Let's sum it up
The inside bar is a good help for a trader. The main thing is that he learns to correctly interpret their appearance. I think it’s important to remind you that trading inside bars against the direction of the trend is possible, but only after you learn how to trade IB with the trend . An exception here may be trading at a strong resistance/support level. Stick to daily charts and small TFs; once you gain experience, you will be able to work on inside bars both on older periods and against the trend.
Why does a pattern appear in trading?
It’s not for nothing that Pin is called Pinocchio (pinoccio bar) . The similarity with the fairy-tale character is obvious: when the wooden man lied, his nose grew. A tail pin bar causes a false breakout of a strong level . This is often done to knock down pending orders (Sell stop, buy stop), as well as stop losses of other traders .
Inexperienced speculators who trade for a breakout are faced with a false breakout. The trend reverses with a trip to stop losses.
This pattern in trading occurs when large players deliberately inject large amounts of capital in a short period of time.
Don't Make This Mistake When Trading the Engulfing Pattern
Do not immediately enter into purchases if you see an engulfing pattern on the chart. The next moment the price may begin to move against you and you will find yourself at a loss. Because often a bullish engulfing pattern is usually often a correction to a downtrend.
Many traders often rush to go long or short when they see an engulfing pattern on their charts. They think the market will turn around immediately. However, it is not. The price may continue to move further, especially if it follows a trend.
A strong trend can continue in the market for weeks, months or even years. Will it end just because of the appearance of just one pattern?
If you look at the lower time frame, the engulfing pattern will most often be a price pullback within the current trend.
External bar on the daily timeframe:
On the lower timeframe we see a rollback against the trend:
The absorption pattern signals that buyers are currently in control. But if the long-term trend is downward, then sellers are likely to regain control and push the price down.
What lesson can we learn? An absorption pattern does not necessarily mean a market reversal. If you want to know where the price will go next, pay attention to the current trend, not the candlestick pattern.
Trading strategy using the absorption model
The opening of a transaction occurs upon confirmation of the absorption model. The third candle should continue the market movement towards the engulfing candle. When the candle closes above this level, we have confirmation of the pattern and can enter a trade with more confidence.
If the engulfing scenario is bearish, the price breakout should pass through the lower body level of the engulfing candle. Therefore, we must prepare for a short trade. If the engulfing scenario is bullish, the breakout should go through the upper level of the engulfing candle.
The best place for a stop loss order is outside of the engulfing pattern. This means that if the engulfing setup is bullish, the stop loss order should be placed under the lower shadow of the engulfing candle. If the engulfing setup is bearish, the stop loss order should be placed above the upper shadow of the engulfing candle.
For take profit you can use a distance equal to the size of the pattern. This means that the minimum profit you should make from an engulfing pattern must be equal to the distance between the ends of the upper and lower engulfing candles.
When this distance has been passed, you can close either the entire transaction or part of it. If you decide to leave part of the trade open, then you should closely monitor the price movement for a potential exit opportunity. This includes analysis of support and resistance levels, as well as possible breakouts of trend channels.
The figure shows a bearish engulfing pattern. The chart starts with the price rising on bullish candles. Suddenly we see a relatively large bearish candle that completely engulfs the previous candle. This confirms the presence of a bearish engulfing pattern on the chart.
However, we are waiting for the confirmation candle before we can consider opening a position. The next candle on the chart is bearish again and closes below the body of the engulfing candle. This is the confirmation required to open a trade based on the absorption model. The stop loss should be placed above the upper shadow of the engulfing candle as shown in the figure.
This trade could be held after reaching the target profit level until a pin bar appeared that showed strong bullish potential.
Determining the significance of the external bar
Now let’s figure out step by step how to determine the potential significance of an outside bar.
The longer the outer bar in relation to the neighboring one, the stronger the signal
This stems from the simple fact that the outside bar reflects the changing balance between buyers and sellers.
At the top of Fig. 13-3 buyers at the helm until the outside bar appeared.
Rice. 13-3. How to determine the significance of an outside bar
Buyers enter this bar without expecting any special changes, but at the close, sellers push the price below the previous low. In other words, as soon as the buyers loosened their grip a little, the sellers immediately took their place.
As a result, buyers can no longer—or will not—drive the price higher.
The stronger the price movement (reaction) to the outside bar, the stronger it is
The reason here is simple, if the market mood changes, then it - the mood - must first be present. Therefore, the stronger the trend before the outside bar, the stronger the emotional component of the trend.
When emotions run high, they become volatile. In other words, if the previous trend is strong and positive, all the bullish sentiment is already in the market. At some point, buyers simply run out of steam and begin to take profits from the market.
This change in mood is reflected by the external bar. An example is shown at the bottom of Fig. 13-3 up.
3. The more bars inside the outer bar, the better
In most situations, the outside bar only covers one other bar. However, if it captured several bars, then the balance has shifted more from buyers to sellers (or vice versa).
As a result, the covered bars will become a small pattern in themselves, as shown in Fig. 13-4.
Rice. 13-4. The outer bar covers several other bars
The greater the volume on the outside bar compared to previous bars, the better
This again reflects a simple idea: the trend before the pattern is dictated by the mood of one of the parties. The outside bar itself indicates that this mood has fizzled out.
If volume is exceptionally strong, it means more market participants are staking their claim on the price.
Therefore, the higher the activity of market participants, the greater the significance of the outside bar
The closer the price closes to the extreme part of the bar, which goes away from the previous trend, the better
For example, if the previous trend is down and the price closes very close to the high, it is much better than it closing near the low and vice versa. All this makes sense if we remember that the outside bar should indicate a reversal in market sentiment and a change in trend. Therefore, a close near the high indicates the strength of buyers, so much the better for the outside bar.
If the closing occurs near the maximum in a growing trend or the minimum in a falling trend, then the outside bar does not correctly reflect the psychology of the market. In such a situation, the outside bar becomes a consolidation, and not a reversal pattern at all.
An example is shown in Fig. 13-5, where the outside bar was drawn after a bit of consolidation, but the close occurred near the bar's high.
Rice. 13-5. External consolidation bar
In this situation, sellers tried very hard to move the price lower and prolong the correction. But in the end they ran out of steam, control passed to the buyers and they were able to close the bar as close to its top as possible.
When you consider an outside bar or any other 1 or 2 bar pattern, ask yourself one simple and very important question:
“How does the price movement in this bar reflect the psychology of the market?”
Long bars, sharp previous trends or price movements, high volumes all indicate a change in sentiment in the previous trend.
Not all 1- or 2-bar patterns are accompanied by trend reversals. Some, for example, can lead to a change in trend when prices consolidate after moving up or down.
Trading mistakes
Beginners learning how to trade Forex need to know how to distinguish bad signals from reliable ones. To do this, you should avoid the following mistakes:
- Trading beyond trends . Simply put, any Price Action design will work better if it has the energy and momentum of the trend. This is not an inside bar, so you should not look for a graphic figure in a flat.
- Trade only on small timeframes . The longer the time interval, the more reliable the pattern. Unlike daily charts, smaller time frames are vulnerable to random price fluctuations and market noise. Use different time periods to understand the full picture of what is happening.
- Ignoring market context . If the signal does not interact with key exchange levels, then you should not trade.
- Placing stop losses in trading close to the order . If the stop loss is too close to the order, you may incur a loss due to chaotic market fluctuations.
- Opening an order when a formation begins.
- Entry when the price moves far away from the moment of reversal.
How to trade using the absorption model correctly?
The absorption pattern itself is meaningless. It will only work when we combine it with the market structure, that is, support and resistance levels.
What should you pay attention to?
- Rapid price growth towards the level.
- Absorption pattern that occurs at the level.
When the price is rapidly approaching a key level, many traders think: “The market is very strong. You need to open a deal in the direction of price movement.”
However, the market then makes a 180-degree turn when it hits the highs, and now this group of traders is trapped. If the price goes in the opposite direction, their stops will start to be triggered, which will give even more impetus to the price reversal.