What does ROE show?
This financial indicator is the most important for business owners or private investors. It clearly shows how effectively the funds invested in the company are used.
The management of the enterprise should regularly calculate the value of ROE, monitoring its dynamics. This gives an understanding of how advisable it is to further develop the business, and what are the prospects for further expansion in the chosen industry.
Future shareholders also rely on ROE readings to assess future dividend yield and the degree of attractiveness of financial investments in the property.
Standard indicator value
Financial analysis does not offer an exact value for the optimal level of profitability of funds invested in core activities:
- firstly, it depends on the industry, operating characteristics and other factors;
- secondly, it should be assessed in dynamics or in comparison with other enterprises in the industry.
Important point! Most often, a high ROIC indicates effective management of invested resources. However, it can also be a consequence of management's desire to squeeze maximum profits out of the business in the short term, which has a negative impact on the company's value in the long term.
If, according to the results of the calculation, the RIC turns out to be negative, then the project, startup, or business is unprofitable. A high positive value of the indicator in practice contributes to an increase in the value of the corporation's shares.
How to calculate ROE
The coefficient is calculated as a percentage of the issuer's net profit (NP) to the amount of equity (Equity). The formula for return on equity is as follows:
\[ROE = PE/SC\x\100\\%\]
By balance
To determine ROE, we take the amount of net profit from the Profit and Loss Statement, and equity from the liabilities of the organization’s Balance Sheet.
For greater accuracy, we substitute the arithmetic average of equity capital for the billing period into the formula for calculating the balance sheet (most often it is one year). To do this, add the data at the end of the period (CK1) to the value at the beginning of the period (CK0) and divide in half:
\[ ROE = PE / ((SK0 + SK1)/2) \]
For a billing period of less than a year, we use the formula with comparable annual data:
\[ ROE = PE x (365/KD) / ((SK0 + SK1)/2), where \]
\( CD \) – number of days in the billing period.
Looking at the calculations, it becomes clear how to improve your return on equity. First of all, you can reduce its value while maintaining the efficiency of the enterprise at the same level. It is also obvious that measures to optimize costs and increase income will contribute to increasing the ROE ratio.
IFRS
According to the international financial reporting system, we use the following data to calculate ROE:
Dupont model
A more complex formula for calculating ROE is the DuPont model. She breaks down the indicator into 3 factors in order to assess the impact of each on the final result.
Dupont model:
ROE = Net Profit / Revenue x Revenue / Assets x Assets / Equity x 100%
If you are a little familiar with mathematics, you will easily see that this formula is nothing more than the ratio of net profit to equity.
Purpose of multipliers:
- Net profit / Revenue – return on sales. Shows how much net profit is received for each ruble of work/services/products sold.
- Revenue / Assets – asset turnover. Shows how much revenue the company receives from each invested ruble of assets.
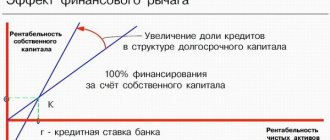
- Assets/Equity – financial leverage. Shows the relationship between total assets and net assets, i.e. excluding liabilities. This is an indicator of the effectiveness of the use of borrowed funds.
A factor breakdown allows you to assess the strengths and weaknesses of a company in more detail and adjust economic policy.
How to Use Return on Equity Ratio
A company's return on equity ratio is an excellent forecasting tool. Compare ROE with alternative investment options:
- bank deposits;
- federal loan bonds;
- shares of other companies;
- as well as other low- and medium-risk projects.
Then it will become clear how much more profitable the chosen investment object is.
If the ROE ratio is lower than the average deposit rate or future yield on the securities purchased, then it is therefore better to choose other options. And the higher the ROE, the greater the return on investment.
By multiplying ROE by the dividend payout ratio, you can obtain the future dividend yield of securities for the upcoming period.
Ways to increase profitability
In the absence of professional analysis, business leaders often take drastic measures. This is a strong reduction in cost or staff reduction. In the first case, the consumer receives a strong reduction in quality, which invariably reduces the company's market share.
In the second case, the enterprise is left without qualified personnel, which clearly affects the efficiency of the enterprise as a whole, revenue, and a decrease in capital turnover.
After receiving the results of calculations by type of profitability, the management of the enterprise receives real directions for work:
- Reduced production costs. Can be achieved through new communications, restructuring of the supplier portfolio, modernization of machinery and equipment;
- Increase in revenue. Introduction of progressive sales methods, new production technologies, revision of sales policy;
- Conducting marketing research.
ROE standard
For Western companies (Great Britain, the States), the standard value of return on equity fluctuates on average around 12%. For the Russian economy, as well as developing countries, where inflation is constantly growing, this value should be higher - up to 20% or more.
There are separate standards for different market sectors. For example, the auto industry has an average ROE of 12.5% in 2022, while the utilities industry has an average ROE of about 6%. In any case, the company should strive for the industry average multiplier value and higher.
PURPOSE OF PROFITABILITY INDICATORS
The main purpose of profitability indicators is to evaluate the effectiveness of management's use of various types of resources, assets and capital of the enterprise.
Based on this, all profitability indicators are relative and are determined according to a general scheme: they calculate the ratio of different types of profit (gross, operating, profit before tax, net) to different types of flows that formed it or to assets (capital) used to obtain this profit.
NOTE!
Profitability indicators are indicators of the efficiency of enterprise management. They show how much profit the company's managers were able to obtain when using a certain amount of resources or assets (capital).
To avoid confusion, we note the following: when it comes to assessing the results of only the operating activities of an enterprise, in the professional literature, individual profitability indicators are often called profitability indicators . Let's clarify this question.
It is advisable to divide all profitability indicators into two blocks:
1) return on sales - indicators characterizing the efficiency of only the main (operating) activities of the enterprise;
2) return on assets ( capital ) - indicators characterizing the efficiency of using a certain type of asset (capital) of the enterprise as a whole.
Thus, when the term “profitability indicators” is used, we are essentially talking about indicators of return on sales. In this article we will use the term “return on sales”.
In international practice, an analogue of profitability indicators is a group of indicators whose names begin with the word “return on,” which literally means “return on.” For example: “return on assets” (return on assets) or “return on equity” (return on equity). In the article, in addition to the Russian term of the indicator, we will also give the international term.
Advantages and disadvantages of the ROE multiplier
When calculating the coefficient, only the value of the company’s own funds is used, thanks to which we obtain a better assessment of the profitability of the business.
But it should be borne in mind that this indicator is quite unstable. It depends on the main factors of the company’s financial condition and changes annually. Therefore, to reliably assess the prospects of its securities, a thorough analysis of historical data should be carried out in order to build a fair forecast in the planning period.
Factor analysis of firm profitability
Just in order to understand which factors influence what, factor analysis is carried out. Using it, you can determine the exact amount of the company’s income, which was received under the influence of endogenous factors. There are special formulas for determining:
Profitability = (Profit from sales of product or services / Cost) * 100%
There is another formula:
Profitability = ((Price of product or service – Cost) / Cost)) * 100%
The classic version of the analysis uses either three or five factors. For three-factor analysis, you need to take product profitability, capital intensity, and capital turnover.
For five-factor analysis, labor intensity, material intensity, depreciation, and capital turnover are used.
Due to the fact that during the analysis all factors are divided into quantitative and qualitative indicators, specialists are able to see the development of the company from different sides.
But for a better understanding, let’s first understand what types of profitability exist.
Examples of ROE calculations
Fictitious financial reporting data over time:
| Period | 31.12.2016 | 31.12.2017 | 31.12.2018 | 31.12.2019 | 31.12.2020 |
Balance (liabilities)
| Section III. Equity | |||||
| Total: | 10160 | 11630 | 12340 | 17960 | 18090 |
Income statement
| Net profit | 2490 | 3130 | 4270 | 4340 | 4410 |
Return on equity (%)
| ROE | 28,72 | 35,62 | 28,64 | 24,46 |
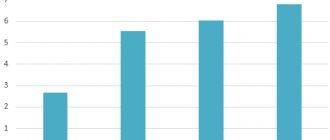
In 2022 and 2022, the company's profit and equity increased, and the ROE multiple grew along with them. Then liabilities in 2022 increased by 45%, and profits remained at the same level, because of this, return on equity decreased, which indicates ineffective asset management of the enterprise.
Examples of using ROE
Let's say you are a private investor and decide to purchase shares of a company operating in the mechanical engineering industry. The choice fell on company A and company B, which receive the same profit, but have different production capacities and the number of units of equipment produced.
Company A is a market giant with an impressive amount of its own funds; 50,000 cars roll off the assembly line during the reporting period. Company B is a small factory that produces 5 times fewer cars - only 10,000. At the same time, the net profit figures are equal.
Comparing these companies by ROE will show us the full picture. For a small production, the calculated coefficient will be much higher, which means its capacity will pay off faster. Therefore, in the long term, the shares of company B turn out to be much more profitable.
There is a break-even point, but no profit
That’s right, because the company breaks even at a certain sales volume. At what point the income from the activity covers all expenses will be shown by the break-even point.
For calculations you will need:
- Add up fixed costs , which include salaries of office and administration workers, rent for office and production premises, security services and resource supply companies, monthly expenses for office equipment and stationery, website and advertising.
- Identify and calculate variable costs , which are directly related to production volume and revenue received. These are the costs of materials, raw materials, purchase of goods for resale, wages of workers or managers.
- Marginal profit . It consists of revenue received without taking into account variable expenses (revenue minus variable expenses).
- Profitability means the share of marginal profit from revenue (divide marginal profit by revenue, multiply by 100%).
Having collected all the ingredients, we get the formula:
Break-even point = fixed costs / contribution margin
For a more substantive study of the “main characters” of the article, we use the real numbers of the current TIN 7710044140.
An analysis of the break-even point for McDonald's shows that having sold burgers and happy meals for 26,511,480 rubles, it will definitely not be at a loss. In this way, we calculated break-even in “money”, and you can also calculate it in “products”. It will show you how many Big Macs you need to sell to break even. Let’s say that on average a Big Mac costs 139 rubles, so you need to sell 190,730 of them in one year.
A few tips before you start calculating:
1. When calculating the cost per unit of production, every ruble is important . Therefore, the error in the calculation for one day in the annual value will be more than significant.
The MyWarehouse service can handle cost calculations for trade or production and, in addition, will show the need for materials and supplies in a timely manner so that you replenish warehouses before a shortage occurs.
2. When calculating the break-even point for a startup, don't count your initial investment . First, sales volumes cover losses, and then from the resulting profit you cover the initial investments.
3. The calculation of marginal profitability can be made for one “flagship” product or for the entire range based on the average bill.
The break-even point has a sobering effect on business owners who are tormented by questions: why is there a cash balance in the current account, the average monthly turnover is huge, but there is no net profit.
In terms of money or quantity of products, the accountant can show them the true situation. If you are working at zero or below, it’s time to change something. To do this, you need to analyze the current situation and make a list of all fixed and variable expenses. And then try to change the model by increasing prices or cutting costs.
One break-even point is not enough to assess the financial position of a business. The profitability ratio will show how effectively existing resources, including human resources, are used.
Connect to the MyWarehouse service until December 20 with a 50% discount.
Conclusion
At its core, return on equity reflects the interest rate at which investors' funds work in the company, so it is advisable to use its value to make decisions on the purchase of securities.
But you should not compare the ROE of companies from different industries. For example, IT companies do not require a large number of assets to generate high profits, while resource-extracting enterprises own huge capacities of fixed assets.
Therefore, for the most complete analysis, the values of the multiplier should be considered in dynamics, as well as in combination with other financial indicators.
Summary
ROE is always useful: every shareholder should know how efficiently his personal capital works. But for those investors who want to find out what's behind ROE, DuPont analysis needs to be used to pinpoint what the real problem is and how the business has dealt with it.
In the DuPont model, we look at three separate ratios that can be compared to determine whether it is wise to invest in a company.
⇐ How to make money on stocks. Lesson 9. ROA coefficient How to make money on stocks: articles from a financial analyst ⇒


