We won’t teach you how to become a financial director in one article, but we tried to include the basics as a starting point.
Financial analysis is the study of key indicators and ratios that provide an objective assessment of the current financial condition of organizations for the purpose of making management decisions.
By calculating financial indicators, you can learn about the current state of affairs at the enterprise, problems and assess its capabilities and prospects in the future.
A competent analysis allows you to correctly build a development strategy, improve the mechanism for managing assets and attracted funds of the company.
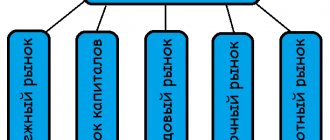
Groups of financial analysis indicators
More than 200 ratios are used in financial analysis.
All these ratios characterize four main aspects - indicators of the financial activity of any organization, namely:
- liquidity;
- profitability;
- asset turnover;
- market price.
For each of these groups of indicators, their own financial ratios are calculated.
The coefficients are calculated depending on the task of financial analysis and the circle of users for whom the information on the company’s financial activities is intended.
Financial ratios and financial performance indicators
Here are the main financial ratios for each group of performance indicators:
The group of liquidity indicators includes the ratios:
- absolute liquidity;
- current liquidity;
- quick liquidity.
The group of profitability indicators includes the following coefficients:
- profitability of working capital;
- profitability of sales;
- return on assets;
- return on net assets;
- return on equity.
The group of asset turnover indicators includes the following ratios:
- asset turnover;
- turnover of current assets;
- inventory turnover;
- turnover of receivables (payables).
The group of market indicators includes the following coefficients:
- earnings per share;
- dividend income;
- share price growth;
- payments;
- market (real value) of the enterprise;
- price/earnings per share.
What is Return on investment
ROI (return on investment
, return on investment, also known as ROR - rate of return) is a financial indicator indicating the profitability (or unprofitability) of investment investments in a business, project, startup, marketing campaign. The return on investment ratio can also have the following names: return on invested capital, return on investment, return, return on invested capital, rate of return.
The return on investment indicator is important for investors who finance various business projects. The ability to monitor the return on investment ratio helps improve business efficiency, analyze sales performance and teach competent allocation of budget funds.
Liquidity indicators
A company's ability to pay off its obligations through the sale of current assets is one of the conditions for its financial stability.
Liquidity ratios allow you to assess the stability of an organization.
Liquidity is the ability of assets to be quickly sold at a price close to the market price.
The easier and faster you can get the full value of an asset, the more liquid it is.
The rate of sale of assets can be:
- High - in relation to property that does not need to be sold (cash) and that property that will be sold quickly enough (cash equivalents, for example, highly liquid debt securities);
- Fast - for property that requires some time for sale, but not very much (short-term debt of debtors);
- Medium - for property that will not be sold very quickly and may lose part of its value during the sale process (inventory, of which work in progress may be difficult to sell).
In practice, a distinction is made between highly liquid, low liquid and illiquid assets.
In the Russian balance sheet, the company's assets are arranged in descending order of liquidity.
They can be divided into the following groups:
- Highly liquid assets (cash and short-term financial investments);
- Quickly realizable assets (short-term receivables, i.e. debt for which payments are expected within 12 months after the reporting date);
- Slowly selling assets (other current assets not mentioned above);
- Hard-to-sell assets (all non-current assets);
In accordance with the classification of property by speed of sale, there are 3 main types of liquidity indicators:
- Absolute - for property with a high rate of sale;
- Fast, which can also be called urgent, strict, intermediate, critical, or called the intermediate coverage ratio, - for property that has a high and rapid rate of sale;
- Current - for property whose sales rate corresponds to the sum of all 3 listed rates.
Liquidity ratios are calculated based on balance sheet data (Form No. 1).
The higher the liquidity ratios, the higher the company's solvency.
Note that each of the liquidity ratios reveals information of a different nature.
Thus, the current liquidity ratio is primarily of interest to investors, the absolute liquidity ratio is useful for suppliers of goods (works, services), and the quick liquidity ratio is necessary for creditors.
How to calculate the return on investment ratio
ROI shows the real profitability of a business solution, so it is usually expressed as a percentage. If the value exceeds 100%, then the profitability of the business is proven, and if it is less than this value, it means that the invested funds are not returned. The following indicators are used to calculate ROI:
- The cost of a product or service, consisting of all production costs: purchase of materials, logistics costs, wages to company employees;
- Total income without deduction of cost;
- Income representing the final profit after the sale of a specific product or service;
- The amount of investment consisting of all cost items allocated to a specific business. Investments can be assets, capital, business principal, and other investments.
The listed indicators are used for the formula, the simplest version of which is as follows: ROI = (total income - cost) / total investment * 100%
As a result, if the value is below 100%, then the investment does not pay off, and if it is higher, then the business is profitable. Return On Investment analysis is usually calculated every month in order to draw conclusions on the basis of the data obtained regarding the profitability of the invested project, understand which goods or services have the highest margins, redistribute the budget and increase the return on investments.
What business processes can be analyzed
Using Return On Investment analysis, you can calculate the return on most investments. However, there are some restrictions. For example, if you look at the ROI of marketing initiatives, you might look at the following marketing functions: direct marketing, sales promotion, loyalty programs, and other marketing activities that are short-term and do not overlap in time and effort with other initiatives where sales data can be obtained for a certain period of time. However, difficulties arise with calculating ROI if marketing activities are complex in nature, where they cannot be divided into individual components. Also, the costs of marketing research, especially long-term ones, cannot be calculated.
Current liquidity
The current liquidity ratio is one of the main calculated characteristics that assess the solvency of a company.
This is the most common and frequently used liquidity indicator.
The current liquidity ratio reflects the company's ability to pay off current (short-term) obligations using only current assets.
Thus, the current liquidity ratio shows to what extent the current assets available to the company, when sold at the market price, will cover the short-term liabilities of the enterprise.
Current (total) liquidity ratio is a financial ratio equal to the ratio of current (current) assets to short-term liabilities (current liabilities).
Data are taken to determine the current liquidity ratio from the balance sheet of the enterprise compiled as of any of the reporting dates.
This is usually the annual balance sheet, but interim statements can also be used.
To see the nature of changes in this indicator over a number of periods, several determinations are made for different reporting dates.
Current ratio formula:
Current liquidity = Current assets / Current liabilities
Since the data for calculating the indicator in question is taken from the balance sheet, the current liquidity formula in relation to the lines of the current form of this report will look like this:
From the entire amount of section V (i.e. from the entire amount of short-term liabilities):
Current liquidity = line 1200 / line 1500Where:
- Page 1200 — line number of the total of section II “Current assets” of the balance sheet;
- Page 1500 - line number of the total of section V “Short-term liabilities” of the balance sheet.
The higher the indicator, the better the solvency of the enterprise.
A ratio value of at least 1 is considered normal.
That is, it is necessary that the total value of current assets be greater than the amount of short-term liabilities.
A value below 1 indicates a high financial risk associated with the fact that the company is not able to reliably pay current bills.
A value greater than 3 may indicate an irrational capital structure.
Quick liquidity
Quick liquidity ratio is a financial ratio equal to the ratio of highly liquid current assets to short-term liabilities (current liabilities).
The quick liquidity ratio depends on the rate of sale of highly and quickly liquid property, which includes:
- Short-term debt of debtors (sold quickly);
- Short-term financial investments (highly liquid);
- Cash (does not require sale).
The essence of the quick liquidity ratio is to calculate the share of current (short-term) debt that a company can repay using its own property over a short period of time, turning this property into cash.
The source of data is the company’s balance sheet, most often the annual balance sheet, but calculations based on interim reporting are also possible.
Quick ratio formula:
Quick liquidity = (Short-term accounts receivable Short-term financial investments Cash) / Current liabilities
Based on the line numbers of the balance sheet, the formula for the quick ratio on the balance sheet can be displayed as follows:
Quick liquidity = (line 1230 line 1240 line 1250) / (line 1510 line 1520 line 1550)
Where:
- Page 1230 - short-term debt of debtors;
- Page 1240 - short-term financial investments;
- Page 1250 - cash balance;
- Page 1510 - balance of short-term borrowed funds;
- Page 1520 - short-term debt to creditors;
- Page 1550 - other short-term liabilities.
A quick ratio of at least 1 is considered normal.
If the quick ratio is equal to or greater than 1, then the company is able to ensure rapid full repayment of its current debt using its own funds. Moreover, part of these funds (if the coefficient is greater than 1) will still remain with the organization.
When the quick ratio is less than 1, the company will not be able to quickly pay off all its current debt with its own funds.
At the same time, a quick liquidity ratio in the range of 0.7–1 is considered acceptable, since it is common practice to run a business with debts.
A quick ratio of less than 0.7 indicates an unfavorable situation, especially if the numerator accounts for the bulk of the amount in receivables, among which there may be doubtful ones.
Analysis methods
Parametric statistical methods are used to analyze return on investment. Financiers divide the analysis of investment profitability into two types:
- Discrete method.
- Accounting method.
To make the most accurate ROI calculations, an investor or company manager must take into account each type of spending (on advertising, product promotion, etc.). Then the results obtained will be reliable, and the predictions made on the basis of their analysis will be plausible.
ROI ratio analysis helps to make optimal use of financial resources. In this case, two problems of rational use of investment funds can be solved:
- When the volume of investment for a project is determined, we must try to get the maximum result from the use of these funds;
- For a given result, which must be obtained through investment capital, it is necessary to minimize the costs of investment funds.
The ROI structure implies 4 categories of possible profit that can be obtained during the implementation of the project:
- Reduce labor costs (labor intensity);
- Reduce capital costs (cost of materials, electricity, etc.);
- Increase labor productivity;
- Increase business profits.
Absolute liquidity
The absolute liquidity ratio shows what proportion of existing short-term debts can be repaid from the company's funds in the shortest possible time, using the most easily salable property.
Determine the initial data for calculating the absolute liquidity ratio based on the balance sheet compiled as of a specific reporting date, or according to reporting for a number of dates, if you need to track the dynamics of changes in this indicator.
Absolute liquidity ratio is a financial ratio equal to the ratio of cash and short-term financial investments to short-term liabilities (current liabilities).
Absolute liquidity ratio formula:
Absolute liquidity = (Cash short-term financial investments) / Current liabilities
Based on the line numbers of the balance sheet, the formula for the absolute liquidity ratio on the balance sheet can be displayed as follows:
Absolute liquidity = (line 1250 line 1240) / (line 1510 line 1520 line 1550)
Where:
- Page 1250 - line number of the balance sheet for cash;
- Page 1240 - line number of the balance sheet for financial investments;
- Page 1510 — balance sheet line number for short-term borrowed funds;
- Page 1520 - line number of the balance sheet for short-term debt to creditors;
- Page 1550 - balance sheet line number for other short-term liabilities.
A coefficient value of at least 0.2 is considered normal, that is, it is in the range from 0.2 to 0.5.
This means that the company is able to repay from 0.2 to 0.5 short-term debts in the shortest possible time upon the first demand of creditors.
Accordingly, a higher value of the indicator indicates a higher solvency.
Exceeding the value of 0.5 indicates unjustified delays in the use of highly liquid assets.
Romi coefficient
To calculate the return on investment in advertising, the Romi coefficient, the so-called marketing ROI, is used. It differs from ROI for business in that it does not take into account the cost of goods, expenses, logistics, wages, etc. The coefficient only calculates the costs of an advertising campaign, that is, marketing investments.
Romi = (Total Profit – Advertising Expenses) / Advertising Expenses * 100%
To calculate Romi you need to consider:
- Marginal profitability or markup;
- Advertising campaign budget;
- Profit from an advertising campaign.
An indicator greater than 100% means that the investment in the advertising campaign has paid off and has begun to generate profit. If the indicator is 100%, the profit received is twice the investment in advertising. If the indicator value is negative, investments in the advertising campaign are not effective.
Using the Target ROAS strategy greatly increases the value of trading companies.
Profitability indicators
Enterprise profitability ratios reflect the degree of profitability of various types of assets and the efficiency of use of material, labor, monetary and other resources.
They are calculated as the ratio of net profit to the amount of assets or flows from which it was obtained.
For this purpose, accounting data is used (Form No. 1 and No. 2).
The higher the values, the more efficiently the analyzed enterprise resources are used.
Owners and shareholders are interested in profitability indicators.
Profitability ratios play an important role in developing a company's investment, personnel, and marketing strategies.
How to increase profitability - proven methods
Establishing the calculation of profitability on an ongoing basis in 1C software products will make it possible to understand what is happening with the efficiency of sales, production, assets and capital in general, and also to take, based on this, measures either to get rid of low-profit products or to improve their efficiency. The same can be said about groups of employees, assets and sales channels - the obtained indicators will become the basis for optimization decisions in the company’s activities.
The main thing is not to do any harm with template, ill-considered decisions that will not actually help in increasing profitability. For example, by cutting off the most expensive employees, you can bring down the entire production, removing the least profitable, but massive distribution channels, you can undermine the customer base, and by abandoning long-term, seemingly ineffective investments that do not pay off in a short period of time, you can narrow the prospects for reaching a new level of development.
To resolve the contradiction between the numerical indicator of the level of profitability as a percentage and the level of development of the enterprise, only indirectly expressed in numerical indicators, one should move from the issue of profitability of the operating cycle and an individual project to the issue of assessing the value of the business, to its long-term prospects.
Many decisions made in the near future, based on the same current profitability indicators, may well be contrary to the interests of the long-term development of the entire enterprise. Therefore, it is necessary to make a decision based not only on the accepted period of time, but also on the strategy corresponding to it. At the same time, software products will help in calculating suitable indicators of profitability and capital, since only on their basis can a rapid mass recalculation of the performance indicators of an enterprise and holding be carried out.
Return on working capital
The profitability of working capital reflects the effectiveness of their use in the manufacturing process.
The profitability of working capital will be greater, the fewer resources the company spends to increase profits.
Formula for return on working capital:
Return on working capital = Net profit/current assets
If we use the lines of financial statements, then:
Return on working capital = line 2400/line. 1200Where:
Page 2400 - line of the income statement (company’s net profit);
Page 1200 - balance sheet line (cost of working capital).
The higher the obtained indicator, the more efficiently your own working capital is used.
The standard value of return on working capital is more than 1.
A return on working capital ratio with a total of more than one means the effective use of working capital and indicates that the enterprise is making a profit.
A negative result demonstrates improper organization of production.
Example of ROI calculation
For example, a company sells office supplies and advertises its activities in a local newspaper and on a radio station. 100 thousand rubles per year are spent on an advertising campaign. When a new client applies, they ask him about the sources from which he received information about the company. If from the radio or newspaper, the total cost of his purchases is entered into a special account.
After a year, the results are analyzed. If it turns out that during the year all the clients who came through advertising brought profit to the company in the amount of 300 thousand rubles, then, knowing this amount, you can calculate the effectiveness of investments (in this case, the profitability of investments in advertising):
ROI = Money Earned / Costs * 100% = 300,000 / 100,000 * 100% = 300%
Consequently, every ruble spent on advertising brought the company 3 rubles of profit.
Return on sales
Return on sales shows whether an enterprise is profitable or unprofitable.
The sales profitability ratio determines the share of profit in each ruble earned and is calculated as the ratio of net profit (profit after tax) for a certain period to the sales volume expressed in cash for the same period.
Sales return ratio formula:
Return on sales = Net profit / Revenue x 100%
To calculate the profitability of sales, information from the financial results report is used (form No. 2):
Return on sales by gross profit = line 2100 / line 2110 × 100Return on sales for operating profit = (line 2300 line 2330) / line 2110 × 100
Return on sales for net profit = line 2400 / line 2110 × 100
There are no special standards for profitability of sales.
Average statistical values of profitability by industry are calculated.
For each type of activity, its own coefficient is considered normal.
In general, a coefficient ranging from 1 to 5% indicates that the enterprise is low-profitable, from 5 to 20% is medium-profitable, and from 20 to 30% is highly profitable.
A ratio of over 30% indicates super-profitability.
Return on assets
Return on assets shows the ability of a company's assets to generate profit and is an indicator of the efficiency and profitability of the company's activities.
The return on assets ratio is calculated as the ratio of profit to the average value of the enterprise's assets and reflects the amount of net profit from each ruble invested in the organization's assets.
To do this, the indicator from Form No. 2 “Income Statement” is divided by the average value of the indicator from Form No. 1 “Balance Sheet”.
Return on assets, like return on equity, can be considered as one of the indicators of return on investment.
Return on assets ratio formula:
Return on assets = profit for the period / average assets for the period x 100%The profit indicators for the numerator of the return on assets formula should be taken from the financial results statement:
profit from sales - from line 2200;
net profit - from line 2400.
The denominator of the formula must be the average value of the value of current assets.
If the profitability of all assets is considered, then the balance sheet is taken (line 1600).
If the profitability of current assets is considered, then the result of section II of the balance sheet asset is taken (line 1200).
If you are interested in their separate type, information from the corresponding line of the second section.
When calculating the profitability of non-current assets, the denominator needs to reflect the total for section I - line 1100. Then we will get the profitability of all existing non-current assets.
If necessary, you can analyze the profitability of a particular type of asset, for example, fixed assets or a group of non-current assets (tangible, intangible, financial).
In this case, the data on the lines that reflect the corresponding property is substituted into the formula.
The higher the indicator, the more effective the entire management process is, since the return on assets indicator is formed under the influence of all the company’s activities.
For a financial organization, an indicator of 10% or more is considered normal, for a manufacturing company - 15-20%, for a trading company - 15-40%.
Results
Calculation of profitability is necessary both for assessing the effectiveness of investments and for planning interaction with tax authorities. If profitability indicators deviate from the industry average by 10% or more downwards, this means that the organization is at risk and can be included in the on-site tax audit plan.
Read about the calculation of other profitability indicators in the following articles:
- “The procedure for calculating the profitability of an enterprise (formula)”;
- “How to calculate product profitability?”;
- “Determining return on equity (formula).”
You can find more complete information on the topic in ConsultantPlus. Free trial access to the system for 2 days.