The concept of "profitability" refers to the field of business and economics and is used to find out how efficiently a commercial organization operates. By analyzing this indicator, a manager or business owner can understand what is happening with his company, whether it is profitable or unprofitable, what its prospects are and whether it is worth investing in its development. What is profitability, why is it needed and how is it calculated, you will learn from our article.
Calculating business profitability may be necessary:
When planning new projects and attracting investors
By knowing the profitability and comparing it with other investment options, an investor can understand which is more profitable. If we consider the example companies, investments in a cafe will bring two and a half times more profit. And investing in a restaurant with a 10% return is more profitable than keeping money in a bank deposit with an annual interest rate of 5%, but it carries more risks.
To analyze the company's performance
If you look at profitability indicators over time, you can understand whether its efficiency is increasing or decreasing.
When assessing the value of a company
A more profitable company will be worth more, as it can bring greater profits to the investor. It is important to compare profitability indicators for companies in the same industry to avoid distortion.
Many different resources are used in the production and sale of products, and each can have its own calculation of profitability. Let's look at the main indicators that are widely used in this article:
- profitability of sales;
- return on assets;
- profitability of fixed production assets;
- profitability of current assets;
- return on equity.
The calculation data can be found in the income statement:
And the balance sheet. Balance at the beginning of the period:
Balance at the end of the period:
The PlanFact service generates these reports from data entered by the user, and also automatically calculates some profitability indicators.
Decoding indicators
Once the data for the formulas has been collected and the calculations have been completed, all you have to do is draw the right conclusions.
- We can definitely say that if the sales volume is below the critical point, it means that the business is suffering losses and may soon go bankrupt.
- If a business manages to reach a break-even point in the middle of the month, this is a good indicator.
- The break-even indicator balances the ratio of variable and fixed costs. Experts recommend reducing fixed costs or converting them into variable costs during periods of uncertainty. Otherwise, the large amount of fixed costs makes the company financially unstable.
- In the business structure, you cannot do without large fixed costs; you need to increase sales and automate processes.
- In the case of the premium segment, where fixed costs are also high, you can work on brand recognition and increase the uniqueness of goods or services.
- When a company is new and stable demand for a product is difficult to predict, it is better not to increase the share of fixed costs.
- Payback may not occur due to too high or, conversely, low prices. Then the established prices should be reconsidered.
Return on Sales (ROS)
The Return of sales ratio reflects the profitability of sales and the share of total profit in revenue. The revenue and net profit values from the income statement are used. An increase in the indicator indicates that the company is growing effectively, while a decrease indicates possible problems in its work.
Return on sales = Profit from sales / Revenue
Revenue is the money received by the company for goods sold, services provided, and work performed.
Depending on what is in the numerator, return on sales can be of different types:
Net return on sales
Net return on sales = Net profit / Revenue
Net profit is the profit remaining in the company after paying taxes, fees and other mandatory payments. It can be positive (the company is doing well) or negative, in which case it would be more correct to talk about a loss.
Net profit = Company revenue – Operating expenses – Other expenses + Other income – Depreciation – Interest on loans – Income tax
Net profitability indicator values:
- negative - the business is unprofitable;
- 1-5% - low-profit business;
- 5-20% - average profitability;
- 20-30% - highly profitable;
- more than 30% - super profitable.
When evaluating a business, it is important to compare its performance with other similar companies. Thus, the normal profitability for the restaurant business is considered to be 10-20%, and in food retail the return on sales is below 4%.
Gross return on sales
Used when analyzing large companies when it is difficult to calculate net profit.
Gross Return on Sales = Gross Profit / Revenue
Gross profit is the difference between revenue and cost of goods sold.
Gross profit = Sales revenue - Cost
There is no normal value for the indicator; it is important that it is positive and shows growth. An increase in the indicator indicates an increase in production efficiency and a decrease in production costs. A fall means that the cost is rising.
Operating return on sales
This indicator reflects how much profit the company will make for each ruble for each ruble of sales revenue after paying production costs, but before paying taxes. Operating profitability helps determine which project is more profitable for the company. It can be used to compare companies in the same industry with similar business models.
Operating return on sales = Operating profit / Revenue
Operating profit is the difference between revenue and expenses for the company's core activities.
Operating profit = Company revenue – Operating expenses
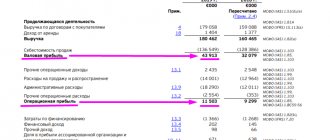
Example:
Net return on sales = 676,300 : 3,800,000 = 0.177 or 17.7%
Operating return on sales = 1,019,300 : 3,800,000 = 0.268 or 26.8%
The business is moderately profitable.
Diana Lebedeva, financier, qualified investor:
“We make sure to work with entrepreneurs with a profitability indicator: 1. We evaluate the business through profitability based on net profit. This indicator also helps set a plan for the company’s revenue in order to achieve the desired result in terms of net profit. 2. We monitor the profitability of each business area in order to promptly respond to unprofitable ones and take measures to resolve them. 3. We evaluate the profitability of individual transactions and projects in order to identify those that bring more income to the company.”
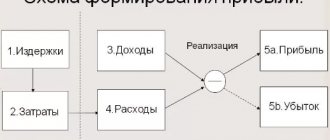
The essence of the concept, analysis and calculation
Profitability is an economic indicator that reflects the degree of efficiency of an enterprise’s use of various resources at its disposal. These can be material, labor, financial or natural resources.
To correctly assess the profitability of an enterprise, you need to analyze profitability ratios over different times and then compare them. The profitability ratio is calculated as the ratio of profit to the assets or flows that form it. If there is an increase in profitability, the enterprise will be profitable. If a decrease occurs, then it is necessary to urgently take measures aimed at increasing this indicator, because negative profitability is an unprofitable activity.
The formula for calculating profitability in a simplified form can be expressed as follows:
Profit / All costs of creating products * 100%.
Eg. If a businessman's revenue is $1,000 and expenses are $500, then the profit will be $500 (1,000 – 500 = 500). In this case, the profitability of this enterprise will be equal to 100% (500 / 500 * 100%).
Analysis and calculation of profitability is necessary for:
- Forecasting possible profits. Having data on the average profitability of an enterprise, you can fairly accurately predict how much profit it will bring.
- Justification of investment projects. This is especially important when the transaction involves a third party investing its capital with the aim of generating income in the future. In this case, the profitability of the enterprise is the most powerful argument for potential investors. Knowing the expected investment amount and the average profitability of the enterprise, it will be easy for the investor to calculate the future benefits of his investment.
- Possibility of comparing indicators with competitors. For example, a new shoe manufacturing company appears on the market. By analyzing their costs, competitors' prices and other factors, as well as assessing the profitability of the business, enterprise managers can determine the acceptable minimum price level for their products, necessary to get ahead of competitors at the start and conquer part of the market. But at the same time, it is necessary to maintain profitability, i.e. stay in the black so as not to go bankrupt.
- Determining the real market value of the enterprise, i.e. when the enterprise is an item of trade. Profitability, as well as liquidity, is considered one of the important indicators affecting the value of an enterprise. If a company has a high level of profitability, it is considered profitable and successful. Based on this, its value will be much higher than that of a company with low profitability indicators.
If the enterprise opened recently (less than 1 year), then there is no point in calculating its profitability, because the turnover of the initially advanced capital takes several years.
Return on assets (ROA)
This indicator reflects how efficiently the company's assets are used and how much income they generate. Return on assets is one of the most important profitability ratios, along with return on sales and return on equity.
Return on assets = Operating profit / Average asset value
Return on assets also depends on the nature of the company's activities. If the industry is capital-intensive and requires significant assets, this figure will be lower. In the service sector, where large investments are not needed, the ROA will be higher.
Normally, this indicator should be positive.
Example:
Average asset value = (1,389,000 + 1,956,300) : 2 = 1,672,650 (RUB)
Return on assets = 1,019,300 : 1,672,650 = 0.609 or 60.9%
This indicator suggests that every ruble invested in assets brings 60.9 kopecks of profit.
The company's assets are divided into non-current (fixed assets and intangible assets) and current. You can also calculate your profitability indicators for them.
What ROI is considered good?
Example of possible ROI calculation results:
- ROI < 100% - the investment did not pay off, and the funds spent exceeded the net income received. You need to reconsider your investment performance, but first you should check the rest of your performance indicators.
- ROI > 100% - the investment has fully paid off, the share of advertising expenses does not exceed income, the project is profitable. No action is required, the return on investment is high.
- ROI = 100% - the investment has fully paid off (there is a return on investment), but the project has not yet begun to generate income from the investment. It is recommended to fully test the product, costs and eliminate errors.
However, it is important to note that for the currency and stock markets, the ROI indicator can be considered good both with positive and negative values. The thing is that many investors invest money in undervalued assets (metals, securities, etc.), which change sharply in price over time. In this case, the rise and fall of asset values can be observed in just a couple of hours, so ROI will be biased as an indicator of the effectiveness of investment.
Return on fixed assets (ROFA)
This is the ratio of net income to asset value. Reflects how much profit the company's fixed assets (real estate, transport, equipment) bring to the company.
Profitability of fixed production assets = Net profit / Average cost of fixed production assets
Example:
Average annual cost of fixed production assets = (198,000 + 165,000) : 2 = 181,500 (rub.)
Return on fixed assets = 676,300: 181,500 = 3.72 or 372%
How to check the payback of a campaign using ROMI
The ROMI value can be in a wide range. When assessing it, the following indicators are possible.
The resulting number is equal to 100%, greater than 100%, or less than 100%.
How to interpret correctly:
● The value is 100%. This means that the organization does not make money, but also does not lose anything. All marketing costs are recouped, but the campaign as a whole is not profitable. This ROMI value is a reason to reconsider the effectiveness of different channels and eliminate those that do not bring profit.
● The value is less than 100%. This result is a clear signal that the advertising campaign is unprofitable. You need to carefully monitor all marketing indicators and reconsider the strategy as a whole.
● Value greater than 100%. The campaign is profitable for business. The general rule is that as long as the ROMI is a number greater than 100%, a particular marketing practice is worth it. And the higher this value, the better.
Return on Current Assets (RCA)
The indicator reflects the efficiency of using current assets. Calculated as the ratio of net profit to current assets:
Return on current assets = Net profit / Average size of current assets
Current assets are assets that change their form throughout the production cycle (cash, inventories, accounts receivable) and completely transfer their value to finished products.
Example:
Average size of current assets = (1,191,000 + 1,791,300) : 2 = 1,491,150 (rub.)
Return on current assets = 676,300: 1,491,150 = 0.453 or 45.3%
When ROI Doesn't Work
ROI is not a universal tool. There are quite a lot of situations in which relying on this show is absolutely pointless. Thus, ROI does not work in cases where the client makes an investment decision after a certain time. For example, when an apartment, business or other expensive item is put up for sale. In this case, the client will not make a purchase immediately, but only after weighing all the pros and cons. As a result, the ROI indicator will not be relevant and will lose its value.
Return on equity (ROE)
Helps evaluate the efficiency of a business and its attractiveness for an investor; it shows the share of net profit in equity capital.
Return on equity = Net profit / Average equity
Equity capital is the value expression of the company’s property, the sum of the authorized, reserve and additional capital.
The authorized capital is formed when the company is created and consists of contributions from the founders.
Reserve capital is created in the process of work and consists of part of the profit received in the process of work.
Additional capital is formed through the revaluation of fixed assets or additional contributions from the founders.
Example:
Average equity capital = (967,350 + 1,406,300) : 2 = 1,186,825 (rub.)
Return on equity = 676,300: 1,186,825 = 0.57 or 57%
There is another calculation formula, Dupont formula . It allows you to more accurately understand which indicator has a greater impact on return on equity.
Return on Equity = Return on Sales x Asset Turnover x Equity Multiplier
Net return on sales was calculated above and equals 0.177.
Asset turnover is the efficiency of using assets, how much money the company receives from each ruble invested in assets.
Asset turnover = Revenue / Average asset value
Asset turnover = 3,800,000: 1,672,650 = 2.272
The equity multiplier in the DuPont formula is the ratio of the average value of a company's assets to its equity capital.
Equity Multiplier = Average Asset Value / Average Equity Equity
Equity multiplier = 1,672,650: 1,186,825 = 1.409
Return on equity = 0.177 x 2.272 x 1.409 = 0.57 or 57%
If you simplify the DuPont formula, you get the usual formula for calculating return on equity. To do this, you need to convert the factors into fractions:
Return on equity = (Net profit / Revenue) x (Revenue / Average asset value) x (Average asset value / Average equity value)
And simplify the fractions by reducing the values of revenue and average asset value:
Return on equity = Net profit / Average equity
Maria Iskusnykh , restaurateur, operational director:
“Profitability indicators are, of course, one of the key indicators of effective performance. Representatives of small businesses, and there are many of them in the restaurant industry, often neglect calculations. This is not worth doing. Without calculations, a project that is not may seem profitable. I believe that any entrepreneur, at least once every three months, should calculate both the gross profitability of the restaurant as a whole and the profitability of sales, including comparing the current sales profitability with what it was before, especially when updating the menu."
How to calculate ROI: in Excel or online?
When calculating the ROI indicator, there is a high probability of making a mistake by not taking into account important indicators. This is why you need to know how to calculate ROI correctly. So, in order to spend a minimum of time on the calculation, without making mistakes in the process of specifying data, you can use several automatic methods for calculating ROI: a special service for calculation or Excel tables.
Ciox is a convenient calculator that has all the necessary variables.
Checkroi is a service that allows you to calculate ROI and a number of other marketing indicators.
You can also use a table in Excel for calculations and store all the data received there.
Ways to increase profitability
There are two main ways to increase profitability:
- Increased income: increased production volume and sales of products, increased prices, increased share of products with higher profitability in the assortment.
- Cost reduction: financial control, cost reduction, optimization of the use of working time.
You can estimate the change in profitability, as well as the profitability of your business when income and expenses change, using a calculator.
The difference between ROI and DRR
DRR is a share of advertising costs. This indicator is especially popular in Russian e-commerce. DRR shows the ratio of advertising costs and the profit received from it. Using a special formula, it is possible to make an accurate calculation to determine what percentage of the income received is the cost of promoting an advertising campaign.
Real income - formula for calculating RRR:
The DRR indicator should not be higher than 100%, otherwise the advertising campaign will be considered unprofitable. The lower the DRR, the higher the effectiveness of the advertising campaign.
Let's summarize
- When assessing business performance, profit plays an important role, but without calculating profitability it is difficult to understand the overall situation.
- Profitability is a relative indicator, calculated as the ratio of profit to the resource whose effectiveness needs to be assessed.
- Calculating profitability allows you to evaluate the efficiency of a business, compare companies from the same industry, and choose the most profitable way to invest funds.
- The main ways to increase profitability are to increase income and reduce business expenses, as well as select more profitable projects and products in the company’s range.
What is ROI
ROI is the rate of return on investment. This indicator is measured as a percentage and allows you to assess the unprofitability or profitability of a particular investment. To calculate this indicator, you need to know only 2 things: the size of the investment and the income from the investment.
ROMI is the same as ROI, but only for assessing the effectiveness of marketing investments. ROMI takes into account only marketing expenses and does not take into account other costs, such as the cost of producing a product.
In simple terms, ROI (Return on Investment) is an indicator that demonstrates how unprofitable or profitable an investment is. Investments mean capital investments directly into the business, that is: expenses for renting premises, paying taxes, employee salaries, purchasing raw materials, marketing, equipment for work, etc.
Significance of factors
Business profitability is influenced by various factors (external and internal). The economist’s task is to identify those that most strongly impede the efficient use of available resources, and hence the increase in profitability.
Internal factors operate within the enterprise itself and depend on the management methodology. They are divided into production (arising during the main activity) and external.
Non-production factors depend on changes in supply and sales conditions.
Negative impacts of the external economic situation are manifested in the following circumstances:
- Additional costs that businesses are forced to bear due to the adoption of new laws.
- Changes in market conditions that reduce sales volumes.
- Unfavorable natural conditions.
- The emergence of competitors.
- Crisis phenomena in financial markets.
- Other factors beyond the control of the company's management.
Administrative measures to improve profitability are described in many materials. They consist of justified cost reductions, increased efficiency, and modernization of production. To implement these programs, it is necessary to increase the value of fixed and working capital, which is achieved by investing borrowed capital.
To establish the degree of influence of external and internal negative influences, various methods of factor analysis are used. There are several of them. For example, consider the three-factor model developed by DuPont. According to a formula derived at the beginning of the 20th century, profitability is calculated using the formula:
Where:
- RSC - return on equity;
- F1, F2, F3 - influence factors;
- IF - net profit;
- SV - amount of revenue;
- CA - asset value;
- SK is the amount of equity capital.
The presented model shows the dependence of the profitability of equity capital on the following factors:
- F1 - return on sales (profit divided by revenue);
- F2 - efficiency of use of available resources (ratio of revenue and assets);
- F3 - share of assets in equity capital.
The DuPont model has undergone a number of modifications associated with an increase in the number of factors, however, these complications do not guarantee that the calculation will show a reliable result.