The financial leverage effect shows how debt affects a company's profits. Bank loans are attracted to replenish working capital, as well as to increase equity capital (for example, the purchase of fixed assets). In this case, loans are the financial leverage that is needed to economically stimulate the company.
In this article, we will analyze the formula for calculating the effect of financial leverage and its individual components, calculate the leverage of financial leverage using an example, and give its optimal dimensions.
What is financial leverage
The ratio between debt and equity capital (financial leverage) shows how much money raised from outside was involved in the cost of equity capital.
Conventionally, we will assume that the equity capital of a joint stock company consists of authorized capital and retained earnings. These indicators are key for investors, because... affect the size of dividends and the price of company shares.
Bank lending is a tool used to increase the amount of equity capital and accelerate its turnover. When used wisely and at the optimal interest rate, borrowed funds work well for the benefit of the company.
We will pay special attention to the interest rate, because... It is precisely this that determines the size of the financial leverage differential, which is calculated as the difference between profitability (net income per share) and debt burden.
If the debt burden is too high, then the enterprise develops slowly, because interest payments “eat up” part of the profit. In the absence of loans, there may be a shortage of working capital, which also negatively affects profitability. Therefore, the economic meaning of the financial leverage indicator is to find the optimal value, the “golden mean”, at which profitability will be maximum.
Financial stability analysis: Inventory coverage ratio
This coefficient of financial stability of the company determines the share of covering its own inventories with working capital. The inventory coverage ratio is calculated using the following formula:
Inventory coverage ratio = Own working capital / Inventories
At the same time, the indicator of “own working capital” is calculated; it is the difference between one’s own capital and investments in non-current assets.
A normal inventory coverage ratio can be considered if the company's reserves are at least 50% covered by turnover. Optimal indicator: 60-80%. However, if absolutely all of the company’s assets are real estate or equipment, then this indicator will be “in the red,” which indicates a very unstable financial position.
Financial leverage formula
We will use two formulas that should not be confused: effect and leverage ratio.
Let's look at a simple example.
In April, the StroyInvest joint-stock company received a bank loan in the amount of 15 million rubles. The purpose of the loan is to purchase equipment. As of September 30, the equity capital of JSC StroyInvest includes:
- authorized capital – 10 million rubles;
- retained earnings - 84,536 thousand rubles.
Let's calculate the financial leverage ratio (Kfr) using the formula:
Kfr=ZK/SK, where:
ZK – borrowed capital;
SK – own capital.
Kfr=15000/94536=0.16.
What does this meaning give us? The financial leverage ratio shows how much of the loan was used to increase equity. In our example, for every 1000 rubles. the profitability is 160 rubles. debt load.
The formula for the balance sheet is very simple: the numerator will be the amount in the lines “Borrowed funds” of the sections “Long-term liabilities” and “Short-term liabilities”, and the denominator will be “Capital and reserves”:
Financial stability analysis: Investment coverage ratio
This financial ratio demonstrates what share of the enterprise’s assets is provided by sustainable sources, that is, its own funds and long-term liabilities. In some cases, it is also called the long-term financial independence ratio. It is calculated using the following formula:
Investment coverage ratio = (Equity+Long-term liabilities")/Total assets
If the indicator is greater than one, this means that the company is able to fully cover long-term investments using its own funds and “long-term” loans. If the ratio drops to the level of 0.7, then the company will probably not be able to pay off the banks because it has exhausted all short-term loans.
What does it show
So, financial leverage characterizes the efficiency of using borrowed capital. If this indicator exceeds one, this indicates high risks.
In general, the financial leverage ratio reflects a direct relationship: the higher it is, the higher the risk. In other words, if the share of borrowed funds in a company's profitability is high, then the debt load may be unsustainable.
When issuing a loan, bank specialists analyze the dynamics of changes in net profit over several quarters or years, as well as the value of assets (fixed assets) that can be accepted as collateral.
In our example, the loan was taken to increase assets. This means that in addition to Kfr, it would be nice to calculate asset turnover, as well as the capitalization ratio. A detailed calculation of these indicators is described in the article “Dupont Formula”.
Types of financial leverage
Based on the efficiency of use, several types of financial leverage are distinguished:
- Positive. Formed when the benefit from borrowing exceeds the fee (interest) for using the loan.
- Negative. It is typical for a situation where assets acquired through a loan do not pay off, and the profit is either absent or lower than the listed interest.
- Neutral. Financial leverage, in which the income from investments is equal to the costs of obtaining borrowed funds.
Find out what factors influence changes in the financial leverage ratio in ConsultantPlus. If you do not have access to the K+ system, get a trial online access for free.
Economic sense
We have already mentioned the ideal ratio of loan and equity, expressed through Kfr. This indicator depends on several factors - primarily on the industry. Thus, for capital-intensive industries (for example, automobile production), the CFR will be significantly higher than for the IT sector. That is, it makes sense to compare financial leverage only within one industry.
To digress a little, I’ll tell you that you can calculate financial leverage for personal finance. In this case, Kfr is calculated a little differently.
When considering an application, banks take into account not only the income of the potential borrower, but also the availability of property. Moreover, the property is valued at market value. It is no coincidence that sometimes a valuation report prepared by a specialized company is required. To estimate the value of a car, a loan specialist can use data from Internet sites.
For example, when applying for a mortgage for 2 million rubles. the borrower has a car with a market value of 800 thousand rubles. will be an undeniable advantage. The KFR for a borrower - an individual can significantly exceed one, and this situation is completely normal:
Kfr=2000/800=2.5.
Returning to the concept of the economic meaning of Kfr, we note that financial leverage shows the degree of dependence on borrowed funds. The higher it is, the greater the company's debt burden.
Some economists, when calculating financial leverage on the balance sheet, take into account not only bank loans, but also debt to suppliers. In my opinion, this is not entirely correct, since the creditor is a very flexible value and its size often does not mean anything. For example, at the end of the reporting period, materials or goods were received for a large amount, and this was reflected in the reporting. And at the beginning of the next period, the company fully paid the supplier. Thus, accounts receivable and accounts payable indicators are dynamic, “working” values that are relevant only at a certain date and should not be taken seriously when assessing profitability.
Financial stability analysis: Autonomy ratio
The autonomy coefficient can be called an indicator of the financial independence of the company. It demonstrates the share of equity in the total assets of the enterprise. In fact, this ratio is a marker of independence from creditors. The lower the number, the less stability and the greater the dependence on banks or other lenders. The ratio is calculated based on balance sheet data as follows:
Autonomy ratio = Equity / Assets
A coefficient of 0.5 is considered normal, and up to 0.7 is optimal. The degree of acceptable value varies depending on the ratio
in the company's structure of current and non-current assets. The more funds a business has, the higher the autonomy ratio should be.
The effect of financial leverage. Calculation formula
Now we come to the concept of the actual effect of financial leverage, which determines the risks and efficiency of investments. This indicator is related to the consideration of the ratios:
- Stock return ≥ income tax rate.
- Own funds ≥ loans.
In a good way, the “greater than or equal” sign should appear exactly as shown above. If the tax rate is higher than the dividend rate, this is not a very good sign. As well as a debt burden exceeding the amount of equity capital.
The effect of financial leverage (EFF) is calculated using the formula:
EFR=(1-t)*DFL*Kfr, where:
t – tax corrector;
DFL – differential of financial leverage;
Kfr – financial leverage ratio.
Let's look at the three components of the formula separately.
Tax proofreader
The tax adjustment is a value calculated as the difference between the unit and the income tax rate. In most cases, the company cannot influence this value, unless it is entitled to tax benefits. For Russian organizations, a rate of 20% has been in effect for many years; only the ratio between its parts credited to the federal and regional budgets changes.
Therefore, for most companies the tax adjuster is equal to 0.8 (1-0.2). We will use this value in our examples.
Thus, the tax adjuster shows how the level of financial leverage changes with an increase or decrease in the tax burden.
As for the return on investment, which ideally should be more than 20%, then, of course, this is not always the case. A negative value is not a reason not to buy shares of this company. Other indicators, which we discuss below, play a key role in determining investment attractiveness.
Financial leverage differential
The differential financial leverage (DFL) is calculated as the difference between return on assets and the lending rate. We learned about the calculation of return on assets (Roa) in the article “Dupont Formula”. Let me remind you of the abbreviated formula:
Impact of credit on profit
If we assume that the company will operate as efficiently as possible, maintaining profitability of assets, then investing borrowed funds in assets will give an increase in profit:
Operating profit = Return on assets x (Assets + Credit)
Companies pay a certain percentage for using credit money; this must be taken into account when calculating profits:
Profit before tax = Operating profit - Amount of interest on loan
Tax amount = Profit before tax x Tax rate
Net profit = Profit before tax - Tax amount
Let's calculate the profit margin and the new return on equity.
Calculation for:
Operating profit = 0.4 x (1,000,000 + 500,000) = 600,000 (rub.)
Profit before tax = 600,000 - 0.2 x 500,000 = 600,000 - 100,000 = 500,000 (rub.)
Tax amount = 500,000 x 0.2 = 100,000 (rub.)
Net profit = 500,000 - 100,000 = 400,000 (rub.)
Return on equity = 400,000 : 1,000,000 = 0.4 or 40%
This coincides with the calculation of the effect of financial leverage. If she takes out a loan, her operating profit will increase by 200,000 rubles, and her net profit by 80,000 rubles.
Calculation for:
Operating profit = 0.1 x (800,000 + 500,000) = 130,000 (rub.)
Profit before tax = 130,000 - 0.2 x 500,000 = 600,000 - 100,000 = 30,000 (rub.)
Tax amount = 30,000 x 0.15 = 4,500 (rub.)
Net profit = 30,000 - 4,500 = 22,500 (rub.)
Return on equity = 22,500 / 500,000 = 0.051 or 5.1%
Credit reduces return on equity. Operating profit will increase by 50,000 rubles, but the loan fee is too high, as a result, net profit will decrease by more than 40,000 rubles.
What is the optimal shoulder size
According to foreign economists, the optimal size is 0.5-0.7. This is difficult to imagine in Russian realities, because... With an increase in borrowed capital, interest costs will also increase. In turn, this will reduce net profit and there is a risk of negative DFL.
Let's return to our example and add the condition that a loan in the amount of 15 million rubles. taken for 3 years. Then interest expenses will be: 15 million * 11% = 1 million 650 thousand rubles. in year.
Over three years, this amount will increase to 4 million 950 thousand rubles.
And if Kfr was equal to 0.5, then borrowed funds would amount to 47,268 thousand rubles. It's easy to calculate interest costs:
47 million 268 thousand rubles * 11% = 5199480 rubles. per year, and for 3 years - 15598440 rubles. Here the emergence of a negative differential is inevitable. Do not forget that the value of assets will decrease over 3 years as a result of depreciation. Unless, of course, the company acquires new fixed assets.
Therefore, for the Russian economy we will focus on a leverage value of 0.2-0.3. This is primarily due to the higher cost of loans compared to other countries.
Leverage ratios to assess solvency and capital structure
Perhaps the most well-known financial leverage ratio is the debt-to-equity ratio.
Debt to Equity Ratio (D/E)
It is expressed as:
D/E = Total Liabilities ÷ Total Shareholders' Equity
For example, United Parcel Service (UPS)'s long-term debt for the quarter ended March 2022 was $24,440 million. United Parcel Service's total share capital at the end of March 2022 was $7,147 million. The company's D/E ratio for the quarter was 3.75. What is considered high?
A high debt-to-equity D/E ratio usually indicates that a company has aggressively financed its growth with debt. This may result in unsustainable earnings as a result of additional interest expense. If a company's interest costs are too high, it can increase the company's chances of default or bankruptcy.
Typically, a D/E ratio greater than 2.0 indicates a risky scenario for the investor. However, this criterion may vary depending on the industry. Companies with large capital expenditure (CapEx) requirements, such as utilities and manufacturing companies, may need to borrow more than other companies. It's a good idea to measure a company's leverage ratios compared to past performance and to companies in the same industry to better understand the data. FedEx has a February 2022 D/E ratio of 1.76, so there is reason to be concerned about UPS. However, most analysts believe UPS is making enough money to cover its debts.
Equity multiplier
The Equity Multiplier is similar, but has assets in the numerator instead of debt:
Equity Multiplier (EM) = Total Assets ÷ Total Shareholders' Equity
For example, let's say Macy's has $19.85 billion in assets and $4.32 billion in equity. The equity multiplier will be:
$19.85 billion ÷ $4.32 billion = 4.59
Although debt is not specifically mentioned in the formula, it is a fundamental factor given that total assets include debt.
Remember that Total Assets = Total Debt + Total Shareholders' Equity. A company's high ratio of 4.59 means its assets are primarily financed by debt rather than equity. According to the calculation of the equity multiple, Macy's assets are financed by liabilities of $15.53 billion.
The equity multiple is a component of the DuPont equation for calculating return on equity (ROE):
ROE = NPM × AT × EM
where: NPM (net profit margin) - Net profit margin (net profitability or net margin) AT (asset turnover) - asset turnover EM - Equity multiplier
Debt to capitalization ratio
The ratio that measures the amount of debt in a company's capital structure is the debt-to-capitalization ratio, which measures a company's financial leverage. It is calculated as:
Total debt to capitalization = (SD + LD) ÷ (SD + LD + SE)
where: SD - short-term debt LD - long-term liabilities SE - equity
In this ratio, operating leases are capitalized, and equity includes both common and preferred shares. Instead of using long-term debt, a financial analyst may decide to use total debt to measure the debt used in a firm's capital structure. In this case, the formula would include minority interest and preferred shares in the denominator.
Financial leverage effect (DFL)
Financial leverage (DFL) is a ratio that measures the sensitivity of a company's earnings per share (EPS) to fluctuations in its operating profit resulting from changes in its capital structure. DFL measures the percentage change in earnings per share for the change in earnings before interest and taxes (EBIT) and is presented as:
DFL = percentage change in EPS ÷ percentage change in EBIT
where: EPS - earnings per share EBIT - earnings before interest and taxes
Alternatively, the DFL can be represented by the following equation:
DFL = EBIT ÷ (EBIT - interest)
This ratio indicates that the higher the degree of financial leverage, the more volatile earnings will be. Since interest is typically a fixed expense, leverage increases earnings and earnings per share. This is good when operating profits are growing, but can become a problem when operating profits are under pressure.
Consumer leverage ratio
The consumer leverage ratio is used to quantify the amount of debt the average consumer has in relation to their disposable income.
Some economists have said that rapidly increasing levels of consumer debt have been a contributing factor to the rise in corporate earnings over the past few decades. Others blamed high levels of consumer debt as the main cause of the 2007-2009 recession.
Consumer Leverage Ratio = Total Household Debt ÷ Disposable Personal Income
Understanding how debt increases returns is key to understanding leverage. Debt is not necessarily a bad thing, especially if the debt is taken out to invest in projects that will generate a positive return. Thus, financial leverage can increase returns, although it can also increase losses if returns are negative.
Debt to Capital Ratio (D/C)
The debt to capital ratio (Debt/Capital) is a measure of a company's financial leverage. It is one of the most meaningful debt ratios because it focuses on the relationship of debt liabilities as a component of a company's overall capital base. Debt includes all short-term and long-term obligations. Capital includes a company's debt and equity.
This ratio is used to evaluate a company's financial structure and how it finances operations. In general, if a company has a high debt-to-equity ratio compared to its peers, it may have a higher risk of default due to the impact of debt on its operations. In the oil industry, the debt-to-capital (D/C) ratio threshold is around 40%. Above this level, the cost of debt increases significantly.
Debt to EBITDA ratio
Debt to EBITDA ratio measures a company's ability to repay incurred debt. This ratio, commonly used by credit reporting agencies, determines the probability of default on the issued debt. Since oil and gas companies typically have large amounts of debt on their balance sheets, this ratio is useful in determining how many years of EBITDA it will take to pay off all debt. Generally, the ratio can be alarming if the ratio is greater than 3, but it can vary depending on the industry.
Debt to EBITDAX ratio
Another variation of the debt to EBITDA ratio is the debt to EBITDAX ratio, which is similar except that EBITDAX is EBITDA before exploration costs for successful companies. This ratio is commonly used to normalize different methods of accounting for exploration costs (full cost method versus successful effort method).
Exploration costs are typically reported in financial statements as exploration, conservation, and dry hole costs. Other non-cash charges that should be added include impairments, increases in asset retirement obligations and deferred taxes.
Interest Coverage Ratio (ICR)
The next leverage ratio associated with interest payments is the interest coverage ratio. One of the problems with looking only at a company's total debt obligations is that it doesn't tell you anything about the company's ability to service its debt. This is what the interest coverage ratio seeks to correct.
This ratio, which equals operating income divided by interest expense, demonstrates a company's ability to meet interest payments. A ratio of 3 or higher is generally desirable, although this varies from industry to industry.
Fixed charge coverage ratio (TIE)
The amount of interest earned (TIE), also known as the fixed charge coverage ratio, is a type of interest coverage ratio? therefore it is often confused with IRC. This leverage ratio attempts to highlight cash flow versus interest on long-term liabilities.
To calculate this ratio, find the company's earnings before interest and taxes (EBIT) and then divide it by the interest expense on long-term debt. Use pre-tax earnings because interest is not taxable. Ultimately, the entire amount of earnings can be used to pay interest. Again, higher ratios are more favorable.
Excel for calculation
An example of calculating financial leverage is an Excel table compiled on the basis of financial statements data:
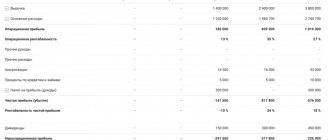
| Indicator name | 9 months 2020 | 6 months 2020 | 6 months 2019 |
| Revenue | 510350 | 326640 | 257389 |
| Product cost | 386211 | 253931 | 212581 |
| Gross profit | 124139 | 72709 | 44808 |
| Renting premises | 21460 | 14305 | 12520 |
| Wage | 42575 | 28383 | 21037 |
| Taxes and deductions | 11280 | 7521 | 6952 |
| Logistics costs | 3050 | 2986 | 1800 |
| Advertising expenses | 1600 | 1519 | 918 |
| Depreciation | 390 | 260 | 201 |
| Communication services | 270 | 180 | 111 |
| Stationery | 28 | 25 | 19 |
| Household expenses | 32 | 30 | 7 |
| Total expenses | 80685 | 55209 | 43565 |
| Profit from core activities | 43454 | 17500 | 1243 |
| Interest on deposit | 215 | 143 | 88 |
| Total operating income | 215 | 143 | 88 |
| Bank services | 123 | 82 | 67 |
| Loan interest | 413 | 136 | |
| Total operating expenses | 536 | 82 | 203 |
| Supplier Awards | 8098 | 6064 | 8140 |
| Total non-operating income | 8098 | 6064 | 8140 |
| Buyer bonuses | 8300 | 8000 | 1787 |
| Total non-operating expenses | 8300 | 8000 | 1787 |
| Profit before taxes | 42931 | 15625 | 7481 |
| Income tax | 8586 | 3125 | 1496 |
| Net profit | 34345 | 12500 | 5985 |
| Assets | 19300 | 16000 | 7800 |
| Equity | 64140 | 48600 | 36672 |
| Bank loans | 11250 | 15000 | 6000 |
| Interest rate | 10% | 10% | 11% |
| Roa | 178% | 78% | 77% |
| Kfr | 0,175397568 | 0,308641975 | 0,163612565 |
| Tax corrector (t) | 0,8 | 0,8 | 0,8 |
| DFL | 168% | 68% | 66% |
| EGF | 0,235667444 | 0,168209877 | 0,086031682 |
Return on equity
Characterizes how effectively equity capital is used. The higher the indicator, the more profitable it is to invest in the company.
Return on Equity = Net Profit : Shareholders' Equity
The formula for net profit in general looks like this:
Net profit = Revenue (income from core activities) - Expenses from core activities + Other income - Other expenses - Depreciation - Interest on loans and borrowings - Income tax
To calculate financial leverage, we use a simplified version:
Net profit = Operating profit - Interest on loans and borrowings - Income tax
Own capital - investments of the founders and retained earnings. You can also find out the amount of equity capital in the balance sheet. The calculation uses the average annual amount of equity capital.
Calculation for:
The average annual equity capital was 1,000,000 rubles.
Operating profit for the year - 400,000 rubles.
Income tax - 20%.
The company does not have loans, so it does not pay interest on them.
Tax amount = 400,000 x 0.2 = 80,000 (rub.)
Net profit =0 = 320,000 (rub.)
Return on equity = 320,000: 1,000,000 = 32%
Calculation for:
The average annual amount of equity capital is 500,000 rubles. Part of the assets is financed through accounts payable - suppliers ship materials with post-payment.
Income tax is 15%, the company uses a simplified taxation system with the object “Income minus expenses.”
Operating profit for the year is 80,000 rubles.
Tax amount = 80,000 x 0.15 = 12,000 (rub.)
Net profit = 80,000 - 12,000 = 68,000 (rub.)
Return on equity = 68,000: 400,000 = 13.6%
The return on equity is also higher.
Let's assume that companies plan to take out 500,000 on credit at 20% per annum. Financial leverage will help you find out how it will affect financial performance.
Calculation example
Now we will give a detailed example of calculating the effect of financial leverage using the example of an enterprise, using data for the 3rd quarter of 2020.
The calculation sequence will be as follows:
- Let's calculate net profit.
PE = Revenue – Cost – Expenses + Operating income – Operating expenses + Non-operating income – Non-operating expenses – Income tax
PE=510350-386211-80685+215-536+8098-8300-8586=34345 thousand rubles.
- Next, we calculate return on assets (Roa).
Roa=Net Profit/Assets
Roa=34345/19300=178%.
- We calculate the differential financial leverage (DFL).
DFL=178-10=168%.
- We calculate the tax corrector:
t=1-20%=80% (0.8).
- Now we find the financial leverage ratio by calculating the ratio of debt to equity.
Kfr=ZK/SK
Kfr=11250/64140=0.1754.
- And finally, we calculate financial leverage.
EFR=DFL*t*Kfr
EGF=0.8*0.1754*168%=0.2357.
Return on assets
This indicator characterizes the efficiency of asset use and is calculated as the ratio of operating profit to assets.
Return on assets = Operating profit : Assets
Operating profit is the profit from the company's main activities, the difference between the company's income and expenses from its main activities for a certain period.
Assets include:
- Fixed assets - real estate, transport, equipment.
- Intangible assets - patents, software.
- Stocks of raw materials.
- Unfinished production.
- Finished products.
- Money in accounts and in the cash register.
- Accounts receivable (what the company owes).
All these articles need to be added up. The size of assets and their total value can also be found out from the balance sheet, where they are already summarized.
The calculation uses the average annual asset size. To calculate it, you need to add up the value of assets at the beginning and end of the year and divide by two:
Assets (average for the year) = (Assets at the beginning of the year + Assets at the end of the year) : 2
This figure may not be accurate if there have been significant fluctuations in value during the year. For a more detailed calculation, you can sum up the amount of capital quarterly, monthly or daily and divide by 4, 12 or 365. This is convenient to do if the company keeps financial records in a special service, for example, in PlanFact.
Calculation for:
Operating profit - 400,000 rubles.
The value of assets at the beginning of the year was 900,000 rubles, at the end of the year - 1,100,000 rubles.
Average annual value of assets = (900,000 + 1,100,000) : 2 = 1,000,000 (rub.)
Return on assets = 400,000 : 1,000,000 = 40%
Calculation for:
Operating profit - 80,000 rubles.
Asset value: 1st quarter - 1,000,000 rubles; 2nd quarter - 900,000 rubles; 3rd quarter - 600,000 rubles; 4th quarter - 700,000 rubles.
Average annual value of assets = (1,000,000 + 900,000 + 600,000 + 700,000) : 4 = 800,000 (rub.)
Return on assets = 80,000 : 800,000 = 10%
Return on assets is four times higher than .
Debt to EBITDA ratio
This ratio is a reflection of the company's credit burden and an indicator of its ability to cover existing obligations. When calculating, an indicator of profit before taxes and depreciation is used, which relatively accurately characterizes the cash flow in the company. Liability data summarizes “long” and “short” loans.
Debt to EBITDA Ratio=Total Liabilities/EBITDA
A coefficient value of no more than 3 indicates the normal financial condition of the company. If the ratio exceeds 5, this means that the credit load is too high and problems may arise with loan repayment. It is important to note that the indicator is correct only if companies repay their debts on time.