Tradingview is a popular technical and analytical web platform and social network for traders and private investors. Launched in the fall of 2011 as an open platform for the exchange of investment ideas.
Today, Tradingview offers users an extensive list of diverse functionality, a special place in which is occupied by graphical analytics, trading indicators and recommendations, as well as a trading platform.
Most TradingView tools are available for free, but there are also several paid subscription options with more advanced functionality. The number of users monthly visiting the site of this service today exceeds 8 million people.
- What is TradingView
- Key features of Tradingview
- How to use TradingView Registration on Tradingview
- TradingView website interface
- Main sections of the Ideas platform
- Markets
- Scripts
- Screener
- Schedule
- More
- Top panel
What is TradingView
What is TradingView
TradingView (Tradingview)
is a well-known provider of interactive charts and detailed analytics on trading assets - cryptocurrency, stock, financial, all kinds of indices, futures, etc. In addition, TradingView is also a social network for traders with the ability to subscribe to each other, exchange messages and publication of forecasts for changes in asset prices accompanied by charts.
Today, the Tradingview website is available in more than 15 languages and contains a lot of useful functionality, which is quite difficult to understand without detailed instructions, especially if we are talking about a novice trader.
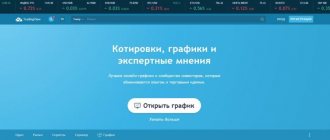
Official TradingView website
Registration
Beginners, of course, get premium access for a month, but there is nothing special there that makes it worthwhile to create an abuse of this opportunity. Even this mythical horizontal volume, which is rumored to give +5 to trading, is not worth the hassle of monthly registration.
You should create one account and try to understand the basic functions, and only then think about a paid subscription. You need to make this purchase on Black Friday, because this is the only day of the year when there are discounts at all.
But since new users receive a free premium, it would be a sin not to take advantage of this at least once and see what good they offer there.
Key features of Tradingview
Tradingview capabilities
Despite the fact that most trading platforms have their own charts that display the situation on trading pairs of domestic markets, most often their capabilities are significantly limited. At best, they can offer a small set of technical indicators and the ability to customize the timeframe.
But, since this is clearly not enough for a full analysis of the markets, the choice of many traders falls on the Tradingview service, which, in addition to the points already listed, has in its arsenal:
Current charts of a huge number of trading platforms and markets.
Wide range of analysis tools.
Hundreds of technical indicators, both classic and original, developed by platform users.
Ability to save elements drawn on charts.
Trading recommendations based on the analysis of popular indicators.
Screeners for stocks, cryptocurrencies and other assets.
Tools for testing trading strategies.
Customizable alerts about market events.
A trading panel that allows you to make transactions on exchanges without leaving the platform interface.
News feed updated in real time.
Widgets for websites.
The above list is far from complete, but contains the most popular tools of the Tradingview platform, which we will now consider.
Appearance Settings
I am a fan of dark themes, and what the service provides by default does not suit me. In general, I change only two settings: the background and the horizontal and vertical stripes:
| Name | Meaning | Additionally |
| Background | #131722 | |
| Vert. and Gor. Grid line | #2a2e39 | Fine dotted line |
I also include the removal of the annoying buy and sell panel as part of the appearance settings. This is done in the settings, trade section, check box at the very bottom to display the buy/sell panel.
How to use TradingView
How to use Tradingview
How to use Tradingview:
- Go to the official TradingView website.
- In the Main Menu, select one of the Tradingview sections (ideas, markets, screener, charts, etc.) and use the functionality available in it.
- If necessary, enter the ticker of a specific asset into the search bar (to view the chart, trading ideas and recommendations).
- Go to the graphical analytics section to gain access to an extensive set of Tradingview tools.
Read more about working with the Tradingview platform in the following review.
Despite the fact that the Tradingview website is open to unregistered users, it is still recommended to create your own, at least a free account, in order to get rid of numerous restrictions.
☝️
Without registration, you won’t be able to work normally with Tradingview, since a notification will pop up in the center of the window at intervals of several minutes with an offer to add to the number of registered users.
Registration on Tradingview
How to register on TradingView
How to register on TradingView:
- Click on the "Registration" button.
- Fill out the form by entering your email and creating a password.
- Confirm that you are not a robot.
- Follow the link in the email sent by the Tradingview system.
To register on the TradingView platform, you need to fill out a simple form, which is called up using the “Registration” button located in the site header.
Launch of registration on the TradingView website
All you need to provide is your username, email address and password. You also need to check the box to agree to the Terms of Service and confirm that you are “not a robot.” In addition, you can register by logging into the account of one of the listed social networks.
Registration form on the TradingView website
Activation of the created Tradingview account is carried out by clicking on the link contained in the letter sent by Tradingview. After this, you can log in to the platform website using the login and password specified during registration.
☝️
The first thing that will attract the attention of a new user is the offer placed next to his name to become a free PRO user for 30 days.
Free TradingView Privilege Subscription Offer
And this opportunity is worth taking advantage of, since paid TradingView subscriptions provide a number of advantages:
Work with several charts in one window (from 2 to 8 pieces).
Combining different charts by instrument or interval.
Saving the user’s “artwork” on an increased number of charts.
Comparison of instruments, currencies, indices, stocks, etc.
No advertisements.
Additional types of charts for intraday intervals (Renko, Kagi, Line Break, Tic Tac Toe).
There is no limit on the number of indicators.
Possibility of using any timeframes (both prepared by the service and arbitrary).
Publishing your ideas.
Using an account on multiple devices.
Chatting with other users.
News feed updated in real time.
You can get any of the available TradingView tariff plans for free, which differ in cost and functionality.
Details of Tradingview tariff plans
To do this, you will have to provide your payment information (card or PayPal account) and agree to monthly payment of the cost of the selected tariff. It is indicated that the first payment will be charged only after a month, and the subscription can be canceled at any time.
Signing up for a Premium subscription to TradingView
Thus, the user gets the opportunity to test all TradingView functionality completely free of charge for 30 days.
☝️
Moreover, this period can be extended by cheating a little - if you cancel the expiring subscription and then create a new account with a different email address, the opportunity to sign up for a free PRO tariff for a month will be available again (each time you need to specify a different card).
TradingView website interface
Official website of Tradingview
The design of the Tradingview website cannot be called minimalistic, since it is quite saturated with all kinds of menus, buttons and various areas with text and graphic data.
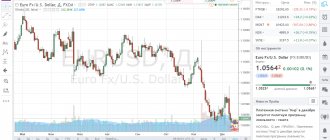
At the very top of the Tradingview website, quotes for six of the most popular market assets are displayed. Immediately below them is a panel with the TradingView logo, “What’s new” buttons (platform news), a menu for selecting the interface language and a search form.
At the end of the same line there is a drop-down menu entitled username. Through it you can go to settings and profile data, financial information, statistics on referrals, subscribers and published ideas. There is also a switch that allows you to activate the dark theme of the Tradingview website interface.
Interface of the Tradingview platform website
On the right side of the Tradingview website there is a fixed panel that displays the contents of one of the tabs present on it:
Quotes, information and news - a default information block with an arbitrary or user-defined list of assets (displaying current prices and their percentage changes), detailed trading data on the selected line and a feed of events that affect the markets.
Alerts - list of active and history of completed alarms created by the user.
Market leaders - real-time updated data on the leaders of growth and decline on different trading platforms.
The economic calendar is a feed of future events important for the market.
My Ideas is a list of user-published predictions.
Chats are public chats for communication between platform participants on the topics of tradable assets or TradingView functionality.
Personal chats - private correspondence with other users.
Ideas feed - a list of new forecasts from subscribed authors, as well as updates to selected ideas.
Notifications - a feed of notifications about user mentions in chats and comments, new subscribers, likes in ideas, etc.
Fixed sidebar on the TradingView website
Main sections of the platform
Access to all the main functionality of Tradingview is provided through the main menu of the site, located in the site header.
Ideas
A section containing trading ideas, strategies, and forecasts posted by TradingView users. In addition, there may be educational materials on various tools for trading and market analysis.
Ideas can be filtered by the asset class they relate to, as well as by the methodology applied (trend and wave analysis, harmonic and graphical patterns, indicators).
Section of the TradingView website with trading ideas
At the top of the ideas page, the ranking of the most popular Tradingview authors for different time periods is always displayed. If you click on the name of a user in this rating or in the description of any post published in the section, you can see the public data of his profile (reputation, number of ideas, likes and subscribers), and the entire feed of his forecasts.
This may be necessary to understand the author's level of competence as a market analyst and, as a result, the likelihood of his forecasts being realized. Ideas can be liked, commented on and reposted on Twitter, Facebook, StockTwits or pasted as code into any website, blog or forum. You can subscribe to authors.
Idea Author Profile Details on Tradingview
Markets
A menu that gives users access to online data on all markets tracked by the platform: cryptocurrencies, stocks, indices, currencies, futures and bonds.
For example, if you select “Cryptocurrencies” in the drop-down menu, a page will open with a list of crypto assets sorted by capitalization, indicating price, trading volumes, changes in value, number of coins in circulation, etc. (by CoinMarketCap rating type).
Using the available tabs, you can switch to trading ideas and forecasts for cryptocurrencies, as well as global capitalization charts.
TradingView platform section with a list of cryptocurrency market assets
Scripts
☝️
It contains more than 5,000 technical indicators and trading strategies published on TradingView, most of which are written in the Pine programming language by platform users.
The Tradingview drop-down menu allows you to view scripts by category, in which they are grouped by common characteristics (oscillators, volumes, volatility, moving averages, market width indicators, etc.). They can be sorted by type (indicator or strategy), as well as by novelty and popularity.
When you select any script, a window opens with a detailed description, source code and instructions for use. To use them, you need to go to the TradingView graphical analytics section and search by name through the appropriate functionality.
Indicators and scripts published by Tradingview users
Screener
Allows you to view a list of market assets sorted by any parameter (growth, oversold, capitalization, volatility, etc.). Tradingview offers three options for this tool - for stocks, the Forex market and cryptocurrencies.
The screener table displays the price of the asset, the percentage of its change, the minimum and maximum value for the period under review, trading volumes, the current oscillator rating, as well as the data source site.
By default, the list is updated automatically in real time, but can also be configured to manually check positions. In addition, the Tradingview screener can display the status of trading pairs based on price dynamics for different time periods, oscillator data and trend lines.
Cryptocurrency screener on the TradingView website
Schedule
When you hover your cursor over this menu, a list of Tradingview charts previously saved by the user is displayed. If you click on one of them or directly on the main link, the TradingView interactive zone with graphical analytics tools will open (more details in the next section).
Drop-down menu with a list of saved charts
More
Through this menu you can go to the “Show” section, which contains videos describing the platform’s tools, reviews of market events, trading ideas, interviews with famous traders and other educational video materials.
It also contains all the information about Tradingview (description, features, prices, terms of the referral program, rules of user conduct, help center, blog) and links to solutions for sites, brokers and advertisers.
Contents of the “More” menu on the Tradingview platform website
Where to buy Bitcoin Cash?
Buying BCH for RUB on the EXMO exchange is very easy, you just need to follow a few steps:
- Login to EXMO or create an account if you don't have one;
- Go to the “Wallet” section of your personal account;
- Select RUB currency and top up your balance;
- Go to the “Trades” page, select BCH/RUB in the list of currency pairs;
- Scroll down to “Buy BCH” and “Sell BCH”;
- Select order type: Limit, Market or Stop:
- Use Order if you want to instantly buy or sell BCH at the current market price (currently 1 BCH is 28682.21 RUB). This order does not require any additional settings.
- A limit order is an order to buy (or sell) BCH at a certain, more favorable price. A buy limit order is executed only at or below the specified maximum price, and a sell limit order is executed only at or above the specified maximum price.
- A stop order is a pending order for automatic purchase or sale operations, which is executed according to previously established restrictions in order to make a profit and (or) minimize possible losses.
- Fill in the “Amount” and “Price” fields (pay attention to the transaction fee).
- Click the “Buy” or “Sell” button.
Easy, right? Now you know that purchasing Bitcoin Cash and exchanging Russian rubles for Bitcoin Cash are available to all users. You just need to figure it out a little.
Tradingview Charts
TradingView Charts
This section of TradingView is worth paying special attention to, since it is where most of the tools available on the platform for graphical analytics, as well as creating and testing trading strategies, ideas and indicators, are concentrated.
☝️
Thanks to the use of HTML5 web technology, Tradingview charts load quickly, update in real time, easily scale, adapt to user settings and, most importantly, do not slow down even when heavily loaded with indicators and drawing tools.
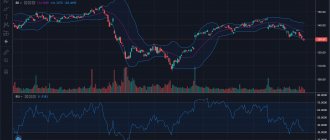
The interface of the section with charts differs significantly from other Tradingview pages. There is no site header or main menu. Most of the screen is occupied by a work area with an interactive chart. Its upper part contains the name of the trading pair, the current timeframe, the name of the data source site, the construction style (bars, candles, etc.) and a list of applied indicators (1).
Also, somewhere at the top of the TradingView website there is usually a floating panel with “Sell” and “Buy” buttons, which is used for trading through a broker account connected to TradingView (2). If it bothers you, you can turn off its display by calling the context menu by right-clicking.
Below the chart there are areas of indicators and strategies that cannot be superimposed directly on it (3). Even lower, under the scale, there is functionality for changing the duration of the period, as well as the “Go to...” menu for moving to a specific point in time in the history of the asset (4). At the end of the same line there are buttons for turning on the percentage and logarithmic scale, as well as for automatic scaling (5).
General view of the workspace in the TradingView graphical analytics section
On the right side of the graphical analytics window there is a column with quotes, alerts, chats and other elements that have already been described above in the section on the interface of the TradingView website. But the other three panels framing the chart at the top, left and bottom need to be examined in more detail.
Top panel
Toolbar above Tradingview charts
The functional area located above the chart contains various buttons and drop-down menus:
- Field for entering the trading pair whose chart the user wishes to download. Here you need to start entering the first letters of the asset ticker to see the available options from different platforms supported by Tradingview.
- Timeframe (seconds, minutes, hours, days, etc.) - used to scale and refine the chart. In the free version, you can use only part of the standard options offered by the system. Owners of paid subscriptions can add their own custom options for basic time periods.
- Construction type - allows you to select the display option: bars, Japanese and empty candles, line, basic area, tic-tac-toe, Kagi, Range, Renko and linear breakout.
- Adding charts of other assets to compare with the current one. You can select options related to other markets. For example, overlay the gold rate (XAU/USD) on the Bitcoin chart (BTC/USD).
- A tool for adding built-in TradingView indicators and strategies, as well as those published by users.
- Fundamental data for the stock market.
- Template indicators are sets of several indicators (oscillators, volumes, EMA, etc.) based on common parameters.
- Creating an alert - the tool allows you to set an alarm for certain events with chart movement in the future (price crossing, entering a channel, change by n%, etc.). Notifications can be displayed directly in the browser (in several options) or sent by email.
- Setting the graph update speed (from 0.1 to 5 seconds).
- Buttons for canceling or returning completed actions.
- Selecting a layout - for paid subscriptions with the ability to work with several charts in one window.
- Menu of general actions with the chart (saving in the cloud, renaming, creating a new one, loading previously saved ones).
- Settings - change the visual display parameters of the chart, scales, workspace, trading options, lines with details of applied indicators, etc.
- Enabling full-screen mode of TradingView charts (to exit it, you need to press Esc on the keyboard).
- Take a screenshot (the same can be done using the Alt+S key combination).
- Publish your idea in the appropriate section of Tradingview.
- Recording a video idea.
Drawing panel
Panel with tools for drawing on charts.
It is located on the left side of the workspace and contains a wide selection of tools for drawing and applying ready-made technical templates to the chart:
- Selecting the cursor type (crosshair, dot, arrow, eraser).
- Trend lines - a menu for selecting the simplest drawing tools (trend line and angle, ray, arrow, straight line, parallel channels, etc.).
- Technical analysis tools - various figures (forks, fans, squares, circles, spirals, etc.), including famous traders Gann, Schiff and Fibonacci.
- Geometric shapes - a set for drawing ellipses, rectangles, broken lines, etc. on a chart.
- Annotation tools—Add text, footnotes, and notes to your screen.
- Patterns - plotting popular geometric and wave patterns on the chart.
- Measurement and forecasting tools - calculating price and time ranges, risk-reward ratios for long and short positions, forecasting further exchange rate movements, using bar patterns and price projections.
- Icons—applying various popular pictograms (arrows, daws, hammers, rockets, etc.) to the chart.
- A ruler for measuring the duration of selected ranges and the percentage change in price between horizontal levels.
- Scale—zooming in of selected fragments.
- Magnet is a tool for linking graphic elements to a price chart.
- Stay in drawing mode.
- Lock All—makes it impossible to move all plotted objects.
- Hide—makes all drawn elements invisible.
- Deleting (graphical objects, indicators, or generally everything that was plotted on the chart).
The bottom panel
Toolbar at the bottom of the chart window
Located below the TradingView chart, the panel offers additional functionality that may be useful to active traders and analysts:
- Screener (1) - allows you to view rating statistics on assets (cryptocurrencies, Forex, stocks) in parallel with working in the chart window. In essence, this is a slightly stripped-down version of the section of the same name, accessible from the main menu of the Tradingview website.
Cryptocurrency screener in the TradingView graphical analytics section
- Notes (2) - a simple tool for recording thoughts while working with charts.
Tool for taking notes regarding a schedule
- Pine Editor (3) is a full-fledged script editor that can be used to create your own strategies and indicators and then publish them on TradingView.
Editor for creating graphical analytics scripts
- Strategy tester (4) is a tool for testing the operation of the strategy applied on the chart. Shows a list of transactions made with its help and a summary of their effectiveness.
Tool for testing strategies added to TradingView charts
- Trading panel (5) - allows you to practice trading assets whose charts are viewed by the user, using a demo account with $100,000 on the balance. You can also connect an account to one of the supported platforms to make real trades without leaving Tradingview.
Tradingview trading panel
Using the buttons located on the right side of the panel (6 and 7), you can collapse and expand the workspace of the listed tools, including the entire graphical area.
Interacting with Tradingview charts
How to work with TradingView charts
General principles of interaction with TradingView charts:
- Moving along the timeline is done using the “Hand” tool, which appears when you hold the cursor anywhere on the chart. You can also scroll the picture left and right using the arrow buttons.
Ways to move around the chart
The chart scale can be changed in several ways:
Scrolling the mouse roller.
By squeezing and stretching the time and price scales.
Using the “+” and “–” buttons at the bottom of the chart.
Using the Loupe tool located on the Drawing panel.
Options for changing chart scale on TradingView
- Resetting the chart state (returning to the default scale) is done through the button above the timeline or through the context menu, which is called by right-clicking anywhere in the workspace. Through it you can delete all added indicators and strategies.
- When working with drawing tools, a floating panel appears on the chart with buttons that allow you to change the color and type of outline, edit the order of layers, copy and clone, hide, fix and delete objects, and also create alarms at the intersection of drawn trend lines.
Panel for editing graphic elements on Tradingview charts
- When you hover the cursor over the line with the name of the indicator added to the chart, buttons appear that allow you to hide, delete and configure it. The latter makes it possible to select options that differ from the default ones. Moreover, you can change both the visual display style of the indicator and its technical parameters.
Setting up indicators on a chart
Otherwise, most of the functionality available for working with charts is intuitive for users who have at least a general understanding of trading and analytics. More advanced knowledge may be required when using complex Gann and Fibonacci tools, as well as some technical indicators and strategies.
The video below will help you understand the functionality of Tradingview even better:
Tradingview Review
Left panel of graphical constructions.
Now let’s look at the left panel, which contains a huge number of useful tools:
- Choose a convenient cursor type in the form of an arrow, dot or cross.
- The trader's most important tool is the line.
- Complex graphical elements: Gann fans, Fibonacci corrections, spirals, wedges and others.
- A variety of standard shapes: arc, triangle, square, ellipse, etc.
- Adding text.
- Pattern drawing – triangles, time cycles, ABCD pattern
- Possibility of calculating risks for transactions and predicting the result
- Information icons
- Zooming in on a specific area of the graph
- Using Additional Information
- Magnet function
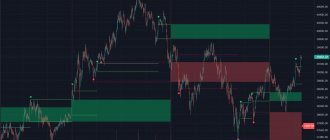
Using graphical constructions, you can draw support or resistance lines, channels, trend lines - the most important elements of technical analysis.