One of the classic oscillators that is easy to understand for experienced and novice traders is the Momentum indicator. The history and year of its creation are unknown, but this mathematical algorithm has been repeatedly described in classic trading textbooks, for example, in the book “Technical Analysis of Futures Markets” (author John Murphy, 2008). Since then, it has been actively used to study the dynamics of cryptocurrency and other assets.
What is a momentum indicator?
The momentum indicator belongs to the class of oscillators. The indicator readings fluctuate from a central 100 axis, which may or may not be displayed depending on the current indicator settings. Additionally, the momentum indicator is a leading indicator. This means it can predict potential trend changes.
This indicator measures the rate of change or speed of movement of the price of a financial instrument by comparing the last candle to the previous one over a certain number of periods. By analyzing the rate of change, we can measure the strength or momentum of a financial instrument.
Declining dynamics indicate that the market is depleting and a pullback or reversal may soon occur. An accelerating momentum condition suggests that the trend is strong and is likely to continue. Many momentum trading techniques, such as range breakout, rely on the idea of accelerating momentum.
The momentum indicator is a versatile indicator and can be used in several different ways. It can be used as a trend confirmation signal, as well as a reversal trading signal. A trader's job is to understand the current market environment and use the most appropriate indicator signal given the overall context.
For example, in a trend phase we can consider signals for the continuation of a trend, while in a market that is in consolidation, we can limit ourselves to signals for a reversal. It is important to remember that the momentum indicator provides useful information in both range-bound and trending markets.
The indicator consists of a single line, but many traders also prefer to add an additional line to the indicator, which acts to smooth out the signals. The second line is usually a moving average of a certain period. Popular settings are 9, 14 or 21.
Be aware that the shorter the X period setting, the noisier the second line reading may be, which may result in false signals. Longer period inputs for the X setting will result in higher quality signals, but the signals will appear much later.
Typically, the momentum indicator will appear in a separate window at the bottom of the chart panel. Let's look at the chart below, which displays a 10-period Momentum indicator along with a 21-period simple moving average.
Definition and calculation formula
Momentum is one of the simplest oscillators. This category includes indicators that reflect the price cycle of a cryptocurrency or other asset. The idea behind it is that a chart cannot go up or down indefinitely – at a certain point it reverses. Moreover, in any market the price periodically enters 2 extreme zones:
- Oversold – the asset has dropped significantly in price, a downward trend is developing, but it will soon be replaced by an upward one. Therefore, now you need to buy (BUY) rather than sell.
- Overbought – the asset has greatly increased in price, an upward trend is developing, but it will soon give way to a downward one. Therefore, it is necessary not to buy, but to sell (SELL).
It is impossible to visually determine these zones, since the trader must understand exactly to what value the price can rise or fall before an opposite trend begins to develop.
Read more in the article: What are oversold and overbought in trading?
To clearly answer this question, you can use either support/resistance levels or oscillator indicators, which include Momentum. Of course, both tools can be used together - then the accuracy of the signals will increase.
Momentum (M) is based on a simple formula:
M = (Closei / Close(in) )*100
Here Closei is the price at which the current candle closed, and Close(i—n) is the closing price n candles ago. In the classic version, a period of n = 14 is used, but other settings can also be used.
Graphically, the indicator looks like a line under the chart that moves following the price and periodically forms highs or lows.
The more pronounced these peaks are, the faster the price changes. Therefore, we can say that momentum shows:
- rate of price change, which is especially important for cryptocurrency, the quotes of which can fluctuate quite significantly even within 1 day;
- current trend (the indicator line goes up or down following the price);
- possible turning points (peaks, i.e., highs and lows signal the end of a trend and the likely emergence of an opposite trend).
How is the momentum indicator calculated?
The momentum indicator compares the current closing price with "n" periods of closing prices in the past. The period "n" is an input value that is determined by the trader. Most charting programs use momentum indicator values of 10 or 14. So, if you set "n" to 10, it will compare the current closing price to the closing price 10 periods ago.
M = (CP / CPn) * 100
Where M = momentum, CP = closing price, n = closing price n bars ago.
Let's look at an example using the following input:
CP = 109.10
CPn = 102.50
M = (109.10 / 102.50) * 100
M = 106.43
Confirmation tool
Momentum begins to perform a truly useful function when used as a means of confirming signals from a separate primary indicator. One of the best methods is to look for the divergence between price and momentum as a way to measure the strength of a trend. Momentum divergence is a simple but powerful concept in technical analysis.
Thus, the signal to buy or sell will come from a pre-selected main indicator. It should then be checked to see if the divergence between price and momentum is consistent with bullish or bearish trends.
Momentum indicator signals
The momentum oscillator helps determine the force behind price movement. We can use momentum to pinpoint when the market is likely to continue moving in the direction of the major trend. Additionally, momentum analysis can help us identify situations where price action is losing momentum so we can prepare for a potential trend change.
The three main signals that the momentum indicator provides are:
- Crossing the 100 line.
- Moving average crossover.
- Divergence signal.
Let's look at each of these signal types.
Momentum indicator setting
Setting up this indicator is very simple, since it has an informative menu in which you only need to select the necessary parameters. From the very beginning, it is worth determining for yourself the trading period with which the indicator will work. Initially its value is 14.
The range of motion is typically -100 to +100. Such a spread of values is necessary for the indicator line to move within these numbers, which helps to accurately determine the trend.
There is also a menu for additional settings. In it you can change the line color and set additional levels. There is also a choice of time frame on which the indicator will turn on automatically.
Crossing the 100 line
One of the types of signals provided by the indicator is the crossing of the 100 line. When the price moves below the 100 line and crosses above it, it indicates that prices are moving upward and you can take bullish positions. And similarly, when the price moves above the 100 line and crosses below it, it indicates that prices are declining and that you can enter bearish positions.
Keep in mind that you should not use the 100 line crossing in isolation. The point is to watch the price relative to the 100 line and use other filters to find the best entry opportunities. For example, in an uptrend, you can wait for the price to roll back to the 100 line and enter the market after the price crosses this line. You can also filter this condition using the breakdown of 3 candles.
Application as an oscillator
No matter how convenient it is to use this indicator, the following question arises. Oscillatory analysis is most convenient in case of extreme price positions. But how can we determine how strong or weak a market moment is currently if we have not set any criteria other than the zero line? This problem can be solved in two ways: either visually assess the value of Momentum in comparison with its previous declines and rises, or turn to other oscillators.
This is not to say that the first solution to the problem is completely unacceptable. Let's simply determine the historical highest and lowest levels of Momentum and compare them each time with the current value. A sell signal appears when Momentum or its moving average rises by a significant amount, reverses, and begins to fall.
A buy signal appears when Momentum or its moving average falls by a significant amount, reverses and begins to rise. This “significant amount” will vary on each Forex currency pair and should be tested separately. Moreover, this value will be different over different time periods.
In this case, it is more convenient to normalize the Moment plot by dividing the values by the largest amplitude achieved. As a result, it will change from – 1 to + 1. Reaching the danger zone, i.e. approaching one in absolute value, the Momentum value signals a weakening or strengthening of the price trend. For example, the achieved value of 0.95 indicates that the price is rising too quickly and the next stage will be consolidation or even decline.
The idea of normalizing Momentum was brought to life as the Commodity Channel Index. Donald Lambert, the author of this index, uses the average of prices over the several days for which the calculation is being made as a divisor, then multiplies the resulting value by 1.5. The resulting curve is completely similar to Moment, but its fluctuations are considered in relation to the -100 and +100 levels.
Moving Average Crossover
To use a crossover signal, you need to plot both the momentum line and the MA line.
The basic idea is to buy when the momentum line crosses the moving average from below and sell when the momentum line crosses above the moving average. We can enhance these types of signals by only making trades in the direction of the current trend or only taking signals after overbought or oversold conditions are met.
Look at the chart below, which shows a Momentum crossover buy signal combined with an oversold RSI reading.
Strategies based on Momentum
The Momentum indicator is not used very often: as a trend indicator it often simply repeats the price, but as an oscillator it loses to many similar ones. So, Forexstart, for example, indicates that MACD or Stochastic are much more effective. However, there are good systems that work with Momentum and other instruments in combination.
Strategies based on Momentum:
1) The Elder Momentum strategy in combination with the Moving Average of the same period is suitable for most standard time periods and makes the use of Momentum more effective. Signals are generated when two conditions are met: the price crosses the EMA and the Momentum passes through the zero level. When the crossing in both cases occurs from above - a sell position, from below - a buy position.
2) The “Momentum Pinball” system - created by Linda Raschke, the signals are not very frequent, but profitable, multi-currency, transactions are concluded in accordance with signals of two intervals (hourly and daily). To work with the strategy, just download and install the Forex Momentum Pinball indicator on the chart and configure it correctly.
Divergence signal
Divergence is a very simple yet powerful concept in technical analysis. Bullish divergence occurs when prices make lower lows, but the momentum indicator (or other oscillator) makes higher lows. Accordingly, a bearish divergence occurs when prices make a higher high, but the momentum indicator (or other oscillator) makes a lower high.
Divergence gives the trader a hint of weakening momentum, which can lead to a complete change in trend. Momentum divergences tend to occur in extreme market conditions when prices have gone too far and, like the rubber band effect, they should return to a meaningful area.
It is worth considering that during strong trends, divergences will give many false signals. Therefore, it is important not to use divergence in isolation. Understanding what is happening on a higher time frame is often very useful when filtering trades. Finding key areas of support and resistance and using this as a backdrop to set divergence can greatly increase your chances of making a profitable trade.
During a trending market, you can also look for a pullback when the price deviates from the momentum indicator. Trading a divergence that occurs with the trend will provide a higher level of success than trading against the trend and trying to enter at the top or bottom of the market.
When attempting to trade against a trend using divergence, it is important that you have additional evidence that a reversal is likely. No matter how much the market has expanded or how good a countertrend divergence signal looks, it may very well be a false signal and the trend move may continue. Remember the old saying: “Markets can remain irrational longer than you can remain solvent.”
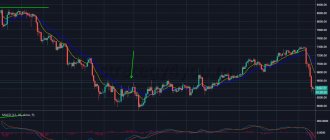
Notice on the far right of the chart where price makes a higher high and the momentum oscillator makes a lower high. This is a quality divergence setup. Now let's take a look at the divergences that occurred during a strong market decline.
The chart above shows that the price is in a strong downtrend. Below are three momentum divergence signals. All of them turned out to be false as the price action continued its downward trend. This should make you think twice about trading divergences during strong trends.
Principle of operation
The main task of the indicator is to track the trend and price acceleration.
If momentum grows and draws a new high, then most often this indicates bullish sentiment, and there is a possibility of continued growth. If a new minimum is drawn, then the trend may continue to go down.
Using the momentum chart and price, you can consider signals of convergence and divergence or, in other words, their convergence and divergence. If quotes are rising, and the momentum chart bends down and begins to roll back, this may mean a quick reversal of the movement. In such a situation, you can move your stops to breakeven and think about exiting your positions. For sales, everything is mirrored. If the price rises again and draws a new high higher than the previous one, but the momentum does not update its highs, then there is a divergence, indicating a decline in buyer interest, and there is a high probability of a downward movement. Well, for sales everything is the same.
But momentum is not the holy grail. False signals are also not alien to him. Therefore, it is important to give more weight to signals in the direction of the trend.
Divergence and the Zig Zag indicator
The Zig Zag pattern is a fairly simple pattern based on Elliott Wave theory. It consists of three waves - A, B and C. Wave A is the initial wave of the pattern, which continues with wave B. Wave B must retrace less than 100% of wave A. Wave C moves in the same direction as wave A , and must go beyond it.
Let's put all the elements together to create a trading strategy. First, we look for a trending market. Secondly, we want to see a correction of the zigzag in this trending market. And then, finally, we wait for the formation of divergence within the zigzag pattern.
If we can confirm the divergence of the Momentum indicator and the price, then this will be our trading setup. Our entry signal will occur at a break of the trend line that starts from the beginning of wave A and connects to the beginning of wave C. We will call this the AC trend line.
We will try to place our stop loss outside the most recent swing created before the AC trend line was broken. And for take profit we will target the area right at the beginning of wave A.
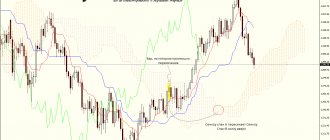
In the far left corner of the chart, you can see that the price is in a steady downtrend. At some point, the price movement begins to accelerate, and soon a zigzag pattern forms on the chart. We also see that a bearish divergence pattern is forming. All this indicates a possible reversal, so we are considering short positions.
Some time after the divergence pattern has formed, we have a strong breakout and price settles outside the AC trend line. This is the entry signal we are waiting for to enter short.
The stop loss will be placed just above the pin bar that appeared a few candles ago. Immediately after our entry, the price tested the broken AC trend line and then sharply shifted towards the downside.
Combination of methods
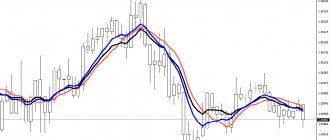
It is worth noting that it is more reliable to use Momentum as an oscillator together with a trend indicator. Moreover, this role can be played by Momentum itself with a long period. If the trending Momentum is above 100 (ideally, with consistent updating of its own highs), then you should make purchases when the shorter Momentum drops to 100 and is pushed up. At the opening of the next candle after such a repulsion, you should make a purchase, placing a stop below the last extreme. The opposite is true for a downtrend.
After long Momentum stopped updating lows in the chart above and broke through the zero line upward, selling was no longer made. Thus, Momentum with a longer period can be a trend indicator, and provide advanced information about the development of the trend. A trader should look at the nature of the formation of extreme points on the trend Momentum to confirm the trend.
Moreover, the trend Momentum can form divergences with the price, ceasing to update the extrema in the trend body according to the indicator when the extremum is updated by the price. This signal is especially good when the trending Momentum breaks its trend line and the shorter Momentum gives a buy signal by touching and pushing off the 100 line towards the divergence.
Momentum, divergence and horizontal levels
Support levels are areas where price may change direction or find demand (buying pressure). Resistance levels are areas where price can find supply (selling pressure). When a support level is broken, it turns into new resistance. When a resistance level is broken, it turns into new support. It is important to note that support and resistance should be considered as zones or areas and not as a fixed line.
One of the main mistakes that traders make is that they usually look at only one time frame - their trading period. By doing this, they lose sight of what's happening in the bigger picture, often entering positions right at a key support and resistance level without even realizing it. Therefore, it is always important to know where the major support and resistance areas are so that you can target them in your trading.
This time we will be trading divergence from key levels at a higher time frame level. So, if you are trading on the 60 minute chart, your key levels will appear on the 240 minute chart, which is the next higher time frame. Or, if you are trading on the 240 minute chart, your key levels will appear on the daily chart. Typically, the higher time frame will be 4-6 times your trading period.
In this strategy, we will first wait for the price to approach a key level based on a higher time frame. We then carefully monitor the price movement and wait for divergence to appear near the level. Our entry signal will occur when the momentum indicator crosses.
For the stop loss we will use the most recent swings before the momentum crossover signal. To exit, we will wait for the momentum indicator to cross in the opposite direction.
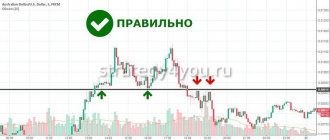
The price is in a downward trend. When the downward movement began to slow down, the price began to reverse. When the price reached the resistance level, a good divergence pattern formed. This pushed us into a potential short trade.
Next, we will need to wait for the momentum indicator crossover signal before we can take a trade. And indeed, this signal soon appeared. As a result, we would go short and place our stop loss above the recent swing high as noted on the chart. Prices fell quickly and a few days later there was a cross signal on the momentum indicator where we could close the trade for a good profit.
Modeling
Modeling means testing an indicator on historical data using Excel.
The archive of quotes is taken from the Alpari terminal. Pair – EUR/USD, timeframe – Daily (testing period 15 years – from 01/01/2001 to 07/29/2016). The commission (spread, slippage, swap) was taken on average 1.5 points on the 4th sign. All results are also displayed in points on the 4th character. Testing was carried out under the condition of taking the profitability of a bar (“candlestick”) from the opening price (Open) to the closing price (Close). A trade is opened after the previous bar (candle) closes.
Test 1. Testing the Momentum indicator with a period of 14.
Signal 1.1. We buy if the indicator values are above 100. We sell if the indicator values are below 100.
Test results report for signal 1.1:
Signal 1.2. We buy if the indicator crosses the level of 100 from bottom to top. We sell if the indicator crosses the 100 level from top to bottom. This signal is single and does not imply holding the position in the future.
Test results report for signal 1.2:
Signal 1.3. We buy if the indicator values show growth. We sell if the indicator values show a fall. We use the entire range of values.
Test results report for signal 1.3:
Signal 1.4. We buy if the indicator values show growth above the 100 level. We sell if the indicator values show a fall below the 100 level.
Test results report for signal 1.4:
Signal 1.5. For period 14, using the selection method, we identified the boundaries of overbought (level 103) and oversold (level 97). We buy if the price leaves the oversold zone (rises above 97). We sell if prices leave the overbought zone (falls below 103). This signal is single and does not imply holding the position in the future.
Test results report for signal 1.5:
Signal 1.6. We buy if the price is in the overbought zone (above 103). We sell if the price is in the oversold zone (below 97).
Test results report for signal 1.6:
Signal 1.7. We buy if the price is in the oversold zone (below 97). We sell if the price is in the overbought zone (above 103).
Test results report for signal 1.7:
Preliminary result of test 1: the signal for trading in overbought/oversold zones for the continuation of the trend performed best. The signal for crossing the 100 level also turned out to be profitable, but due to the small number of transactions, interest in this signal is low. The worst result was shown by signal 1.2, when we opened positions depending on changes in indicator values according to the growth/decline criterion.
Test 2. Testing the Momentum indicator with a period of 21.
Signal 2.1. We buy if the indicator values are above 100. We sell if the indicator values are below 100.
Test results report for signal 2.1:
Signal 2.2. We buy if the indicator crosses the level of 100 from bottom to top. We sell if the indicator crosses the 100 level from top to bottom. This signal is single and does not imply holding the position in the future.
Test results report for signal 2.2:
Signal 2.3. We buy if the indicator values show growth. We sell if the indicator values show a fall. We use the entire range of values.
Test results report for signal 2.3:
Signal 2.4. We buy if the indicator values show growth above the 100 level. We sell if the indicator values show a fall below the 100 level.
Test results report for signal 2.4:
Signal 2.5. For period 21, using the selection method, we identified the boundaries of overbought (level 103) and oversold (level 97). We buy if the price leaves the oversold zone (rises above 97). We sell if prices leave the overbought zone (falls below 103). This signal is single and does not imply holding the position in the future.
Test results report for signal 2.5:
Signal 2.6. We buy if the price is in the overbought zone (above 103). We sell if the price is in the oversold zone (below 97).
Test results report for signal 2.6:
Signal 2.7. We buy if the price is in the oversold zone (below 97). We sell if the price is in the overbought zone (above 103).
Test results report for signal 2.7:
Preliminary result for test 2: only one signal showed a net profit - this is the signal for crossing the level of 100. But despite this, the overall result is better than in test 1. The worst result again is for the signal for trading indicator values for growth/decline.
Test 3. For the most promising signals (1.1, 1.6, 2.1 and 2.3), we simulate a loss limit (stop loss) of 100 points on the 4th sign.
Signal 3.1. Momentum with a period of 14. Buy if the indicator values are above 100. Sell if the indicator values are below 100. Add a stop loss of 100 points on the 4th sign.
Test results report for signal 3.1:
Signal 3.2. Momentum with a period of 14. We buy if the price is in the overbought zone (above 103). We sell if the price is in the oversold zone (below 97). Add a stop loss of 100 points at the 4th sign.
Test results report for signal 3.2:
Signal 3.3. Momentum with a period of 21. Buy if the indicator values are above 100. Sell if the indicator values are below 100. Add a stop loss of 100 points on the 4th sign.
Test results report for signal 3.3:
Signal 3.4. Momentum with a period of 21. We buy if the indicator values show growth. We sell if the indicator values show a fall. Add a stop loss of 100 points at the 4th sign.
Test results report for signal 3.4:
Preliminary result for test 3: the best result was the buy/sell signal above/below the level of 100. This signal showed the largest increase in the balance with both a period of 14 (14,421 points on the 4th digit) and a period of 21 (16,245 points on the 4th character). But there is one unpleasant nuance - for more than half of the period (until the end of the summer of 2008), the total profit fluctuated around zero or dropped significantly into the minus. Other signals also have this problem.
We also tested the Momentum indicator with a period of 7, but the results were so unsatisfactory that there is no point in publishing them.
Let's sum it up
There are three main trading signals that can be used with the momentum indicator. These signals include the 100 line crossover, momentum crossover, and divergence signal. The best signal for the momentum indicator is the divergence signal. But no matter what type of signal you use, it is highly recommended to use other structural factors in technical analysis.
You should not trade a momentum indicator without first analyzing the underlying overall picture in the market. If you stick to this principle, you will be less prone to mistakes and false entry points.
Momentum indicator description
As mentioned earlier, the indicator is a technical analysis tool. Therefore, when trading long-term, the 14th period is not used, but a longer one is selected. The value of a longer period is determined depending on the trading instrument used and its characteristics. If the period is not changed, the signals will lag and their accuracy will drop sharply.
In practice, the signals from this indicator are reliable, which is why it has gained such popularity. But to make it more effective, you should use confirmation signals from third-party oscillators or any other indicators.
At its core, the momentum indicator shows only the further activity of market activity in terms of purchases and sales of currency assets. Its second purpose is to accurately determine market direction. The use of these two criteria is quite enough for experienced traders to determine the reliable places at which the market will be entered and the price levels at which the transaction will be closed.
To minimize risks and errors, you should use a moving average or other trend indicators.
Pulse compression indicator
It is often useful to combine different indicators so that their different aspects complement each other. An example of this is combining the Momentum indicator and volatility measurements to form a momentum compression indicator.
The Bollinger Band forms a corridor that widens during times of high volatility and narrows during low volatility. A band compression occurs when volatility declines to historically low levels. According to the theory, something significant will follow such periods.
However, the Bollinger Bands indicator does not indicate the direction of the breakout. The momentum compression strategy uses momentum as a means of measuring where the market is heading.
conclusions
What can I say, the Momentum indicator is an old forgotten classic of the genre. In fact, the tool is very interesting and many, it seems to me, undeservedly ignore it. The moment may well fit into any trading system, since it gives very high-quality signals, and the result can be an excellent trading system.
Debit card from Sberbank
Of course, there are certain nuances that require understanding, but much will come with time. The main thing is that you don’t need to rush things, let everything take its course. Focus on your learning process, strive to be a systematic trader and over time the result will definitely come.
I understand you, you really want the results to be quick and stunning, but, unfortunately, it just doesn’t work that way. Only your decisive actions and motivation will help you pass this path.