Hello, fellow Forex traders.
Let's face it - many of us are looking for “that grail”. Every time we download this or that indicator or strategy, a small hope glimmers in us: “what if?” If we recall “The Alchemist” by Coelho, then wealth is often worth looking for under your nose. In our case, right in the trading terminal.
Today we will talk about the classic MACD indicator: we will analyze its structure, identify the main tactics of use, including little-known ones, and try to understand what is the secret of the longevity (and it is almost 40 years old) of this instrument.
MACD indicator - secrets of use
Everyone knows that there are trend indicators, designed, in fact, to work in a trend, and there are oscillators that work best in a flat. The indicator we will talk about today is the MACD trend oscillator. The full name is the moving average convergence/divergence trading method (Moving Average Convergence/Divergence Trading Method), pronounced “MCD” and has nothing to do with McDonald’s.
History of origin
The MACD indicator shows us exactly what its name says - to what extent the moving averages on the chart have converged or diverged. This indicator was developed by the famous New York trader Gerald Appel in 1979 to analyze the stock market, and then, as often happens, it migrated to other financial markets, including Forex. The main reason the MACD indicator is so popular is that it does provide a lot of useful information about the market, while combining the properties of both a trend indicator and an oscillator. The author of the indicator, Gerald Appel, is also the author of several books, such as “Winning Marker System: 83 ways to beat the market”, “Stock market trading systems” “New directions in technical analysis” and others, and also published his own newsletter “Systems and Forecasts".
How to spot explosive price movements using MACD?
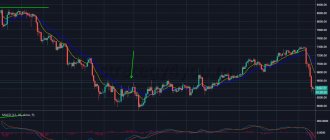
Explosive price movements usually occur after a period of low volatility, when the range of candles becomes denser and the candles themselves are small in size.
The MACD histogram will help us identify such periods in the market.
- The price reaches a structural area on the chart (horizontal level, trend line, moving average).
- The MACD histogram appears almost flat with no visible peaks or troughs.
- We open a position for a breakout when it occurs.
Here are some examples:
MACD indicator calculation
The MACD indicator uses as many as three moving averages in its calculations, although we see only two on the chart - the value of the long moving average is subtracted from the value of the shorter one, and then the difference is smoothed out again. Why so much smoothing? Why do you need to smooth anything at all? The answer is obvious - just look at the price charts. Sometimes “you can’t see the forest for the trees,” and, especially when prices are jittery from a lot of news, it’s difficult to trace the true trend and understand where the price is moving. Smoothing removes all these jerks and deceptive maneuvers, leaving only the general direction of prices. Well, the payment for smoothing is lagging signals. With trend trading, this is even good - all false movements and noise are eliminated, but with scalping, of course, it is unacceptable - before you are ready to enter, the time to exit will come. So, when constructing the MACD indicator, double smoothing is used, which guarantees that since the MACD has gone down, the trend is really changing.
The MACD indicator is drawn “in the basement” of the terminal, like all oscillators. The original indicator proposed by the author looked like two moving averages, the intersection of which gave signals for action:
Subsequently, one of the lines began to be depicted as a histogram (stripes or bars oscillating around the zero line). This is the modern look of the MACD indicator that you see in the terminal:
So, MACD simply calculates the difference between the fast and slow moving averages. When the MACD is above zero, it indicates that the fast moving average is higher than the slow moving average. When below zero, fast is lower than slow. Accordingly, a rise in MACD indicates a growing bullish trend, while a fall indicates a bearish trend.
Well, now let's take a look at the formula for calculating MACD. First of all, we need to prepare two exponential moving averages - long and short, and then find their difference:
MACD=EMA(CLOSE,PL)-EMA(CLOSE,PS), where
EMA – exponential moving average;
PL and PS – long and short periods of exponential moving average;
This is the line that you see as a histogram in the modern version of the MACD indicator. It's called the fast MACD line, back when it was still a line.
The next step is to calculate the signal line as a simple moving average from the difference of two exponential moving averages calculated above:
Signal=SMA(MACD,Pa), where
SMA – simple moving average;
Pa – period of the indicator signal line.
This is how we got that red line on the graph. It is called the slow MACD line or signal line.
Also often mentioned is the so-called MACD histogram. This is not the same as the MACD indicator itself described above. The histogram is the difference between the MACD value and the signal line, that is:
MACDHistogram = MACD – Signal:
I haven’t seen the use of the MACD histogram for a long time, and you won’t find it in the terminal either. But if you suddenly come across a MACD histogram somewhere in the literature on technical analysis, you will no longer confuse it with the MACD indicator.
How to set up the indicator
And although in most cases the settings are set by default in the MetaTrader4 terminal, they are universal, we need to understand what each of the parameters is responsible for.
Let's look at each parameter, what it affects and what range of values it makes sense to choose.
But first:
Where to find MACD in MetaTrader4
To install the indicator on a chart in MT4 to work with standard versions, there are several ways:
- open the “Insert” tab, then go to “Indicators”. In the list that appears, select “Oscillators” and click “MACD”. After this, a window opens to configure the algorithm.
- The second way is to drag the desired currency pair onto the chart from the “Navigator” window.
- Third, go to the toolbar, click the “List of Indicators” button, and select MACD from the drop-down list.
Timeframes
For MACD, the general rule for choosing a TF applies - the lower the period, the more noise and false signals.
Of course, the older the timeframe, the fewer signals there will be for entry.
That’s why everyone is looking for their own balance here. If you want to trade intraday, then use the TF up to H1; if, on the contrary, you have little time, then choose the TF H1 - H4 or D1.
Recommended MACD parameters
When setting up, four main parameters are taken into account:
- fast MA interval;
- slow MA interval;
- signal interval MA;
- at what price point to apply the calculation;
Moving average periods are usually set as follows:
- settlement price - closing price of the candle;
- EMA value - 12 and 26;
- SMA - 9.
Settings
The indicator has four parameters - the period of the slow moving average, the period of the fast moving average, the period of the signal moving average and the price for calculation.
As a rule, periods are taken as 12, 26 and 9, and the price for calculations is the closing of the candle. It was precisely these periods (12 and 26) that Appel himself recommended for those wishing to sell. For buyers, the author recommended using 8 and 17. But this applied to the stock market, and for other markets you can safely use standard periods or choose your own.
Divergence
Divergence with MACD is no different from that for Stochastic. The principle is absolutely the same. If the MACD goes up and the price goes down, then you need to listen to the MACD: the price will change and also go up.
Positive divergence (price up)
For example, in the figure below, we see that the price for the period highlighted by the arrow is falling, but the MACD, on the contrary, is tending upward. The indicator is right and sees the situation in advance - the price will go up. This is what happens.
Negative divergence (price down)
The same eggs, only in profile. The MACD is trending downwards and the price will soon follow.
Intersections
The moving average, as I already said, smoothes out the influence of random price fluctuations. The difference between the two moving averages smooths the price even more. As a result, this leads to the fact that MACD generates fewer false signals, but at the same time lags considerably. However, the MACD in a narrow range behaves much better than a simple crossover of two moving averages.
When applying this type of signal, purchases are taken when the MACD histogram crosses the signal line from the bottom up. For sales the opposite is true. This type of signal is taken when there is a good trend. For example, in a bearish trend, they enter into sales when the MACD indicator crosses the signal line from top to bottom, and exit the transaction when it crosses back. That is, entry into a trade often occurs just at the end of a rollback against the trend, and exit when there are signs of its beginning. The picture above shows an example of trading at the intersection of MACD and the signal line. The trend is determined according to the classical rules - we have a local maximum and a local minimum. When a new local maximum appeared below the previous one, there was an opportunity for a trend change. When the level of the previous low was broken, one could assume the emergence of a new bearish trend and begin to wait for sell signals using the MACD indicator. Before the high-low order broke (the new high ended up being higher than the previous one, signaling a possible change or end to the trend), we made 4 trades, three of which resulted in a decent profit and one a small loss.
How to properly use the MACD histogram to identify a reversal?
When I first started trading, I mostly traded breakouts. The larger the candles were, the more often I entered the market. However, the result of this strategy was constant losses. That's when I realized that my entry into the market was too late. I usually opened my trades, and after that the price immediately turned in the opposite direction.
Then I thought, “What if I do the opposite and take a position in the opposite direction of the current momentum?” As a result, my trading results became much better.
The MACD histogram can help us determine a strong impulse. Here's how it works:
- We wait until the price reaches a structural area on the chart (for example, a horizontal level, trend line, moving average).
- The MACD histogram should show strong momentum.
- On a price rebound, we open a position in the opposite direction.
Here's an example:
Oscillator
What is the logic of this indicator? MACD is the difference between two moving averages, fast and slow. A fast moving average characterizes a short-term trend, while a slow moving average characterizes a longer-term trend. The greater the divergence between these moving averages (the higher or lower the MACD histogram is above zero), the more bullish or bearish the market. There is such a thing as reversion to the mean. So, price fluctuations always return to their average price. In the case of the MACD indicator, price fluctuations (slightly smoothed) are represented by a fast moving average, and the actual price average is a slow one. Accordingly, the fast average always returns to the slow one, and the difference between these moving averages always returns to zero. Moreover, the further the averages diverge, the higher the histogram rises or falls, the greater the likelihood that convergence is about to begin, that is, the movement of the histogram will turn towards zero.
Therefore, the next type of signal from this indicator is the appearance of highs and lows, which are used in the same way as in the case of other oscillators. The only point is that MACD does not have predetermined overbought and oversold levels. The analysis is performed by eye. In the picture above, I visually determined the level of 0.0085 and plotted it on the chart. As you can see, crossing the overbought/oversold level in the opposite direction often serves as a turning point for the price, or at least the beginning of a correction. This does not always work with great accuracy, as, for example, when working with the upper level in the picture, but, nevertheless, this signal is much more reliable than that of many other oscillators. And in combination with levels, the accuracy or when working with a trend, the accuracy increases many times over.
By the way, if there is a trend, you can use the following trick, based on the lag of slow oscillators. I already talked about it in the article about the Stochastic Oscillator. The point is that after breaking through the overbought/oversold level in the event of a trend movement, the price may continue to move in the same direction for a long time, and the oscillator may dangle behind the levels. The picture above clearly shows a good uptrend. Entry into a purchase is carried out when the MACD indicator breaks a certain level, and exit from the transaction is carried out when the indicator simply crosses its signal line. Using pending orders will make entries even more accurate. The point here is that by raising the level above the zero line, we simply filter out minor price spikes. Our level is broken only by really strong movements, which we take.
Strengths and weaknesses of MACD
Among the advantages of the indicator, I would like to note:
- good filtering of price noise ;
- the ability to work both during a trend and during a flat ;
- can be used both as the basis of a vehicle and simply as a filter . For example, it can be added to a strategy solely to search for divergences that can act as a reason to close a trade.
disadvantages :
- Due to the fact that the price value is smoothed several times using moving averages, the signals are delayed . If the movement starts abruptly, then by the time the MACD gives an entry signal, it will be too late. The ratio between potential profit and loss will become too unfavorable;
- although it belongs to the oscillators in MT4, it does not have oversold/overbought levels , as in Stochastic. So using it as an oscillator is not entirely convenient.
But the disadvantages cannot be considered critical ; the advantages are much more significant. Do not forget that the trading result is influenced not only by the quality of the signals, but also by a number of secondary issues, for example, the choice of broker. I have already considered the question of where is the best place to open a brokerage account; beginners should familiarize themselves with this material. Here I will additionally provide a table with the conditions of major brokers.
| Company | Just2trade | United Traders | BKS | Tinkoff investments |
| Minimum deposit | From $100 | $300 | from 50,000 rub. | Unlimited, you can even buy 1 share, they recommend starting from RUB 30,000. |
| Commission per cycle (buy + sell trade) | 0.006 USD per share (min. 1.5 USD), 0.25 USD for each application. that is, per lap – $3.50 | “Beginner” tariff – $0.02 per share Average $4 per round | At the “Investor” tariff – 0.1% of the transaction amount, at the “Trader” tariff it is reduced to 0.015% | 0.3% for the “Investor” tariff |
| Additional charges | The ROX platform will cost at least $39/month. (for the American market), for an additional $34.50 they connect Canada/TSE, Level II On the over-the-counter market, the additional fee is 0.75% of the transaction volume (minimum $30), in the case of dividends - 3% from the issuer (minimum $3) | On the Day Trader tariff, they charge $60/month for the Aurora platform, free on other plans | If the account has less than 30,000 rubles - 300 rubles/month. for access to QUIK and 200 rub./month. for access to the mobile version of QUIK, | — |
| Account maintenance cost | $5/€5/350 rub. reduced by the amount of the commission paid | — | 0 RUR/ month on the “Investor” tariff. On other tariffs, funds are debited only if there was activity on the account this month | Free for the "Investor" tariff |
| Leverage | for Forex Up to 1 to 500 for stocks up to 1 to 20 (day) to 1 to 5 (night) | 1 to 20 on the Day Trader tariff, this is the maximum leverage (daily) | Calculated for each share, within the range of 1 to 2 – 1 to 5 | Calculated for different instruments, the calculation is linked to the risk rate |
| Margin call | -90% | Standard -30% of the deposit, in technical terms. support can be set -80% | Calculated based on the risk for each security | Depends on the asset |
| Trading terminals | MetaTrader5, ROX | Aurora, Sterling Trader, Fusion, Laser Trader, Volfix.Net, Pair Trader | My broker, QUIK, WebQUIK, mobile QUIK, MetaTrader5 | The purchase of shares is implemented like an online store, professional software is not used |
| Available markets for trading | Forex, American, European and other stock markets, cryptocurrency | American and other stock markets, more than 10,000 assets in total, cryptocurrency | Foreign exchange, stock, commodity markets, there is access to foreign exchanges | American and Russian stock markets |
| License | CySEC | Lightweight license from the Central Bank of the Russian Federation | TSB RF | TSB RF |
| Open an account | Open an account | Open an account | Open an account |
Position relative to the zero line
If there is a directional trend, it is very good to enter in its direction right at the peaks and troughs. But what if the direction of the trend is unclear, but the movements are very volatile, in a wide range? You just need to take into account the position of the indicator relative to the zero line. In the picture above, sell signals are taken when the MACD and the signal line cross above the zero level, and buy signals are taken below. That is, in essence, we combined the two approaches listed above - using MACD as an indicator and using crossovers. If you take all the signals in a row according to these rules, as in the figure above, then you can earn a decent number of points on such wide ranges. In the first transaction there were sales, in the second the closing of sales and, since we were below the zero line, the opening of purchases. At the third point, purchases are closed and sales are opened again. Moreover, such a simple trade would have brought us 16 transactions, two of which would have closed at approximately zero, and the rest would have brought a profit of around 4,500 old points.
You can go even further and plot a couple of levels above and below zero on the MACD chart to filter out minor fluctuations. In this case, you can take only those transactions for which the MACD previously broke through these levels when a signal appeared. That is, crossovers occurred above or below these levels or near them. In this case, we will use the oscillatory properties of MACD even more fully.
In general, the MACD can be used most effectively in such conditions – when the market is not in a specific trend and the range of fluctuations is quite large.
Improving the effectiveness of MACD signals
To increase the efficiency of using the indicator, additional tools are selected - filters, cutting off false signals.
Adding levels
The problem of the lack of clear boundaries of critical zones, in which the histogram is scaled incorrectly and allows for market analysis only visually, is solved by adding levels on the indicator scale.
In order to confirm the authenticity of the breakout, symmetrical levels are used, located above or below the zero line, with a range from 0.0005 to 0.1, taking into account the volatility of the asset.
Values above/below these levels can be interpreted as overbought/oversold.
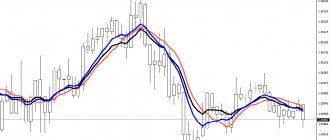
Adding a Moving Average filter
Moving Average is a trend indicator, calculated as the average price value for the selected period. On the chart, this is a curve that smoothly follows price movements.
Helps the trader determine the trend: after adding a moving average to the chart, they determine the position of the price and then mark the intersection of the line and the price.
If the price has risen above the moving average, then the trend is upward; if below, the trend is downward. The intersection of the moving price from bottom to top is a signal to buy, and from top to bottom - to sell.
RSI input filter
The RSI oscillator identifies overbought and oversold zones.
To configure, set the parameter for the period used in the calculations. Usually this value is 14, but to reduce the number of signals and increase accuracy, this parameter is increased to 21.
The main signal from the RSI is a break beyond the 80 and 20 levels, so if the signal from the MACD tells us to buy, then we check that the RSI is in the oversold zone, i.e. below level 20.
Signal filter using CCI
This is the simplest Forex strategy, used on time periods from a minute to an hour.
After adding the indicator to the chart, observe the behavior of trading signals: if the price has exceeded +100, it’s time to think about selling, if the price has dropped below -100, we buy.
Of course, the signal must coincide with the MACD.
How to determine the trend using MACD
After the indicator is added to the price chart, look at the Makdi histogram: if each bar is higher than the previous one, the trend is upward, if the bars are decreasing, then the trend is downward.
Determining the further short-term trend using the histogram bars
So, using the histogram bars, you can determine the continuation of the current short-term trend and even build a simple trading system based on this property of the indicator.
Very often, when a new peak appears, immediately after the MACD indicator crosses the zero mark, another higher peak appears. As a rule, after breaking through the first peak, the price continues to move or immediately reverses. If you place pending orders above the first candle where the MACD indicator broke through its previous high, you can get a quite profitable trading system.
conclusions
- MACD is an absolute price indicator that is not suitable for comparing two securities;
- Linear MASD is undoubtedly a trend (lagging) indicator. It is suitable for analyzing the trend and momentum of a stock price, since it receives its values from the chart;
- The MACD histogram can most likely be called an oscillator. More suitable for making trading decisions;
- Divergence is one of the most powerful signals in trading. The MACD represents it perfectly;
- Colored MACD, combo, with entry points - these and other modifications greatly simplify the trader’s work.
Friends, that's all. I am sure you will have questions that you can freely ask in the comments. And we have two more big topics on the MACD stock indicator: how to use it and divergence. Good luck and be successful!
Technical analysis figures
If you carefully examine the histogram drawn by the MACD indicator, you will notice that the figures on it work quite well.
The picture above clearly shows that when using the principle described in the previous paragraph, you can also successfully trade classic patterns, such as head and shoulders, double bottom. The picture above shows a double bottom of the MACD indicator. If the right shoulder is broken, you can place a pending order (to buy in this case) and enter at the very beginning of a new movement.
Indicators for scalping moving averages. Example of CFD trading on Oil Futures
- 11/27/14 16:25 opened on signals of moving averages crossing to sell ten lots.
- For CFDs on oil futures, the maintenance margin for 1 lot is $2,000, for 10 lots is $20,000.
- !!! Two hours and twenty-five minutes later at 11/27/14 6:50 p.m., the signal from the moving average scalping indicators changes, and we exit the market with a profit of 323 points. One point is equal to 10 dollars on one lot, and since we entered with 10 lots, our profit is 32,300 dollars. Which is 161.5% of the deposit amount. It turns out that scalping indicators, for example, moving averages, can help us make good money in a short period of time, depending on the chosen financial instrument.
Sharing with other indicators
Sharing indicators is always a good idea. Each indicator has its own strengths and weaknesses. The computer will allow you to plot as many indicators on your price chart as you want. Try to combine them. Oscillators work especially well in turbulent market environments and at important turning points when the trend loses momentum. During a strong upward trend in the market, oscillators can do more harm than good.
The signals generated by stochastic lines tend to appear too frequently and are unreliable when using only the stochastic. MACD crossovers are less frequent and more reliable (though usually slower). A way to increase the value of both indicators is to combine them. Why not, for example, use the trend-following characteristics of the MACD system as a stochastic filter? In other words, follow buy signals on stochastic crossovers only when the MACD lines have a positive projection.
You can also use the weekly MACD histogram as a filter for daily stochastic signals. You will use buy signals on the daily stochastic chart to enter the buy side only when the weekly MACD histogram is positive or rising. In such a bullish environment, you are better off ignoring short-term sell signals from the more sensitive stochastic system.
Overbought and oversold
The MACD indicator can also give overbought or oversold signals.
- The MACD is overbought when the MACD line travels a relatively large distance from the signal line. In such cases, we expect the bullish move to exhaust itself after a strong rally and the emergence of a bearish move.
- The MACD is oversold when the MACD line moves a significant bearish distance from the signal line. In this case, we expect the price to exhaust itself and enter a bullish phase.
In the green rectangle you see a case where the fast MACD line is at a relatively large distance from the red signal line. This indicates oversold conditions.
Advantages of MACD
One of the main advantages of MACD is that it includes elements of both momentum and trend in one indicator. As a trend-following indicator, it will not give false information for too long. The use of moving averages ensures that the indicator follows the movements of the market instrument. By using exponential moving averages instead of simple moving averages, it was possible to reduce the lag. Divergences in the MACD can be key factors in predicting trend changes. Negative divergences signal that bullish momentum is declining and a trend change from bullish to bearish is possible. This may serve as a warning sign for traders to lock in some profits in long positions or for aggressive traders to consider taking short positions.
Results
One thing that speaks in favor of MACD is that traders have been using it for more than 40 years in all types of markets . This proves the effectiveness of the algorithm. At the same time, I want to warn beginners. This is by no means a holy grail , just another effective tool to include in your arsenal. It will not give you 100% profitable signals, but it can increase the efficiency of your trading if you use its signals wisely.
I propose to consider this review complete. Don’t forget to subscribe to my blog updates, there are many more interesting materials awaiting you!
If you find an error in the text, please select a piece of text and press Ctrl+Enter. Thanks for helping my blog get better!
Disadvantages of MACD
One of the advantages of MACD can also be a disadvantage. Moving averages, whether simple, exponential or weighted, are lagging indicators. Even though the MACD represents the difference between two moving averages, there may still be some lag in the indicator itself. The MACD is not particularly good at identifying overbought and oversold levels. While it is possible to identify levels that historically represent overbought and oversold conditions, the MACD does not have any upper or lower limits limiting its movements. MACD may continue to move beyond historical extremes. MACD calculates the absolute, not relative, difference between two moving averages. It is calculated by subtracting one moving average from another. If a market instrument rises in price, then the difference (both positive and negative) between the two moving averages will increase. Therefore, it is difficult to compare MACD levels over a long period of time, especially for instruments that have risen exponentially.
Profit-generating MACD + ADX strategy
The MACD (Moving Average Convergence/Divergence) indicator is used to check the strength of a trend, possible trend direction and potential reversal points. The default settings of this indicator are 12, 26, 9. MACD is liked by many traders and hence is a widely used indicator due to its simplicity and clear signals about trade entry points.
The main purpose of the ADX indicator is to measure the trend. So, if you are looking for an indicator to see whether a trend is moving or exhausting, this is not the indicator that is suitable - it only shows whether the trend is strong or the market is consolidating.
The trend is strong and does not end if the indicator is above 25. On the contrary, if the indicator falls below 25, the trend is weak or the market is not trending, so it is better not to trade during this period.
ADX signals above 30 show a strong trend - this is by far the best time to enter the market.
Some traders prefer to use all three lines of the indicator: ADX itself, the + Di and -Di lines, considering the intersection of these lines as an additional signal of an impending decline and trend reversal. It is this exact interpretation of the ADX indicator that we will use when testing the adopted strategy on historical data.
In short, the MACD will detect a trend reversal for us, while the ADX will show whether the trend is strong or perhaps fading. This is a good combination.
MACD - ADX strategy - installation and description
Time interval (timeframe): 15 minutes and above (back tests are based on a 30-minute interval).
Currency pair: any.
Indicators:
- MACD (default settings 12, 26, 9);
- ADX (with default settings).
Stop Loss/Take Profit: Set SL/TP above/below the nearest swing top/bottom.
Entry rules for long positions:
- MACD is rising above the 0 line
- Signal confirmation: - line + DI of the ADX indicator, crosses the -DI line.
- The ADX line is also moving up.
A buy trade is opened on a candle where both conditions are met.
If one of the indicators gives a buy signal and the other does not, we do not open a deal and wait for two signals to appear in order to receive strong confirmation of the uptrend.
Entry rules for short positions:
- MACD falls below the 0 line.
- The signal is confirmed by the -DI line of the ADX indicator, crossing the +DI line and located above it
- The ADX line is also moving up
A sell trade is opened on a candle where both conditions are met.
If one of the indicators gives a sell signal and the other does not, we do not enter the market and wait for two signals to appear in order to receive strong confirmation of the downward trend.
Back testing results
| Market | Timeframe 1 | Timeframe 2 |
| Bullish | 589.45 pips | 390.55 pips |
| Bearish | 53.39 pips | 12.67 pips |
| Consolidation | 126.7 pips | 185 pips |
| Market | Timeframe 1 | Timeframe 2 |
| Bullish | 01/03/2011 – 22/04/2011 | 09/06/2010 – 02/07/2010 |
| Bearish | 01/01/15 – 19/02/2015 | 01/09/2014 – 17/09/2014 |
| Consolidation | 01/09/2016 – 29/10/2016 | 04/05/2015 – 21/05/2015 |
Time required to enter 50 transactions in timeframe 1 and 20 transactions in timeframe 2.
Reminder: To save you valuable time and effort, we have implemented a backtesting system where you make only 50 trades in 3 different types of markets (bullish, bearish and flat) and then again 20 trades in the same markets but in different periods. Then, using simple mathematical calculations, we can draw conclusions about the effectiveness or insignificance of the chosen strategy.
Look at the results of testing in bull markets. They look significant. However, it took almost two months to earn this amount. It took a little longer to complete the 50/20 trade during flat markets, perhaps because it is a trend-catching strategy. However, the results are still satisfactory.
Improving the strategy, selecting other parameters
There are several ways to read the ADX indicator, the author of the method indicates that if ADX exceeds the level of 20, then the trend will be stronger, and if ADX exceeds 30, the trend will become even stronger.
Some suggest entering the market when ADX is below the 20 line, so this provides an opportunity to capture the uptrend and not miss its start. The basic idea is that the more mature a trend is, the more likely it is to reverse; Other traders use all three lines of the indicator: ADX, +DI and -DI lines, seeing the crossing of these lines as an additional signal (), while some traders ignore these lines and trade directly on ADX.
In addition, it is worth mentioning several opinions that the intersection of the 20 line is not as important as the slope of the indicator and its direction. We cannot claim that these reviews are false or true, because, of course, each trader finds his own way to read popular indicators and adapt them to his needs. Again, the best way to find out is to check out any of these indicator settings and choose the ones that work best for you.
The strategy was tested in a program in Forex Tester with historical data included in the program.
To test the effectiveness of this (or other) strategy, you can.
Source of the MACD + ADX strategy - blog on the Forex Tester website
Rules for using Alligator
They are simple and thanks to their associative interpretation they are easy to remember:
- “If all the moving averages are intertwined, then the alligator’s mouth is closed and he is sleeping, and the longer he sleeps, the hungrier he becomes” - If the moving averages are close to each other, then the market is in a sideways trend and the longer the sideways trend lasts, the stronger the trend will be later.
- “If the sliders disperse and look up (down), then the alligator has woken up.” And the alligator’s prey is known - bears or bulls, depending on who stands against the growing trend.
- “After the alligator has eaten its fill of one food, it either goes back to sleep or looks for another food.” After the trend, either there will be a sideways trend, or the trend will turn in the other direction.
Another application of the Alligator is that since the moving averages are shifted in time, stops can be placed on them. Which one to bet on depends only on your trust in the indicator and riskiness. Green is a conservative view; you definitely won’t lose much, but you’re also unlikely to gain anything. Red indicates balance, blue indicates risky.
Conclusions:
- A good indicator for determining the trend, but it cannot be used purely (other Williams indicators such as AC and Fractal fit very well)
- Suitable for setting stops, but risk management must be taken into account here
Technical analysis indicators are good because they can be used to automate trading. The MACD Indicator trading robot works according to the principles described in this article.