Technical indicators are indispensable tools in trading. Based on them, trading strategies are developed and market movements are analyzed. Almost every trader uses 2 or more technical indicators in his methodology. When forecasting changes in market quotes, experts use a wide variety of tools in their analysis, allowing them to study the market as accurately as possible and predict its further possible movement.
All technical indicators have their own characteristics, features, purpose and parameters. Some are used in calm markets for forecasting and trading, while others are used only during strong impulses and trends. A special role is played by tools that show volumes, for example, the Volume indicator. This is exactly what we will talk about in our article. We will talk about its characteristics, features, varieties, as well as how it can be used in trading and for analyzing the financial market.
Description of the Volume indicator
You may be interested in:Taxes in Dubai for individuals and legal entities. Taxation in the United Arab Emirates
You may be interested in: OS modernization: step-by-step design instructions and example
This tool is available on all popular trading platforms. For example, on MetaTrader it is installed by default at the very bottom of the chart and is displayed as a histogram. If a trader changes the timeframe, the indicator values will also change, but it will still be displayed at the bottom of the chart.
The histogram bars have different sizes. The higher they are, the greater the interest (demand and supply) of market participants. Using this tool you can track transaction volumes. When the histogram bars decrease in size, this means that the interest of players has decreased and the volume of positions in the financial market has decreased.
According to technical characteristics, the Volume indicator is an oscillator. Therefore, it has all the advantages, disadvantages and features of this class of trading instruments. It independently performs calculations and generates results directly onto the chart.
In trading, there are 5 types of oscillators based on functionality, which measure:
- Impulses and trend.
- Market volatility.
- Speed within the price range.
- Cycles and their length.
- Volumes.
You may be interested in: Concept and main types of accounts payable
The Volume indicator refers to an oscillator that measures the volume of positions in the market.
Volume trading strategies - vsa analysis
VSA works in all markets, if there is price and volume, the market can be interpreted.
The problem with any volume indicator: is the volume reliable? Even if it's not the same as in the Forex market, VSA still provides a glimpse into what professional traders do.
VSA as a volume Forex strategy is difficult to understand. VSA starts with two basic concepts: no demand and no pressure to sell.
When price rises but volume and spreads decline (spread = candle range), there is no demand. And if there is no demand, then eventually the market will fall. Therefore, these are bears.
In comparison with the classic mt4 volume indicator, VSA is more similar to Japanese candlestick methods. At the end of the day, Japanese candlestick techniques deal with candlestick ranges (spreads/shadows) and primarily show reversal conditions.
VSA is an interesting theory. For example, if the market is falling, it does not mean that it is bearish.
If the decline comes with a lower spread and volume, the market is actually bullish. Buyers calmly enter the market.
When this happens, the bar is said to have no pressure exerted. Consequently, the market is preparing to jump.
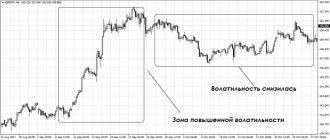
Above is the EUR/USD chart. This shows that there is no pressure to sell.
To make this happen, traders look for the following:
- The volume is less than the last two candles.
- Spreads are narrowing.
- The price closes below the previous candle.
Decreasing volume coupled with narrowing spreads suggests the market is preparing to jump. And so it happened.
Powerful volume trading strategies like this one show the ideal conditions for entering the market. Right before the breakthrough.
Obviously, in the absence of demand on rising bars, the conditions are opposite.
Classification and types
Trading volumes in the financial market are very important indicators. They allow traders to track the positions of major players and open trades at the most favorable moments.
Classification of volumetric indicators:
In principle, there are only two types of volume indicators: for obtaining values and their changes inside a candle, that is, a horizontal view, and for determining the volume of oppositions in any period of time. Tick volumes are used only in Forex and binary options. They show how many positions are traded in the required time range.
Types of volume tools:
Additional volume indicators on Forex
Volume indicator Chaikin Money Flow Indicator (CMF)
The indicator is calculated by summing the volume indicator for n periods (most often n is 21 periods) and then dividing by the sum of the volumes for the same period. It works on the assumption that a strong market, with a simultaneous increase in volume, will usually be accompanied by closing prices above half of the daily price range and vice versa - when the market is weak, closing prices will fluctuate below half of the daily price range with increasing volume.
The indicator can be interpreted in two ways. The first is based on confirmation of the price breakout of the resistance level by positive indicator values (see chart below):
And upon confirmation of the price breakdown of the support level with negative indicator values:
The second way is to look for discrepancies (divergence) between the price chart and the indicator. For example, despite the downward trend, the indicator value is growing, which means you need to look for buy deals. For sales - vice versa (see figure with types of divergences)
Chaikin indicator - CHAIKIN VOLATILITY (ChV)
The Chaikin volatility indicator measures the difference between the minimum and maximum prices over the period under study. The Chaikin volatility indicator (CHAIKIN VOLATILITY) can be interpreted in two ways.
One method of interpreting this indicator assumes that peaks on the chart are accompanied by high amplitude fluctuations (high indicator values). The achievement of the bottom (minimum) is signaled by low indicator values, due to a decrease in the range of fluctuations.
As you can see in the example above, the indicator reached its maximum point (A), confirming the breakout of the horizontal level (B), which confirmed the formation of an uptrend.
When analyzing the indicator, we also look for a discrepancy (divergence) between its chart and the price chart, additionally supported by a breakthrough of the equilibrium level (0). Bullish divergences indicate rising prices due to stockpiling, while bearish divergences indicate falling prices.
EASE OF MOVEMENT (EMV)
The EMV indicator is a function of price and volume and helps identify and confirm the start of longer term trends. A buy signal is generated when the indicator chart breaks the zero line from below (green arrow), and a sell signal is generated when the indicator chart breaks the zero line from above (red arrow).
Volume indicator NEGATIVE VOLUME INDEX (NVI)
The Negative Volume Index - NVI - by Norman Fosback was first described in 1976 in a book by the same author called “The Logic of the Stock Market.” This indicator includes quotes whose volume is lower than in the previous time period.
According to the author, this indicator is useful for experienced traders who “quietly” open positions when volume is low and the formation of price patterns is uncertain. Because of this, they wait for other, less experienced investors to open positions in the market after a visible trend has formed. Although this indicator is the opposite of the PVI indicator, its rise means that the market's uptrend is continuing, and similarly, its fall can mean the formation of a downtrend.
Graphically, the indicator is an NVI chart (blue line) with an annual exponential average (green line) and a shorter exponential average (orange line). A buy signal (green marker) is generated when the annual exponential average line crosses upward from the shorter exponential average, and a sell signal (red marker) is generated when the annual exponential average line crosses the shorter exponential average.
The NVI index is most often used in conjunction with the PVI index.
Volume indicator POSITIVE VOLUME INDEX (PVI)
The Positive Volume Index (PVI) by Norman Fosback was first described in 1976 in a book by the same author called “The Logic of the Stock Market.” This indicator includes quotes whose volume is greater than in the previous time period.
According to the author, this indicator informs that a group of less experienced investors is taking positions in the market (which is accompanied by an increase in volume). Although it is an inverse indicator of NVI, its rise means the market is in an uptrend and similarly, its decline can indicate a downtrend.
Graphically, the indicator is a graph of PVI (blue line) with an annual exponential average (green line) and its shorter exponential average (orange line). A buy signal (green marker) is generated when the annual exponential average line crosses upward from the shorter exponential average, and a sell signal (red marker) is generated when the annual exponential average line crosses the shorter exponential average.
The PVI index is most often used together with the NVI index. In the example above, we have an illustrated situation where these two indicators work together to give a strong double sell signal (red marks).
Volume indicator PRICE AND VOLUME TREND (PVT)
The Price and Volume Trend indicator is very similar to the OBV indicator and, like it, measures the volume of capital flows (the number of transactions entered into). However, in the case of the PVT indicator, the amount of volume added or subtracted depends on the percentage change in price compared to the previous period. This factor makes the PVT indicator readings more accurate than the OBV indicator readings.
Interpretation of the PVT indicator consists of comparing the indicator chart with the price chart and looking for slower growth/decline of the indicator in an up/downward trend. A weakening of the indicator's growth during an upward trend on the price chart may indicate a possible downward trend, and vice versa, a slowdown in the indicator's decline when the price on the chart decreases may be a harbinger of a breakout of the downward trend. A clearer signal of a trend change is the occurrence of divergence - a discrepancy between the indicator line (A) and the price line (B). An example of such divergence is presented in the chart above.
Volume indicator VOLUME RATE OF CHANGE (VROC)
The VROC indicator is mathematically identical to the ROC indicator, however the former is based on volume rather than closing prices and measures the rate of change in turnover.
The main assumption of the indicator is that turning points on the chart (extremes - peaks and troughs) or breakouts that precede intense movement are accompanied by a sharp jump in volume. Therefore, a rapid and sharp increase in the indicator, accompanying, for example, a breakout of a level, is a signal confirming the truth of the breakout.
Functions of a technical tool
The Market Volume indicator performs one of the main functions in trading on the financial market. Depending on its purpose and use by the trader, it performs the following functions:
Using this tool, you can obtain information about the market situation: what is happening on it at the moment, what changes may occur in the future, the interest of players in a certain time period and the opening of transactions by large market participants.
You may be interested in:Credit account: definition, meaning, how to open or close a credit account
In trading, the volume indicator is quite widely used by traders. Based on it, many trading strategies have been developed that allow them to make stable money in the financial market.
Money management
Money management, it is commonly believed, is carried out consciously more by trading professionals who have already become accustomed to the market and consciously approach receiving a stable income. But if you are just starting to work with options, this does not mean that it is too early for you to think about money management; on the contrary, the sooner you know about it, the better for you and your results. So, money management is an effective, well-thought-out strategy for managing an account and personal finances, which solves such issues as correct work with a deposit, how to save and increase funds on it. The basic rules of money management will make your trading profitable:
Trade with a minimum of funds : learn to spend a minimum of money on trading; You should bet no more than 5% of the account amount on the option; participate in options whose price is less than the amount of funds in the account; Find a reliable broker that guarantees better performance and profitability. Follow this strategy and you can easily save your funds on deposit.
Transfer a minimum amount of funds to a deposit : learn to work with a minimum amount in your account; You should not put your entire deposit on the auction, because you will need the funds to win back; start working with your deposit by selecting a free limit from the amount that you can implement in trading and do not go beyond it. Follow this strategy and you will easily save capital.
Trade with a minimum of assets : learn to gradually increase the complexity of your work in options; You should start trading with 2-3 assets, when you feel more confident, increase the number of assets. The advantage of this approach: you will be able to keep the whole situation under control, because the more assets you put into work, the greater the load on your account and the more difficult it is to monitor its condition. Follow this strategy, and you will easily organize effective work from the first steps in trading.
Trade without emotions : learn to properly tune in to serious work. It is worth remembering that the mood in this case decides a lot, including the success of trading. Excessive emotions make it difficult to concentrate and make correct predictions. When starting your next trade, get ready for serious work that requires analytics and informed decisions. Follow this strategy and you will be able to develop a conscious attitude towards trading that will bring you good income.
Indicator settings and parameters
From the description of the Volumes indicator, which is a standard tool on many well-known trading platforms and is installed for free, you can understand that this tool practically does not need any settings. To attach it to the chart, you just need to make a couple of clicks, that is, select it in the “Tools” and click the “ok” button.
The developers recommend leaving the original settings. The only thing that can be changed at the trader’s discretion is the color scheme of the histogram display and the line thickness. It does not require any additional testing.
Typically, the Volumes indicator has two colors: red and green. If it has more columns of the first option, it means that the market price decreased more often, and if green is superior, it increased. This indicator is installed in a separate window under the chart and does not interfere at all with analyzing market quotes.
Volume indicators in Forex
The first four volume indicators described below are the main ones and are available in the MetaTrader4 (MT4) terminal in the top menu “Insert” - “Indicators” - “Volumes”
ON BALANCE VOLUME (OBV) indicator
As the name suggests, On Balance Volume takes into account volume, so while it can be used in the Forex market, it is better used in markets where actual volume is available, such as futures or stocks trading. On Balance Volume is one of the four main volume indicators, along with Money Flow Index, Volumes and Accumulation/Distribution.
Structure and logic of operation of the OBV volume indicator
One of the basic assumptions of technical analysis is that changes in volume confirm trading signals of a trend change.
The OBV indicator shows the proportions between capital entering and leaving the market. The operation of the indicator can be represented by simple formulas:
- if C (x) > C (x-1) then OBV (x) = OBV (x-1) + V
- in turn, if C (x) < C (x-1) then OBV (x) = OBV (x – 1) – V
- and while C(x) = C(x-1), OBV(x) = OBV(x-1)
In formulas:
- C (x) - current closing price,
- C (x-1) — closing price of the previous period,
- V-volume
Thus, when the price of an instrument increases compared to the previous period's closing price, volume is added to the indicator value, and when the instrument price decreases compared to the previous period's closing price, trading volume is subtracted from the indicator value.
Using the on Balance Volume indicator
Using the on Balance Volume indicator is very simple and consists of searching for divergence between its chart and price. An increase in the indicator value with a simultaneous decrease in the price (bullish divergence) is a signal of the end of the downward trend and a search for an entry into purchases, and a fall in the indicator chart with an increase in the price chart (bearish divergence) is a signal to open short positions.
OBV is often used as an auxiliary indicator that complements the signals of other indicators. Its modified and improved version is the A/D (Accumulation/Distribution) indicator.
Pros of OBV
- Ease of use
- Relatively clear trading signals
- Ability to link the indicator to a broader strategy
Cons of OBV
- A small number of signals
Accumulation/Distribution (AD) indicator
The Accumulation / Distribution (AD) technical analysis indicator, available by default in MetaTrader 4 (MetaTrader 5), is one of four volume indicators, along with the Money Flow Index, Volumes and On Balance Volume tools.
The purpose of the AD indicator is to inform about changes in capital present in a given market - accumulation (i.e., an increase in the capital used) and its distribution (i.e., a decrease in the amount of funds used). Thus, the Accumulation/Distribution (AD) indicator is an oscillator that measures the size of cash flows affecting the market and flowing out of the market. Thus, it performs the same function as the Money Flow Index or On Balance Volume (OBV) and is actually an extension of the OBV indicator.
Compared to the Volumes indicator, Accumulation/Distribution is used relatively rarely. However, this does not mean that it should be abandoned in advance. This indicator is, from a mathematical point of view, much more advanced than a simple bar chart showing the amount of capital employed. Like any volume indicator, AD is good to use in markets where real (actual) volume is available - then its readings will be more accurate. For this reason, the AD indicator works best in the Stock Market or when trading futures contracts. However, this does not mean that the Accumulation/Distribution indicator cannot be used in Forex.
How does the AD indicator work?
The indicator's operation is described by the following formula:
AD (x) = [(C (x) – L (x)) – (H (x) – C (x))] / (H (x) – L (x)) * V (x) + AD ( x-1)
In the formula:
- AD (x) — current indicator value,
- AD (x-1) — indicator value for the previous period,
- C (x) - current closing price,
- L (x) - current reserve price,
- H (x) - current price. maximum,
- V (x) is the current transaction volume.
The assumption behind this technical analysis indicator is that the prevailing trend is more defined the greater the accompanying volume - decreasing volume should be a signal of which side of the market is dominant (buyers in the case of an uptrend and sellers if there is a trend is currently decreasing).
Using the AD Accumulation/Distribution Indicator
The use of the accumulation/distribution indicator is the same as for On Balance Volume. The application is to detect divergence - a discrepancy between the indicator and the price on the chart. A buy signal when analyzing a chart using the AD indicator appears when there is a bullish divergence, i.e. the price of the instrument is still falling, but the indicator is already signaling the beginning of growth. A sell signal appears when a bearish divergence appears, i.e. the price of the instrument is still growing, and the indicator is already pointing south. (see figure with types of divergences). The disadvantage of such trading signals is their relatively rare occurrence.
The volume indicators AD, OBV and MFI are relatively similar to each other, so it is difficult to determine which one is better to use. This is a matter of the trader's sympathies and personal beliefs. It is certainly worth checking each of these indicators in your trading strategies and making the right choice based on your experience.
Pros of Accumulation/Distribution
- Ease of use
- Relatively clear trading signals
- Ability to use the indicator in any trading strategy
Cons of Accumulation/Distribution
- A small number of signals
MONEY FLOW INDEX (MFI) indicator
MFI or Money Flow Index is an oscillator that measures the volume of capital inflows and outflows, available in MetaTrader 4 (MetaTrader 5). The indicator is presented in the form of a graph that fluctuates between values 0 and 100. In its structure, MFI is similar to RSI, however, unlike it, it takes into account volume.
If the indicator grows, then this can be interpreted as a sign of capital inflow, and if it falls, it is a signal of capital outflow.
The MFI indicator can be used to measure the overbought and oversold status of a currency pair in Forex. The indicator above the overbought level (80) shows that the market is overbought (overvalued), and when the indicator is below the oversold level (20) - this is information about oversold (undervalued). Sell signals (red markers) appear when the indicator chart line crosses the overbought level (80), and buy signals (green markers) appear when the indicator chart crosses the oversold line (20) - see the chart above.
Another way to interpret the indicator is to look for divergence to predict a change in trend (see chart above).
The graph shows that the bullish trend of the instrument (A) is not confirmed by the MFI indicator, which has already reached the overbought level and is moving in a downtrend (B). This observation is confirmed by the instrument's short-term change in trend to bearish (C). After the MFI chart reaches the oversold level (D), another divergence appears - a new upward trend of the indicator (E), despite the continued downward price trend in the chart (C). The second time, the indicator signals turned out to be prophetic, and the downward trend changed to an upward one (F).
The combination of divergence and reaching overbought/oversold levels is a strong sell/buy signal.
The indicator is discussed in more detail in a separate article Money flow index - how to use the volume indicator on Forex?
Volume indicator
The Volumes indicator is used by investors trading all types of markets - Forex currencies, stocks, commodities: traders working with derivatives such as futures or options; those who invest in bonds, etc.
Construction and logic of the Volumes indicator
Volumes shows how investor participation in a given financial instrument is changing. A decrease in the indicator values indicates less “struggle”, which means an outflow of capital from the market, and an increase in the indicator indicates a greater “struggle”, that is, an inflow of capital.
The Volumes indicator is a histogram located in a separate chart window, with bars of two colors: red and green. The Volumes indicator on Forex shows volume as the number of price changes in a given direction (tick volume). For example, if over a certain period of time the price increased several times more than it decreased, then the indicator will draw a green bar, and the more the buyers' advantage increased, the higher the bar will be. The situation is similar for the red bars.
Using the Volumes indicator
The Volumes indicator is never used separately, but only as a confirmation of other trading signals. Using the Volumes indicator, traders can determine the trend and future direction of movement by analyzing which direction the price has moved more often during the last period.
Pros of Volumes
- Shows the market situation
- Very useful in pricing based strategies
- Reacts to market changes in almost real time
Cons of Volumes
- Possibility of effective use only in combination with other technical analysis tools
Description of Better Volume
This trading tool is a custom technical indicator. All values in it are presented in the form of a histogram, which completely coincides with the Volumes indicators. The Better Volume indicator is an improved version of the standard tool.
Advantages of the indicator:
Experts recognized this tool as the best for determining vertical volumes.
Advantages and disadvantages of the Volumes indicator
Volumes is definitely a useful tool:
- anticipates price changes, predicting future market movements;
- allows you to determine the correct direction of price movement;
- may confirm a trend;
- indicate a market reversal;
- simple and easy to use.
Flaws:
- does not always detect significant price changes;
- prone to sharp jumps on short time frames;
- is influenced by technical factors: the opening of large exchanges is always accompanied by an increase in volumes.
To obtain more reliable results, it is worth modifying it “for yourself”: customize it in accordance with your strategy, test it for compatibility with it and use it in combination with other tools, for example the Bollinger Band indicator.
Indicator explanation
Since it is displayed on a graph, more precisely, in a separate window in the form of a histogram, the bars have the following meanings:
- Red color. Appears after large volumes. If a signal is formed at a peak, it may indicate a change in trend or momentum, as well as a correction. They are shown especially well by the Better Volume 1 5 indicator with a period of 15.
- Yellow. It is an auxiliary signal, usually formed at the end of a correction or impulse. It indicates their completion and informs the trader that at this time there are no people willing to make any purchases or sales on the market.
- Green color. This is a reversal signal. It usually signals the exit of large players from the market and is a powerful indicator. He informs the trader that large participants have begun to fix their profits and are leaving the market, transferring it to smaller players.
- Blue. A neutral signal that means practically nothing. It shows changes in ticks.
- Brown color. Formed upon completion of a downward direction. It can usually be seen after large volumes. If this signal appears at the end of an upward movement, then it should be ignored.
In addition to the color marking of the histogram, the indicator has the MAPeriod parameter, which shows the period value for the moving average. You can install it yourself. This line is also displayed in the indicator window below the chart. Its function is to indicate the significance of the volume and the probability of the truthfulness of the histogram signals. If it is above the bars, then the value of the technical instrument is greater than the average, below it is less.
How to apply this information in trading
For convenience, I will divide the use of horizontal and vertical volumes into 2 separate sections, but this does not mean that they should be used separately in trading. You can combine both types of indicators.
Working with the standard Volumes indicator
You can trade using Better Volume signals; in this case, focus on the color of the histogram column, as well as the configuration of the candle on the chart. But the standard Volumes indicator, which displays tick data rather than real market volume, can work quite well.
In any material about VSA, you will come across phrases such as “ significant or large volume.” At the same time, in the window with a histogram there are no criteria that would help rank the data and determine which column of the histogram can be considered large and which is within the normal range.
I recommend applying the level/levels to the indicator yourself . To do this, reduce the scale and draw a horizontal line on the histogram by eye so that most of the columns are under it. This way we will cut off truly significant price fluctuations from ordinary price noise.
When working, pay attention to:
- formation of candles with a small range and large volumes . Major players are exiting the market, so a reversal may be in preparation;
- large volumes at the peak of the trend during which the price failed to move in the direction of the trend. In the example in the screenshot below, the bulls’ attempt to move the chart higher failed, the bears repelled the attack, and the large volume indicates that they are serious about defending this level. The next black candle with a large range and the same value on Volumes confirms this conclusion;
- you can try using Volumes like criterion for the truth of level breakdown. If the breakout is not false, then the indicator should show a sharp increase in the histogram. This criterion can be used, for example, when the chart exits a flat or when trend lines break out.
I recommend combining volumetric indicators with other market analysis techniques and indicators.
For example, if we add MACD to the situation discussed in the screenshot above, we will see that shortly before the breakout there was a divergence in MACD , which increases the likelihood that the breakout is true. I told you more about how to use the MACD indicator earlier.
Using Horizontal Volumes
They are used mainly to determine the POC (point of control) - a straight line is drawn through the maximum value of the histogram and we get the level . As a rule, such levels are always worked out. Not exactly to the point, the price may not reach it a little, cast beyond it, but it still stops there.
As an option, when working intraday, you can build several ROS and trade on a pullback or a breakout of the resulting horizontal channels. The levels are worked out even if a gap appears on the market, the price will still take into account the position of the ROS - the key levels for large players. Read more about what GEP is in a separate article.
Now a small example of using volumes in intraday work :
- add any horizontal volume indicator ;
- now we need to identify range, in which the price moves. We get channel, in which the graph moves most of the time;
- You can trade both on the breakdown of its borders and on the rebound from them. If you don’t be greedy and set a goal at the POC level when rebounding from the channel boundaries, then the percentage of completed trades will increase .
As when trading on a rebound from standard support/resistance levels, I recommend taking into account reversal candlestick patterns , this is an important element in understanding what is happening in the market. The article about analyzing combinations of Japanese candlesticks examines this issue in detail , I recommend that you read it.
Don’t forget that it’s easy to work with such a tool as horizontal/vertical volume using history; you can justify any entry into the market without any problems. The real difficulties begin when you need to predict the behavior of the chart in the near future and determine whether the support/resistance breakdown is true. constant practice can help with this .
Description of Volume Profile
Along with vertical volumes, horizontal indicators are widely used in trading. The Volume Profile indicator allows you to analyze price levels and find out what the current market situation is between buyers and sellers. Horizontal volumes are one of the important parameters for predicting market movements.
Once attached to a chart, Volume Profile displays its values directly on market prices. It is depicted as a horizontal histogram for each level. The larger the volumes, the longer the indicator bar. Using this tool, traders determine the balance between placed buy and sell positions.
Expiration
Like money management, this is one of the basic concepts of trading. Expiration (from English Expiration, “expiration, end”) is the moment when the option period ends and trading participants find out how correct their forecasts were and whether their funds on deposit will be replenished. Expiration is what affects the performance of your trades. If you want your trading to bring you stable profits, be conscious about expiration.
Types of options:
- Ultra-short options (express) - 60 seconds - 5 minutes.
- Short-term options – 15 minutes – several hours.
- Medium-term options – from 6 hours to a day.
- Long-term options – one day – several months.
Is it possible to extend the expiration of options?
You can extend the expiration if suddenly during trading you realize that you have chosen the wrong forecast. Not every broker allows you to extend expiration, remember this.
Expiration rules:
- If you are new to binary options, you should first use long expiration, which minimizes the risks of quick expiration.
- If you are a trading professional with good trading experience, you should think about reducing your risks and choose your broker carefully. Choose brokers that allow increased expiration during trading, which will prevent loss of funds in case of an incorrect forecast.
- If you want to get quick income, you should choose short-term (minute - several hours) expiration, which can give you earnings in just a minute. Don’t forget, express expiration is always unpredictable and thus resembles a lottery.
- If you want to get a stable income, you should choose long-term expiration, which can bring you a decent income.
Expiration in Volumes strategies
Strategy for trading by volume levels
- Short-term trading : allowed; you can get a good income if the forecast is correct; Be careful, expiration has a high degree of risk.
- Recommended expiration : from 30 minutes to several hours; you can better study the market situation, use technical analysis and make the right decision.
- Long-term expiration : also allowed; you can apply the entire complex of your knowledge in order to make the correct forecast and get a good income.
Strategy for trading at high volume levels
- Short-term trading : allowed; will bring good income; Be careful, expiration is unpredictably reminiscent of a lottery.
- Recommended expiration : from 30 minutes to several hours; you can study the dynamics of the trend and the behavior of market participants, study the signals of oscillators.
- Long-term expiration : also allowed; you can use advanced features to make the right decision (strategies, oscillators, external situation affecting market dynamics: news, economy).
Strategy for trading on a breakdown of the middle line
- Short-term trading : allowed, you can get a good income if the forecast is correct; Be aware of the risks and unpredictability of this type of expiration.
- Recommended expiration : from 30 minutes to several hours; you can use data from other oscillators and see quality signals that will bring you good income.
- Long-term expiration : also allowed; you can receive high-quality signals, confirm them with indicators and macroeconomic data.
Strategy “Market Facilitation Index (MFI) + Volume”
The strategy is very simple, suitable for novice traders, and is capable of producing leading signals. You will be able to identify moments of high-quality entry into the market and make decent money on it. You will need MFI (Market Facilitation Index) and Volume indicators. Volumes will make a price forecast; The MFI oscillator will allow you to find entry points and analyze the current market. Its growth will signal a decrease or increase in volume. Terms of a purchase deal: MFI turns blue, growth of at least 20%; the current candle and the volume candle are red. Conditions of the sale transaction: MFI changes color to blue, growth of at least 20%; the price light and volume candle are blue.
- Short-term trading : not allowed, difficult to track the necessary signals, high risks of losing funds.
- Recommended expiration : from 15 minutes to 30 minutes; you can study the behavior of the main market forces, see quality signals and their confirmation.
- Long-term expiration : also allowed; you can get high-quality signals, confirm them with indicators, other reasons, and get a decent income.
Strategy “Parabolic SAR + Moving Average + Volumes”
An interesting strategy for searching for signals to enter the market. You will need Parabolic SAR, Moving Average (SMA, EMA with a period of 5), Volumes indicators. In this strategy, Volumes are used as a confirmation signal to enter the market. The Parabolic SAR signal will be the main one for entering the market, and the breaking of the moving average by the histogram of the Volumes indicator will be a confirmation signal. Opening buy positions: Parabolic SAR is below the price, Volumes will break through the EMA. Opening sell positions: Parabolic is above the price, Volumes will break through the SMA.
- Short-term trading : not allowed, difficult to track the necessary signals, high risks of losing funds.
- Recommended expiration : from 4 hours to one day; you can study the behavior of the main market forces, see quality signals and their confirmation.
- Long-term expiration : also allowed; you can get high-quality signals, confirm them with indicators, other reasons, and get a decent income.
To test all the possibilities and profitability of expiration in practice, we recommend using the convenient platform of the reliable broker Finmax. To do this, you just need to go to finmaxbo.com. Among the advantages of the terminal: a modern platform that meets modern trading trends, the possibility of a wide choice of expirations, from 30 seconds to six months, ease of use on the platform, and advanced tools for the trader.
Description of Volumes Divergence
One of the most favorite phenomena for traders in the financial market is divergence. To determine it in trading, a special tool was developed - the Volumes Divergence technical indicator.
You may be interested in: Indicators without lag and redrawing: types, operating principle, pros and cons of application, expert advice
With its help, you can calculate the interest of market participants in a particular asset during a certain time period. Volumes Divergence shows the difference in directions between market quotes and the histogram values of the volume indicator.
Important patterns in market dynamics
Strong market movements occur when the balance between supply and demand shifts under the pressure of technical, economic and other market factors.
Volume data can reflect the strength of market movement, or its weakening. A strong market impulse arises due to increased interest in the market on the part of professional players and is accompanied by an increase in the mass of tick trading volumes, while their decrease means a weakening of such interest, an equalization of the balance between supply and demand and is marked by the market entering a flat.
Theoretically, there should be a coincidence in the volumes of demand and supply, otherwise it becomes impossible to execute market orders due to the lack of counterparties. The higher the demand, the faster the execution of orders at low prices will be while the volume of purchase transactions increases, that is, the market will receive a bullish impulse.
As the quantity of supply at current prices increases, the market begins to move toward a conditional equilibrium point, which is overcome when supply begins to dominate demand. The result of this is an increase in supply volumes, that is, sales and increased bearish sentiment in the market.
Application area
All volume indicators are used to quantify positions at a price level or per unit of time. Special trading strategies have been developed based on horizontal and vertical volumes.
These technical instruments, based on their indicators, determine trading signals for entering and exiting the market. They are widely used during trading and for analytical forecasting of market movements.
In addition, volume indicators can be used in trading as filters to filter out false signals for other instruments.
How to Use the Volume Indicator in MT4
Traders use the information provided by the Forex volumes indicator. It shows potential interest at certain times.
The standard interpretation is to analyze the trend with a volume indicator. In reality, traders analyze overall market activity, not just the trend.
For example, one of the best volume trading strategies considers a fall in volume as the price rises. This is a sign of weak trends. Thus, traders see that the trend is fading and try to take a sell position.
How else to use Forex volume? Another way is to look for bars that stand out from the crowd, or if they are very different from others.
This is a sign of something happening. The mt4 volume indicator can determine the beginning of a trend.
Look at the image below - it is a perfect example for the EUR/USD pair.
The Forex volume indicator registers "unusual activity" when compared to other bars. This is a sign of high demand.
Therefore, it is not surprising that a strong trend has begun. This simple volume trading strategy is sometimes enough to put you on the right side of the market.
Using Volume in trading on the financial market
The Volume indicator is used in trading as a tool that confirms and determines the seriousness of the intentions of market quotes. If prices are characterized by high volumes, then the continuation of such a movement will have a much greater chance than with low values.
In situations where the market price has made a sharp leap in one direction, but its volume indicators are small, this jump should be regarded as an accident. That is, such a phenomenon has the lowest probability of continuation of the direction. Therefore, in trading, Volume is used as a tool for confirming trading signals, candlestick patterns, technical analysis figures and divergence.
For example, the “Head and Shoulders” graphic figure is always accompanied by large volume values, which determines a high degree of probability of its triggering. In this situation, Volume acts as a confirmatory signal for a reversal of market movement.
In candlestick analysis, it is also used as a filter to filter out false signals in combinations and configurations. For example, a “Shooting Star” pattern formed in the market. If at the same time the volumes of positions shown by Volume have increased significantly, then such a signal (for a movement reversal) can be considered confirmed and an order can be opened.
Rules for using the indicator
The Volume indicator allows you to understand the market activity of traders. If a lot of users are currently trading, this means that the asset has potential for trend movement, high volatility, etc. This information is very useful, but it is still impossible to trade on it. The trading process uses different rules and principles.
Volume levels
Trading with volume levels allows you to identify areas of decay and levels of activity in the market. When these areas are known, the average moving average (blue) is applied, which allows analysis of the columns, indicating passivity or activity of the market. The screenshot below shows this all clearly.
Increase
Here are the key aspects:
- The underlying asset can go into a flat (go into a correction) only when a trend has been observed for it (revival).
- It is best to refrain from trading when there is a clear trend in the market, but the volumes are extremely small. At any time, large speculators (or extras) can come and everything will unfold.
The Volumes indicator is interesting in this regard because it has a clear “trend – flat” sequence. It turns out that first the asset falls into small volumes, and then into large ones, and again in a circle.
Large volume and trading with it
A rather important signal from the Volumes indicator appears in a situation where an abnormally high column is observed on the chart. Many investors have seen situations in the market when suddenly a column is formed that is 1.5 - 2 times, and sometimes more times higher than the previous ones.
Here, even the tick volume indicates that everyone has a desire to trade the asset. Many investors will think that if this is the case, then they need to open up in order to be guaranteed to make money. It's not that simple here. The following situations of column formation are possible:
- Large speculators began to create a trend; as a result, we can expect that the price will continue to have the same direction as the “intensity” candle.
- The surge was caused by various factors, including spontaneous ones, behind which there is nothing globally. As a result, there is almost no impact on the market.
- A surge that can also be called agony. Investors squeeze the last juice out of the current movement in order to then begin the trading process in a different direction.
The first case can be found most often. It is described in the literature on technical analysis. At first it is said that the market was at rest, and then it became more active and began a powerful movement.
It's very difficult to find the perfect spot here. Ideally, a position should be opened during the formation of a candle, but when it is already clear that the volumes are large. The screenshot below is an example of such a situation.
Increase
The second option was the situation of neutrality according to the Volumes indicator. In chess it is called a stalemate. The screenshot below clearly shows that when there is activity in the market, there is an upward clear trend. At the moment there is a strong decline, which is supported by volumes.
From the point of view of the classical theory of technical analysis, you should not open against the current trend. In this situation, this is exactly the case, since it is unclear whether such a movement is supported by money. Therefore, it is better to talk about neutrality and the fact that entering a trade on a signal is quite dangerous. It is better to observe the situation and then make a decision.
Increase
The following option is rarely described in the literature, but is quite common in practice. It is also considered a great signal, since in most cases, when a surge occurs after a long-term trend, the probability of a reversal is very high.
This is basic market psychology, where experienced investors win, but beginners can confuse a similar situation with the first point, open up and lose. In simple terms, users get the most out of the current movement, and then reversal. This is where the Volumes indicator is very useful.
Increase
Features of the volume tool
The Volume technical indicator, as well as other tools developed on its basis, show the interest of players in a particular movement in the direction of the market price. Horizontal volumes allow you to analyze the market by price levels, while vertical volumes allow you to analyze the market in a certain time range.
The greater the interest of market participants in any movement, the greater the likelihood of continuation of this movement increases and the higher the value of the volume indicator. The features of volume oscillators (if we compare them with other indicators) include their ability to anticipate future events and signal in advance about changes in market quotes.
How to filter signals from the Chaikin volume indicator
The answer is to add layers. Like any volume indicator, the Chaikin indicator can be edited.
To filter out false signals, a trader needs to follow several steps. First, determine the area surrounding the zero level. Or, area of interest.
Secondly, watching the volume oscillator break through it will be the market direction.
Finally, use signals only in the direction of the previous breakout and ignore the rest.
Let's look at the above diagram and interpret it. This is a four-hour chart of EUR/JPY.
The defined area here is between -25k and +25k. A break above or below these two lines defines the market.
We must use this breakthrough to filter signals. Thus, on the left side, the Chaikin volume indicator has risen above 25 thousand. This is a bullish signal.
Traders only buy at crosshairs above the zero level. On the other hand, when the oscillator falls below -25k, a bearish environment begins.
Description of settings
The Volumes indicator is located in the “Volumes” section, the “Indicators” option, the “Insert” menu of the Metatrader 4 trading platform. The settings window does not contain numerical parameters, only the selection of the thickness and color of the histogram bars.
On the Levels tab, a trader can set specific markers to indicate abnormal historical values. As shown above, they can indicate global reversal points for long-term trends in a currency pair.
Download the baracude Volume indicator
The trading instruments discussed above belong to the type of vertical algorithms. In addition to them, there are also indicators that display horizontal trading volume. This is precisely what “Baracude Volume” refers to, displaying the number of transactions not only over a certain period of time, but also at each of the levels passed by the value. In general, this tool has many similarities to the ones described above and performs the same function, but does it in a different way. Which indicator to choose for trading depends only on the trader.