The Bollinger Bands indicator is probably the best indicator of all. This is the real Grail in the hands of an experienced trader! A myriad of trading strategies and systems are based on this indicator. But 95% of traders do not know how to use it. In this article, I will not only talk about this classic technical analysis indicator, but also teach you how to use and understand it correctly. Don't believe me? Read the article to the end, it will not take you much time, but the effect of reading will be very high, and, most importantly, you will be convinced of the veracity of my words!
Introduction
The indicator was invented by California-based technical analyst John Bollinger, and was first described in 1987 in the book The New Commodity Trading Systems and Methods by Parry Kaufman. John Bollinger was born in France, but his family later moved to New York. Since childhood, Jonah was interested in cinematography and photography, which is why he entered the School of Visual Arts in New York, where he received the profession of a lighting operator. In 1976, he moved to West Hollywood. But everything changed the moment his mother asked to look at her investment portfolio. While working at Financial News, John was able to observe the work of financial analysts, where he gained experience. After completing courses in analytics and obtaining the necessary knowledge, he gets a job at a TV channel as a trade analyst. But already in 1991, the rights to the TV channel were bought by CNBC and this was the end of John’s career on the TV channel. It was during the period from 1984 to 1991 that John Bollinger developed his indicator of rational and effective analysis, called “Bollinger Bands.” This indicator is still relevant today. John Bollinger described in detail the entire mechanism of his indicator in his book “Bollinger on Bollinger Bands”. And in 1996, John was recognized as the best software developer for financial markets.
Description of the indicator
Visually, the Bollinger Bands (BB) indicator consists of two bands that limit price movement from above and below. The boundaries of the bands are a kind of support and resistance levels, and most of the time they are located at a distance from the price. Bollinger Bands resemble moving averages. But the difference is that the BB boundaries are constructed at distances equal to the number of standard deviations. Since the value of standard deviations depends on volatility, Bollinger Bands themselves regulate their size: at low volatility the bands decrease, at high volatility they increase. Thus, most of the time the price is located directly inside the bands. Moreover, the larger the standard deviation, the greater the likelihood that the price will not leave the Bollinger Bands. With standard settings, the basic rule for constructing Bollinger Bands is the following statement - about 5% of prices should be outside the bands, and about 95% of prices should be inside. Bollinger Bands are formed from three lines:
- The central line is a regular moving average with a period of 20
- The top line is the same moving average, shifted upward by the number of standard deviations.
- The lower line is a moving average shifted down by the number of standard deviations.
Bollinger Bands are unique in that changes in width are directly related to market volatility. The boundaries of Bollinger Bands are constructed in proportion to the standard deviation from the moving average (the middle line of the Bollinger Bands) for the analyzed period. Thus, this indicator indicates the emerging volatility by expanding, and as volatility decreases, the bands narrow. Unlike other indicators, Bollinger Bands have one very pronounced and important feature - they show us what is happening directly at this moment in the market, and not the past, as is often the case when using other indicators. BB can be used either independently or in conjunction with other indicators. Of course, everything depends solely on your knowledge, which I will now try to supplement. As mentioned earlier, Bollinger Bands reflect the actual state of the market at the moment and are capable of indicating the main points in trading, such as the beginning and end of a trend, the beginning of an impulse, a false impulse, a flat, a trend. Simply put, Bollinger Bands are a unique indicator that allows you to evaluate price movement and make the right conclusion. John Bollinger himself speaks about this in detail in his book “Bollinger on Bollinger Bands.” It is possible to use Bollinger Bands without any additional indicators, but only if you know how to construct levels and zones of PS and technical analysis models.
Cryptobots for working with the indicator
Bollinger Bands is available in the following bots:
- Cryptohopper is a service with the ability to open a free demo account. The strategies include Bollinger Bands Easy and Bollinger Bands Advanced.
- GUNBOT is a trading bot that can be installed on a PC. There are both ready-made strategies and tools for creating them.
- Cryptorg is a bot tailored to one strategy using Bollinger Bands: daily trading volume and positive price changes are measured. According to the configured parameters, positions are opened.
- ProfitTrailer is a service with 12+ strategies that can be automated or manually configured. Available exchanges include: Poloniex, Bittrex, Binance (US, Futures, Jersey, DEX), Kucoin, Huobi, BitMEX, Bybit.
- Margin - there is a trading terminal and 4 bots, including the Bollinger Band bot, which allows you to buy cryptocurrency at the lower border and sell at the upper border of the channel.
- GBOT is a bot that works through the control panel or Telegram (configuration required).
- ApexTrader is an automated trading platform. For Bollinger Bands, you can set a trigger for crossing borders, buying outside borders or inside a channel.
- Zenbot is a free bot for experienced users with Java programming skills.
Calculation formulas for the Bollinger Bands indicator
Bollinger Bands are formed from three lines. The middle line is a simple moving average (SMA). In the expression below, “period” denotes the number of time periods (number of candles) that make up the period for calculating the moving average (20 according to the standard).
The upper line of the Bollinger Bands is the same moving average, shifted upward by several standard deviations. In the formula below, "n" represents the number of standard deviations.
The lower line of Bollinger Bands is calculated similarly to the upper line, but it is shifted down.
John Bollinger himself recommends using a period of 20 and a standard deviation of 2. He also found that a period of less than 10 is ineffective.
Book "Bollinger about Bollinger Bands"
Perhaps the most detailed description of the operation of this indicator and trading systems based on it, both individually and in combination with other technical analysis indicators, is given in this book.
Book's contents:
Also, for those who are interested in information about John Bollinger, we recommend:
Bollinger Bands settings
Bollinger Bands have the following standard settings:
- Period: 20
- Deviation: 2
- Offset: 0
- Price (Apply to): Close
Period
For Bollinger Bands, it is recommended to use a period from 14 to 24 (standard 20), and a standard deviation from 2 to 5 (standard 2). It is worth understanding that increasing the period and deviation will affect the sensitivity of the indicator, and decreasing it will affect the performance - many false signals will appear. Therefore, I recommend leaving the period at 20 and not increasing the deviation more than 3, ideally from 2 to -2.8.
Shift
It is best to leave the shift as standard, i.e. equal to 0. But in my practice I sometimes use a shift of “1”. This does not affect the overall picture, but the indicator is not redrawn above and below the forming candle.
Price
Closing prices are most often used to construct Bollinger Bands. Simply put, the indicator will use when constructing the prices at which the candle closed.
Timeframes
The indicator works great on all timeframes. Of course, the higher the timeframe, the more accurate and reliable the signal. Do not forget that different assets can behave differently, so the indicator settings should be selected individually for each asset.
How does the Bollinger Bands indicator work?
As I said, Bollinger bands show the real state of the market. Of course, there are main points that are worth focusing on. Let's look at these points. Bollinger Bands are a channel indicator, so it is worth initially analyzing its “calm” state - the state during a sideways price movement.
As you can see, in this state, the Bollinger Bands are directed horizontally. Moreover, this state allows you to detect false impulses. Let’s say that if the price reaches the upper border, but the impulse itself (the harbinger of the beginning of a trend movement) is absent, then the lower border will not react to this and will also be directed horizontally. But if an impulse appears, then the boundaries of the explosive begin to expand. This can be seen in this screenshot:
The explosive boundaries will expand as long as the momentum remains. As soon as the momentum fades, this is immediately confirmed by the Bollinger Bands themselves - the lower border moves to a horizontal position. But the end of the impulse does not mean the end of the trend - the upper boundary is still directed upward.
As the trend continues, all three lines will be directed in its direction, in this example - upward. The first sign that the trend will end soon will be a change in the upper border of the Bollinger Bands from upward to horizontal - this is a signal calling for attention to the situation on the market.
If the trend continues, the upper band moves upward again. But if the trend ends, then the upper band will be directed downward and the channel will begin to narrow.
In the future, a flat, a new impulse, a trend may form, but this no longer worries us. Bollinger Bands tell us what is happening right now, not what will happen in the future. Thus, we can clearly trace the entire trend from the beginning of its formation to its completion. It is worth understanding that in one price movement up or down there can be several trends; accordingly, BB will show us several trends.
How to use
There are several characteristic areas in the operation of the Bollinger Bands indicator:
- A period of calm in the market is a flat. The center line is usually directed horizontally or has a slight slope. The channel boundaries are parallel to the axis or directed towards the center (narrowing occurs as the level of market noise decreases). The price spends most of its time in a range with rare spikes; a short-term breakout of the upper or lower band is possible. This configuration allows you to trade on a flat using standard methods of rebounding from resistance support lines; their role is played by the upper and lower lines.
- Directed movement. The moving average has a significant slope. At the beginning of the movement, the stripes follow the center line, due to changes in the average value and delays, increasing the standard deviation, the slope of the stripes differs - the channel expands. Breakouts of the boundaries appear more often: in an uptrend - the upper one, in a downward trend - the lower one. The price practically does not reach the opposite band - its movement against the trend is in most cases limited by the MA, which begins to serve as a dynamic support/resistance line. A “walk along the band” mode is possible – several successive breakdowns of one of the boundaries, which indicate significant trend strength.
- End of the wave. When the potential for movement is exhausted, the slope of the moving average decreases, and the range begins to narrow (the boundaries get closer together). One of the signs of a likely completion of the movement is a breakdown of the BB center line.
Read more: Traders Dynamic Index - understanding the indicator
Reliable identification of characteristic areas is simplified with optimal adjustment of instrument parameters.
Changing settings
When optimizing the sensitivity of Bollinger Bands and building profitable trading vehicles, the main role is played by 2 parameters - the calculation period and the deviation coefficient.
Their choice is carried out in accordance with the “5% rule” - the optimal combination is considered to be one in which the price chart moves 95% of the time in the range limited by the upper and lower lines.
The settlement period determines the position of the channel axis and is responsible for filtering market noise. Accordingly, when the noise level of the chart increases and the transition to lower timeframes occurs, the parameter should be increased. But choosing a larger calculation period accordingly leads to an increase in delays after the start of a directional trend (the reliability of trend identification on the initial bars decreases).
The rejection coefficient helps maintain the speed of reaction and at the same time adjust the sensitivity to filter out most false signals. However, its excessive increase will lead to a drop in the frequency of signals - the conditions for their generation will only be created by a very strong price impulse and complete insensitivity to the behavior of the price chart in a flat.
Other possible options for improving the performance of the tool include the use of averaging methods other than simple MA. For example, EMA-based BB shows better sensitivity to price changes. The indicator in the standard MetaTrader package does not allow such freedom, however, traders have developed many original implementations of BB, including those with a choice of the type of moving average.
Changing Bollinger Bands indicator settings
As mentioned earlier, in some cases you can change the settings of the BB indicator, thereby adjusting it to the desired assets and trading. Changing the period will greatly affect the sensitivity of the indicator: when the period increases, the indicator will respond longer to changes in price movement, and when it decreases, it will respond faster, but will produce more false signals. Let me remind you that I personally believe that period 20 is the most optimal period for this indicator - this is the golden mean. The period itself is the number of last candles that are used for calculations and construction of bands. If everything is clear with the period, then the standard extension, in some cases, simply needs to be changed. The standard extension determines how many candles will be inside the bands and how many outside their boundaries. So, with a deviation of “2”, 90.11% of the candles will be inside the bands, and with a deviation of “3”, 99.98% of the candles will already be located. Personally, in my trading I do not use a deviation higher than “2.8” - this is quite enough to get quite good signals in different strategies. Of course, you should not change the indicator settings without a reason. All changes must be justified!
Ways to use Bollinger Bands in trading
John Bollinger has repeatedly focused his attention on the following points of price and indicator behavior:
- A sharp price change mainly occurs after the Bollinger Bands narrow (after volatility decreases).
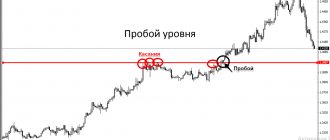
- If the price goes (or moves along the border) beyond the Bollinger Bands, then you should wait for the movement to continue.
- If peaks and troughs on the borders of Bollinger bands are followed by peaks and troughs inside the bands, then we should expect a trend reversal or a transition of the price movement to sideways (flat).
- A price movement that starts from one of the boundaries of the Bollinger Bands most often reaches the opposite boundary.
The best strategy for Bollinger Bands
What trading strategy can you recommend?
Of course, you need to open the chart and just learn how to find all the elements that we have already described:
- punching a line;
- walking along the lane;
- letters W and M.
Often the strategy is to use bands with other indicators that complement it. Of these, two fit well, namely:
- MACD;
- price oscillator (price oscillator).
And stop putting 20 indicators on the chart. If the success of trading depended on the number of indicators, then we would all already be millionaires. But the reality, as you understand, is somewhat more complicated.
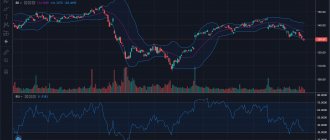
Live chart with Bollinger bands, MACD and price oscillator
Bollinger + candlestick analysis + auxiliary indicator. But it will take practice, a lot of practice. Study the chart, find the necessary examples on it, and in general, don’t be lazy.
Recommendations for using Bollinger Bands
Bollinger Bands are a universal indicator that allows you to trade on absolutely any market. But most traders believe that this indicator allows you to receive signals only in sideways movements. This is not so, and now I will prove it to you.
Bollinger Bands in Sideways Movement
As I already said, the indicator can be used in a sideways movement (the most common method). With such trading, we will enter a deal whenever the price touches the BB boundaries, of course, if the opposite side does not expand (many people forget about this or do not know at all).
Bollinger Bands in a trend movement
In addition, the indicator can show signals based on the trend quite well. In this case, the central line of BB will serve as a dynamic level of support and resistance. As a rule, almost all trend movement will be in the upper or lower band of the indicator. The trend itself most often begins after breaking through the central BB line.
Let's take a closer look at the entire process of trend emergence. As already mentioned, a trend most often begins with a breakout of the central line, after which the price reaches the BB boundaries. After some time, as a rule, a rollback occurs, which reaches the central line of the explosive, and movement begins from it. Thus, the central line of Bollinger Bands can serve as a very good resistance support line - the extreme point of correction.
Please note that at point 5 the central line of the BB was broken, but the trend did not change - this is a false breakout. It indicates a weakening trend at the moment. It is worth paying attention to such breakouts; most often they indicate the imminent end of the trend. If the price goes beyond the Bollinger Bands border, most often it means the continuation of the trend, and the more often the borders are broken, the more stable the trend! Based on this rule, we can say with confidence that price movement along the BB border means a very strong trend.
It is important to be able to distinguish a trend from a sideways movement: during a trend, most of the candles are located in the upper (if the trend is up) or in the lower (if the trend is down) band of the indicator, while during a sideways movement, the candles are distributed approximately equally between the bands.
Formation of candles outside the Bollinger Bands
There are times when the price very strongly breaks through the boundaries of the indicator and the next candle is completely formed behind the Bollinger Bands. According to the formulas, 90-95% of candles will be located inside the indicator - this means that candles cannot form in large numbers outside the bands, which means there is a high probability (90-95%) that the price will return inside the bands.
It is also worth paying attention to the candles that opened OUTSIDE the boundaries of the Bollinger Bands; most often, such candles will be directed inside the bands - into the “zone of their natural habitat”. Please note that if there is a series of candles with a large body, then the probability of the price returning inside the Bollinger Bands decreases - the probability that the price will continue to move in the same direction increases.
Bollinger Bands Slope
The slope of Bollinger Bands allows you to determine the current trend. A downward slope means there is a downward trend, an upward slope means an upward trend. There are no secrets here, all you need to do is look at the chart.
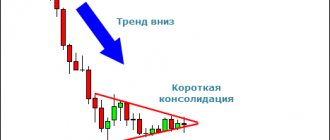
Narrowing and widening Bollinger Bands
The narrowing indicates that volatility in the market is decreasing. In turn, the narrower the indicator channel, the longer the sideways movement (consolidation) lasts. As a rule, after a long sideways movement (consolidation), a strong impulse occurs, which can be seen on the chart:
Recognizing Patterns Using Bollinger Bands
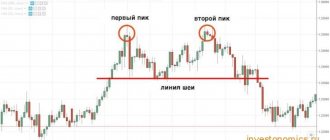
For example, let’s take a very common trend reversal pattern - “Double Bottom”. According to information from John Bollinger himself, if peaks and troughs outside (or on the border) of the Bollinger bands are followed by peaks and troughs inside the bands, then a trend reversal is expected. It is by this principle that reversal patterns can be identified. In this example, the first depression is located on the border of the bands, and the second depression inside the Bollinger bands is a clear sign of a trend reversal.
According to this reversal pattern, the first low should be lower than the second, which we can see on the chart. In addition, the narrowing of the boundaries of the explosive also hints at the end of the trend.
Trend Trading Strategies Using the Bollinder Bands Indicator
Unlike most indicators, Bollinger Bands are not a static indicator and change their shape based on recent prices and an accurate measurement of momentum and volatility. So we can use this indicator to analyze the strength of the trend and get a lot of valuable information. Here are some important points to pay attention to when you use the Bollinger Bands indicator to analyze trend strength:
- During strong trends, the price is close to the outer ribbon (band)
- A break of the outer band while the trend continues shows weakening momentum.
- Repeated price movements in the direction of the outer band that do not actually reach it indicate a lack of strength.
- A breakout of the moving average is often a sign that a trend is ending.
The figure below shows how much information a trader can extract if he uses Bollinger Bands.
- The price is in a strong downtrend and remains near the outer band all the time - a very bearish signal.
- The price does not reach the outer band and shows a strong rebound from this dynamic level, creating a bullish engulfing pattern. This is a classic reversal pattern that indicates the end of a bearish trend.
- 3 swings appear, where each subsequent swing has a lower maximum. The first reaches the outer lane, the other two do not.
- A strong downtrend in which the price remains close to the outer band.
- The price consolidates in a sideways movement and no longer reaches the lower band. Pay attention to the resulting pin bar, which can be a good signal of the end of the trend.
As you can see, Bollinger Bands themselves can provide a lot of information about the strength of a trend and the balance between bulls and bears.
Finding peaks and bottoms and setting up Bollinger Bands
When you set the standard deviation in the Bollinger Bands indicator settings to 2.5, you will notice that the price rarely reaches the outer band. The significance of such a signal becomes more important because it indicates price extremes: highs (peaks), lows (bottoms).
We highly recommend combining Bollinger Bands with the RSI indicator - it's the perfect combination. In addition, the peaks that stand out from the two types listed below are important:
- The price tends to the outer band, but upon reaching it, it immediately rebounds >> Reversal signal
- After moving along the trend, the price does not reach the outer band and weakens. This signal is usually accompanied by a divergence from the RSI >> Continuation signal
The graph below shows both scenarios. The first, where the market makes a peak after a divergence, shows how the trend weakens and loses momentum until it finally reaches the outer band before reversing. We marked the second peak with an arrow - this was a continuation signal after the price failed to move higher during the downtrend. In the resulting pin bar, the long shadow from the quick retracement shows that the bulls lack strength.
The role of the moving average
During trends, the moving average holds price very closely, and its breakout is usually an important signal that sentiment is changing. The screenshot below shows how the price moves in a trend between the outer band and the moving average, regardless of whether we are talking about an increase or decrease. The moving average during trends can be used as a re-entry signal to add to an existing position during reversals.
The moving average can also be used as a signal to exit a position if the price breaks it from the top to the bottom in an uptrend or from the bottom in a downtrend. By combining Bollinger Bands with a moving average, a trader can create a reliable trading method.
Pros and cons of Bollinger Bands
As has been said many times, Bollinger Bands are a unique indicator that can show us a reflection of what is happening in the market at the moment. The indicator performs well when working with both Japanese candlesticks and bars. Bollinger Bands are also a “guideline” on the price chart - due to their slope, it is very easy to determine the current trend. In addition, the narrowing of the bands tells us that there is a sideways movement in the market, and the expansion of the boundaries indicates the beginning of a trend. All this is very easily determined visually. In addition, if you thoroughly understand the operation of the indicator itself, you can easily determine the beginning and end of a trend. In addition, it is a classic indicator, which means that it can be found and used on trading platforms of the following binary options brokers: Binomo, ExpertOption, FinMax, Olymp Trade. The bands themselves “attract” the price to themselves and “force” it to stay inside the bands most of the time. Bollinger Bands are suitable for absolutely any market, and not just for flat markets, as most people think about it. This indicator also simplifies the search for trend reversal and continuation patterns. Bollinger Bands also have disadvantages. The main disadvantage is the lag inherent in all moving averages. During the formation of the candle, a slight redrawing may occur, because The data is taken directly from the closing of the candle. In some cases this causes discomfort. The second disadvantage is the inferiority of the indicator. You cannot use only one BB indicator to analyze a chart; at a minimum, you must also use support and resistance levels, because Most traders rely on them.
Money management system
For reasonable money management when trading on the Forex market, compliance with the rules of money management is mandatory. Possible chaotic changes in quotes and unforeseen trend changes cause high trading risks. To protect your account from drawdowns, you should follow the classic requirements of not risking more than 1-2% of your capital in one transaction. Using this rule, a trader will not lose track even after a series of negative trades in a row, especially since, as mentioned above, the total number of profitable market entries using the Bollinger and RSI strategy averages 80%.
As for taking profits, the size of the stop loss directly depends on the working timeframe. For example, if trading is carried out on TF H4, then take profit can be set within 200 points, and SL will be equal to 100 points. To optimize profit, you can move the stop to breakeven when a profit of 60 points is reached, and after a profit of 150 points, you can use a trailing stop. The trading conditions of the Bollinger and RSI strategy are suitable for traders who work part-time. At the same time, you should not hold open positions for a long time - when working on four-hour charts, you can set the period for forced closure of the transaction at 2 weeks; if during this period it has not been closed either by SL or TP, then you should exit the market at the current price.
The “Bollinger and RSI” strategy can be used either in the specified form, or you can create your own TS based on it, adding several more filters to the list of indicators, which will allow you to both increase the number of entry points and make existing signals for buying or selling trading instruments even more more accurate.