- Creator of MACD
- A Brief History of MACD
- Formula
- Description of MACD
- MACD line
- Signal line
- bar chart
- Strategy
- Signal line crossing
- Crossing the zero line
- Divergence
- Positive divergence (price up)
- Negative divergence (price down)
- Trading MACD in binary options
- Are there any disadvantages?
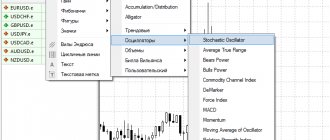
- How to set up MACD
One of the most popular technical analysis indicators in the world is MACD, which stands for moving average convergence/divergence.
This wonderful tool, created by Gerald Appel, is known to every trader of any asset, from gold to stocks, futures or, of course, binaries.
Most of the super successful and easy to use indicators were created by cool traders who earned their millions with their help. In this regard, Appel's story is very revealing.
What is the MACD indicator?
The Moving Average Convergence/Divergence (MACD) indicator is a trend indicator and also a momentum indicator (momentum is the speed at which price moves along a trend) developed by Gerald Appel.
The MACD indicator is usually located at the bottom of the trading chart, in a separate window. This indicator is a relatively easy tool to use, however it is extremely important to fully understand it before attempting to trade using its signals.
Let's take a closer look at the structure of the MACD indicator and its default settings. The indicator consists of three components, namely two lines and a histogram.
- MACD Line: (12-day EMA minus 26-day EMA) is the faster line on the indicator. Because it reacts faster and is more sensitive, it usually moves above or below the second line of the indicator.
- Signal line: 9-day EMA of MACD line. The MACD signal line is the second line of the indicator. It is called a signal line because it generates the main MACD signals. Because this line is slower, it is often crossed by the faster MACD line.
- MACD histogram: MACD line minus signal line. The MACD histogram represents the difference between the MACD line and the signal line. The larger the gap between the lines, the higher the bars that the histogram will display.
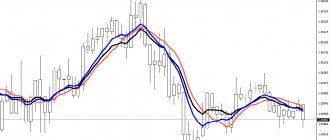
This is a larger image of the MACD indicator. The blue line is the MACD line. The red line is the signal line. As you can see, the MACD line is faster and often crosses the signal line. The gray bars are the histogram, which moves according to the distance between the two indicator lines.
Advantages and disadvantages
The main advantage of the technical analysis tools under consideration is ease of use, which is highly valued by novice traders.
In addition, there are advantages:
- visibility of trading signals;
- combining the properties of a trend and flat indicator, which reduces the likelihood of trading against the market;
- predictive capabilities in determining further price movements;
- information about market strength;
- wide range of settings.
MACD also has its disadvantages:
- price lag, characteristic of most oscillators, which limits its use, for example, in scalping;
- the presence of false trading signals (TS), caused by the “redrawing” of the instrument, when the TS appears and disappears after some time.
MACD indicator settings
On most trading platforms, the MACD indicator usually comes with default settings of 26, 12 and 9.
Parameters “12” and “26” are interconnected. These two numbers are about calculating the faster MACD line. The MACD line structure consists of calculating a 12-period exponential moving average and then subtracting the 26-period exponential moving average from the result. The difference between the two EMAs will give us the value of the faster line.
"9" is obtained from the calculation of a slower line, such as a signal line. This line is the result of a 9-period exponential moving average built on the faster MACD line. This is why the signal line is slower than the MACD line - because it is smoother.
MACD line
We need to take the 12-day EMA value and subtract the 26-day EMA value from it. As a result, we will get the MACD line.
Signal line
We need to take the historical values of the MACD line and divide them by 9. We will get the signal line. For example, we have a MACD line with the following values: 1, 2, 3, 4, 5, 6, 7, 8, 9. Let's add these numbers and divide them by 9. We get: (1+2+3+4+5 +6+7+8+9)/9 = 5.
MACD histogram
MACD histogram - the value of the MACD line minus the signal line.
Does MACD have any disadvantages?
All technical indicators have disadvantages. The MACD was no exception. The main disadvantage is the use of moving averages, which leads to delayed signals, as well as many false signals in flat movements.
Not a disadvantage, but rather a nuance, is that the classic MACD is designed for analysis of timeframes from the daily and older. By the way, few people know about this; the default indicator parameters (12, 26, 9) were originally designed for the daily chart. Of course, no one forbids using MACD on smaller timeframes, but the quality of the signals will suffer. Accordingly, the MACD indicator needs to configure parameters for each timeframe and currency pair used.
Crossing of MACD lines
The MACD line is faster than the signal line, and it usually crosses above or below the slower signal line.
- A bullish MACD crossover occurs when the MACD line crosses the slower signal line in a bullish direction. This generates a bullish signal on the chart, which implies that the price may begin to rise.
- When the MACD line crosses the signal line in a bearish direction. This hints that the price may move in a bearish direction.
The green circle shows the moment when the faster MACD line crosses the signal line in a bullish direction.
MACD indicator with two lines
The indicator with two lines MACD 2 Line is a modernized MACD.
In the working area of the indicator, in addition to the histogram, there is now a fast moving average and a slow one.
The intersections of fast and slow lines give us entry signals:
- The fast one has crossed the slow one from the bottom up and the histogram is above 0 - this is a buy signal;
- a sell signal when the fast one crosses the slow one from top to bottom and the MACD histogram is lower;
- These signals work better in a trending market rather than in a flat market.
MACD 2 Line is a custom indicator. Those. MetaTrader not built into the basic package.
To use custom indicators, you need to copy the file with the extension “.ex4” to the “indicators” folder of your MetaTrader4, then click the right mouse button in the navigator and “update” there.
To add a custom indicator to the chart, you need to drag it from the “Navigator” window onto the chart.
MACD and divergence
One of the best uses of MACD in trading is to identify divergence signals. When the price movement on the chart and the direction of the MACD contradict each other, it indicates that the price may change its direction.
A bullish MACD divergence occurs when the price moves lower and the MACD makes higher lows. In this case, the MACD indicator shows us a strong bullish signal. Very often we will see the price begin a strong upward movement after a bullish divergence from the MACD.
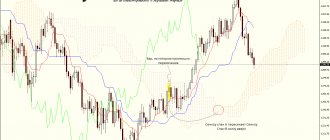
Below you can see an example of a bullish MACD divergence. After the divergence appears, we see that the price enters an upward trend.
A bearish MACD divergence occurs when price is rising and the MACD lines are making lower highs. Divergence hints that the price may begin a bearish movement.
One of the disadvantages of divergence is that price can remain in divergence for quite a long time without any reversal, and sometimes it can be difficult to know when to enter a position.
The chart begins with a sharp drop in price. Suddenly the decline slows. At the same time, the MACD not only slows down, but also begins to rise, creating a bullish divergence. Subsequently, a bullish MACD crossover appears. Here you could open a trade based on this signal. However, here you would most likely have a stop loss triggered.
Shortly after this we see a reversal pin bar, which provides further confirmation of the bullish scenario. Then the price begins to rise. Shortly after this we find a rising wedge. Since the wedge has strong bearish potential, its lower level breakout can be used in conjunction with a bearish MACD crossover to exit the trade.
When trading MACD divergence, you should always be on the lookout for price cues. This way, you can better understand where and when to enter and exit your trades.
Trading MACD in binary options
As you can see, the Makdi indicator is not only simple, but also more than effective. Essentially, this is an indicator and strategy in one bottle. It not only allows you to identify a trend, but also helps determine the force with which the price moves (the so-called “momentum”).
Use MACD only in a market with good volatility. This is when the price “sausages” according to the chart: it quickly goes up and down. If it is marking time and moving sideways, ignore the asset and find another one.
How to trade with it? Look at intersections and divergences. Especially the latter - it is divergence that always accurately indicates a change in trend. This is a great signal.
Don't forget to look at the behavior of a currency pair or other asset in different time frames and, based on this, adjust your strategy.
The golden moment in binary options is, of course, the intersection of lines. The main thing is not to make a mistake with the expiration time.
- If you work with a 5-minute chart, set expiration for 5-25 minutes (my favorite period).
- Hourly timeframe – expiration is good at the end of the day.
- Well, the 1-minute chart is only for short-term turbo options for 1-3 minutes.
Are there any disadvantages?
Of course, despite all its advantages, makdi also has certain disadvantages. But they are exactly the same as any other indicator. You cannot blindly trust the indicator. No indicator gives 100% successful trades. It should only be considered in conjunction with an analysis of price movement.
You need to understand whether the price is moving up, down or in a sideways movement. Use different time frames and assess the situation as a whole. And only then rely on MACD. Also, it is not particularly advisable to use it on a 1-minute chart. However, this applies to most trend indicators.
With proper practice, MACD will show remarkable results - that's what it was created for, and that's why it's popular. But be patient, practice does not approve of fuss.
Overbought and oversold
The MACD indicator can also give overbought or oversold signals.
- The MACD is overbought when the MACD line travels a relatively large distance from the signal line. In such cases, we expect the bullish move to exhaust itself after a strong rally and the emergence of a bearish move.
- The MACD is oversold when the MACD line moves a significant bearish distance from the signal line. In this case, we expect the price to exhaust itself and enter a bullish phase.
In the green rectangle you see a case where the fast MACD line is at a relatively large distance from the red signal line. This indicates oversold conditions.
Technical analysis and MACD indicator
As you can see, the MACD indicator is quite rich in various types of signals and is a universal trading tool. You can also trade effectively using MACD in combination with price action. Let's look at some examples.
The chart starts with a bearish divergence. As you can see, price is making higher highs while the MACD indicator tops are falling. After this, the two MACD lines intersect and the price goes down. We then see four more price swings associated with the bullish and bearish MACD crossover. Every time two lines intersect, we see price fluctuation in the direction of the intersection.
In this case, the price declines after a bearish MACD crossover. However, 7 periods later we see a potential MACD oversold signal. The MACD line is at a significant bearish distance from the signal line. This means the price may be oversold and ready for a rebound.
If you are going long, you can place your stop loss order below the previous low on the chart. If you are short trading, you can place a stop loss order above the previous high. One way to exit a MACD trade is to hold the position until an opposing signal is received.
The first signal comes when the price shows a pin bar. A few candles later, we see that the MACD lines are creating a bullish crossover. These are two coinciding bullish signals that may be a sufficient precondition for opening a long trade.
The price then increases and creates a pattern like AB = CD. This may serve as an optimal exit point. After the last high is made, we see a price reversal followed by a breakout of the trend line. At the same time, MACD lines cross in a bearish direction. These are two separate signals, which, unfortunately, are a little late. If you closed the trade here, the position would still be profitable.
It is worth noting that a trendline breakout and a bearish MACD crossover generate coinciding short signals on the chart.
After this, the price begins to decline in a bearish trend. The MACD lines are also decreasing. After a 6-day decline, a bullish MACD divergence appears on the chart. This way, you can exit the trade when the MACD lines cross upward. This occurs after just a couple of periods, confirming the bullish divergence pattern.
From the history of creation
The indicator is considered a classic of price chart analysis and was developed in the early 1970s. Its development and creation was carried out by the famous Jerold Appel, under whose management, even at that time, there were about five hundred million US dollars. To date, the MACD indicator can easily be considered one of the most popular technical analysis tools, which is used by a huge number of stock speculators.
The purpose for which this turkey was developed was quite simple and ingenious; Appel wanted to create a tool that could with high probability determine the strength, direction and speed of a trend; in addition, he managed to use the indicator to determine potential reversal zones.
The tool includes almost all the main indicators that can be used to determine with a high degree of probability the future price movement of any exchange asset; it is for these reasons that this indicator has not yet lost its relevance.
Common mistakes when using the MACD indicator
There are two common mistakes that traders make when using the MACD indicator:
- Trading at the intersection of MACD lines.
- Misunderstanding the MACD histogram.
Trading at the intersection of MACD lines
This method only works in strong trending markets. But remember that most of the time markets are in a range. This means that the crossing of MACD lines will show too many false signals, which will only lead to losses.
Misunderstanding the MACD Histogram
Let's look at the graph below:
You might think, “There is a lot of momentum in the movement. Time to buy!
However, this is wrong. Because most often the time to enter has already passed and the price is likely to reverse. Instead, the best approach is to trade against the current MACD momentum and enter a reversal position.
How to properly use the MACD histogram to identify a reversal?
When I first started trading, I mostly traded breakouts. The larger the candles were, the more often I entered the market. However, the result of this strategy was constant losses. That's when I realized that my entry into the market was too late. I usually opened my trades, and after that the price immediately turned in the opposite direction.
Then I thought, “What if I do the opposite and take a position in the opposite direction of the current momentum?” As a result, my trading results became much better.
The MACD histogram can help us determine a strong impulse. Here's how it works:
- We wait until the price reaches a structural area on the chart (for example, a horizontal level, trend line, moving average).
- The MACD histogram should show strong momentum.
- On a price rebound, we open a position in the opposite direction.
Here's an example:
How to use the MACD indicator to increase the profitability of your trades?
The concept is simple. We will use the MACD indicator to determine the current trend on a higher time frame and then trade in its direction.
Here's how it works:
- We are looking at the higher time frame.
- If the MACD line crosses the signal line from bottom to top, we are looking for opportunities to open long positions.
- If the MACD line crosses the signal line downward, we are looking for opportunities to open short positions.
Let's say your working timeframe is H1, then your higher timeframe is H4.
If the MACD line crosses the signal line from bottom to top, we are looking for opportunities to open long positions:
If the MACD line crosses the signal line downwards, we are looking for opportunities to open short positions:
How to spot explosive price movements using MACD?
Explosive price movements usually occur after a period of low volatility, when the range of candles becomes denser and the candles themselves are small in size.
The MACD histogram will help us identify such periods in the market.
- The price reaches a structural area on the chart (horizontal level, trend line, moving average).
- The MACD histogram appears almost flat with no visible peaks or troughs.
- We open a position for a breakout when it occurs.
Here are some examples: