To explain it in simple words, the support line denotes a certain level that the value of the asset cannot immediately “break through” (cross and move on), and the resistance line shows the same upper limit. Both lines create a kind of corridor, within which the price of the instrument moves according to its own laws.
Levels in trading can also be taken as points at which a reversal of the price movement in the opposite direction occurs (this is a “price rebound”) or the movement continues (a “breakout” is observed). In the first situation, the chart, having reached the corridor created by the lines, turns around.
A breakout does not always signal a change in trend, as it may be false (after breaking through a level, the price after a certain period of time returns to previous values within the price corridor). Taking into account these features, when entering the market, traders must wait for confirmation of a trend change.
The ability to draw support/resistance levels on a chart is basic knowledge and skills in Forex trading.
Thanks to these lines, traders can successfully predict future price changes, enter the market on time and open profitable trades. Most often, pending orders are placed near the resistance/support lines.
What is a support or resistance level
How to find and how to trade the correct price levels?! Perhaps, this question has been asked at least once, if not by every trader who studies trading from levels, then certainly by many of us.
Problems usually begin when you have already built support and resistance levels using methodological materials from the Internet. And so you look at this huge number of lines and try to figure out what to do with them?
In this article we will give you the answer to this and other questions related to strong levels. Let's first define what support and resistance levels are, or more precisely, what should be understood by these levels.
A strong level always means big money. Not even that - it's HUGE MONEY! And what you see on the chart in the form of a stop of movement is the trace of this big money, along which you can draw a risk boundary - a level.
No matter how big market players try to hide their presence on it, they inevitably leave traces. Our task is to learn to find these traces and interpret them correctly, as well as use them for our own purposes.
You need to find a point where financial market players who have large amounts of capital under management will defend their critical price.
“What is the “critical price”?!” - You ask. This is the price at which their money will begin to lose personal value, meaning players will suffer losses. And we remember that this is not just “money”, but “big money”!
If you know where a player's critical price is, then you have a place where you can understand the risk the most. Accordingly, you will be able to place your stop where the stop of a player with large capital is most likely to be.
Yes! Big players lose money too! And I’ll tell you even more, they do this quite often! But they are not tied to their capital as much as you and I are. To them, it's just business, and losses are nothing more than "trading costs."
But understanding where this is most likely to happen gives you a big advantage in the form of the most informed entry, with a clear understanding of its riskiness.
This price becomes a strong level at which large capital will try to protect their stop loss. After all, the fact that a player is ready to lose his money does not mean that he wants to do it. A big player, just like you and me, came to the market to make money, but, unfortunately, on you and me.
In order to make money, he will, to the best of his considerable ability, protect his critical price. Our task is to find this point and trade from it in order to place a stop where it is not profitable for a large player to put the price, that is, in the zone where he also has a stop loss.
The strongest levels
Beginning traders, in the process of learning the intricacies of constructing support/resistance lines, often face the problem of identifying really strong levels. After all, to be able to use them in trading, these should be important levels and in moderate quantities, and not a huge number of lines on the chart, on which it is very difficult to determine something.
Main characteristics of a strong level:
- Multiple price rebounds.
- If not multiple, then noticeable price rebounds and the creation of extremes.
- The older time frames D1, W1, MN also have these levels.
- Levels that merge, transition, or dynamically overlap each other are considered significant.
The principle is quite simple: the stronger the level, the higher the time frame it was created on and the greater the number of listed criteria it must meet.
The price of an asset bounces off a strong level more often than creates a breakout. Any level can eventually be broken, but before that there should be many small and 1-2 significant rebounds. This pattern almost always works and can be used in technical analysis and forecasting.
To draw a strong level, it is best to mark the chart on a higher time period, without getting too carried away. So, if trading is carried out on M15, then marking levels on MN is at least ineffective. So, when conducting intraday trading and concluding transactions for several hours, there is no point in marking weekly charts. You need to mark the nearest levels that will be significant in the near future.
Which levels are always considered strong:
- Breaking points for price movement on large timeframes are monthly or annual lows/highs, especially if formed near round numbers.
- The longer the trade, the stronger the level - there are models that are traded on a larger TF and the level is additionally confirmed at lower time intervals.
- When the pressure is applied to the level and a triangle appears, the breakdown can be strong.
- When volumes increased near the level and the price was not allowed to go beyond the line, this also indicates the strength of the level.
- If the price gradually approaches the level, then it trades it (when it approaches sharply, there is no trade - it is better not to enter the market).
A false breakout of a level and its puncture by a shadow strengthens the line and gives an entry signal. Provided that after the breakout there is a retest and the level is pierced on a larger TF, and the price consolidates above the line, this can also be a good entry signal.
Key Points When Determining Levels
You need to understand three key points:
1. The longer a player takes to gain a position, the larger his position. 2. The larger his position, the more strongly he will defend the critical price level. 3. The stronger the player defends his price, the stronger the level, and the less likely the transaction is to have a negative outcome.
Create a personal account
How can you see traces on the chart that the player is defending the price (position)? This is exactly the situation when it is said that the level is confirmed. Let's look at the graph.
How to build levels if you are a beginner?
Newcomers to the Forex market often ask this question. I will also add a few recommendations to increase profits :
- Don't overload the chart with lines . The problem for many is the construction of all possible levels on the chart, behind which the price is not visible. Unfortunately, this only leads to losses. With constant practice and analysis of statistics, the trader will understand which constructions are best to use.
- Use high time periods . I recommend that novice traders conduct graphical analysis on an hourly or four-hour chart. At high periods there is more time for the formation of technical analysis structures. With constant work, a beginner will be able to trade without compromising his work.
- Do not move your stop loss . This rule allows the trader to develop. Beginners should not move their stop loss under any circumstances. Moving a stop loss is usually associated with a reluctance to receive a loss. But financial losses are an integral part of trading and you need to learn to accept losses.
- The combined use of inclined and horizontal levels in a trading system will improve trading. Signals at the intersection of two types of price zones give a greater chance of a global reversal.
These tips will allow you to develop in trading and not spend a lot of time on technical analysis.
What is level confirmation
In this case, these are touches at the cost of support or resistance. The levels are also confirmed and strengthened by false breakouts.
They are used to gain positions, capture liquidity at the best price, and manipulate smaller players.
In this article we will start from the price in relation to which the touches occur, that is, at which the limit player becomes.
Anyone who has ever been interested in trading from levels knows that there are priority levels (historical highs and lows), and there are secondary levels - internal ones, that is, those extreme points that are located inside these priority extreme points.
Within priority levels there may also be local extremes that rise or fall, forming local trends.
Entering a reversal trade
Let me remind you that the spread consists of three parts:
- previous trend;
- indecision candle(s);
- reversal trend.
You need to enter the trade after the second part closes (indecision), but before the third begins (reversal trend).
If you enter after the reverse trend begins, it will be too late. You also need to make sure you don't go in too early.
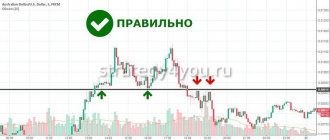
The image below shows the previous bearish trend leading to the support level. Then an indecision candle appears and a failed reversal trend appears. If you had entered too early, you would have failed on this trade.
There are unsuccessful transactions, nothing can be done about it. But entering at the right time reduces their percentage.
Many traders wait until the candle closes to make it as safe as possible to enter a trade. However, waiting until it closes results in you entering too late.
The image below shows the first candle after a trend reversal, closing far from the support level. This means you are missing out on a lot of potential profit.
The key to reversal trading (like any other) is entering the trade at the right time.
When to enter a trade
Over time, you will develop your best entry strategies. Now we will look at the simplest one.
When an indecision candle forms in a support or resistance area, you can use the high or low of the candle to enter a trade and set a stop loss.
In the example on the chart, a setup has been formed to enter a reversal downward trade.
We set the entry point a few pips below the low of the indecision candle and the stop loss a few pips above the wick of the candle.
Highs and lows are very important in trading. If a new low is created in the resistance area, it means that sellers have taken control of the price. This is a signal to enter Short in order to make money on a falling price.
The stop loss is set above the high because a break of the high would indicate that buyers have regained control of the price.
For Long trades, you set the entry a few pips above the high of the indecision candle and the stop loss a few pips below the low.
This is the simplest and most effective form of entering a reversal trade.
Now you need to know where to set your end goal.
Where to set a goal
To close the deal and take profit, you must set yourself a minimum risk-to-reward ratio.
For example, a ratio of 1:1.5 means that the target should be at least 1.5 times the stop loss size.
If the stop loss is 100 pips, the minimum target size is 150 pips (1.5 x 100).
If the stop loss is 75 pips, the target should be 112.5 pips (1.5 x 75).
Look at the chart and make sure that your target is above the resistance level (for long trades), or above the support level (for short trades). If there is a serious obstacle on the way, it is better to skip the deal.
In the image, the calculated target is above the resistance area, so we skip this setup.
The concept of gaining a position by a major player
“Why Do Extremes Move Up?” - you ask. The first thought that should arise in your mind is that if the price goes up or down, it means someone needs it.
The second thought is whether these internal (intermediate) levels are strong key points to which we can anchor our risk.
The thing is that the player does not gain a position one at a time, but buys everything that is offered in a certain price range. That is, the entire selected position will have an average price. In this case, it is similar to the averaging principle.
Let's look at what this principle is and what its essence is.
So, we gain a position in the range, so our loss floats along with the gained volume and the average price. It looks like this:
That is, the critical price when gaining a position becomes higher and, most likely, the player will defend the area close to it.
Again, I’ll make a reservation. We do not currently take into account the acquisition of a position by false breakouts, which improve the average price for the position.
In any case, simple false breakouts and even false breakouts by two bars do not reduce the average price much.
Support and resistance levels, rebound and breakout strategies. Do you want to know how to make money with them? Complete the “Reboot from Gerchik”! Find out more
Let's look further.
It's all just a mechanism. It is rarely possible to tell exactly where a player's position is without applying volume analysis, and no one knows how much risk a player can take.
How will we understand where the critical price is? This happens in the same way. We need a reaction, that is, confirmation of the level. If there is a reaction to the level—movement stops, touches, false breakouts—then the level is strong.
This is a daily chart where big players are gaining positions. Your task is to find the player’s trace, understand where his critical price is, where he is defending, and trade from the level from which this player is trading, because this is an important and understandable level.
Your trades must have an idea, they must be reasonable and they must have potential. When is the deal potential higher? When a trade is made either following a trend, or at the moment of fixing losses of a major player.
Advantages and disadvantages
Support/resistance levels are considered one of the most universal and objective analytical tools. They perfectly demonstrate the prevailing sentiments of participants in the market and provide the trader with maximum objective data.
By drawing levels or using indicators of support or resistance levels, a trader can be sure of the relevance of the strategy at any moment in the market. Many trading systems are becoming outdated and require timely correction and testing, but support and resistance levels always work according to the same rules.
The disadvantage of trading with this instrument may be that the trader most often has to make decisions based on the situation. The trader independently determines the reliability and strength of the levels and selects a place to place a pending order. And you need to be able to draw the levels themselves correctly, choosing the strongest ones and not cluttering the graph with many lines.
At first, working with levels may seem difficult, but even if a consistently high income is not observed, the trader gains invaluable experience: he learns to analyze events in the market, make forecasts, studies the peculiarities of movement and the algorithm for opening transactions in different conditions. To reduce the level of loss, you must set a stop loss, keep a journal of transactions, and carefully record successful and unsuccessful decisions.
Example of the Simple Breakout strategy:
The idea on which level development is based
1. Understandable risk of trading. 2. Understanding who will generate the movement. 3. Move potential.
Let's look at each of these points in more detail.
Forex risk is perhaps one of the most discussed issues. What is the understandable risk that is so often talked about.
But before we deal with risk, I want to draw your attention to the term “fair price”.
A fair price is the price accepted by market players. That is, this is a kind of accumulation (trading), in which the upper limit is expensive, and the lower limit is cheap.
Chart reversal setup
A reversal is one of the most powerful price action setups. Reversals happen quite often and are easy to spot on the chart. You can trade this setup exclusively and be a profitable trader.
The reversal setup consists of three parts:
- previous trend;
- indecision candle(s);
- reversal trend.
Let's break down each of these parts.
Previous trend
The previous trend is a strong movement of Bears/Bulls into the support/resistance area.
In the example above, you can see that this is a very strong bearish movement. It indicates that there are many sellers and very few buyers in the market. If the Bulls were strong, the price would not have a downward trend. The previous trend shows us that the Bears have strong control over the price and are pushing it down towards the support level.
The same thing happens with the previous bullish trend - Bulls have complete control over the price, directing it to the resistance level.
The previous trend can be formed by just one candle. It has a large body (red or green) and covers a large price distance.
If you see a strong move towards a support or resistance level, you can consider it a pre-trend.
Indecision Candle(s)
A reversal setup can have from one to several indecision candles. They should form on or near support and resistance zones.
If indecision does not form at or near the support and resistance area, it is not a valid reversal setup.
An indecision candle in a preceding bullish trend indicates that buyers are losing control of the price. And with a bearish trend, it means that sellers are losing control.
However, it does not mean that the price will necessarily reverse. It indicates only one thing - indecision
.
You can't make a deal purely because of indecision. The chart below shows several such candles between support and resistance. If we entered reversal trades at these points, it would lead to losses. You need to look for a candle only at support or resistance levels.
Reversal trend
The reverse trend is the third and most important part of a reversal setup. This is where we make our profits!
After the previous trend has stalled at support and indecision has set in, a trend reversal often occurs.
The image below shows a bearish reversal trend that formed after indecision at a resistance level. There was a transfer of power from the Bulls to the Bears.
But where to enter the trade? Let's discuss this further.
Examples of trading by resistance and support levels
What do we do when it's expensive? We sell! What do we do when it's cheap? Let's buy!
Of course, I don't mean that you need to buy when the market is going down. I'm talking about pro-trading or a range between two extremes (levels), that is, a channel.
If the price is above the lower level, then we join the buyer.
The idea of the trade is this. If the buyer protects this level, then he will also protect our stop loss, since it is not profitable for him to let the price go where he will receive a loss.
Is the risk clear? Yes! Is it minimal? Yes again! Is it likely that big capital will not want to lose their money? And for the third time yes! If you have three “yes”, congratulations, you make it to the next round!
Enter into a trade - this is the idea mentioned above. If the price is below the upper level, that is, the level that the seller is protecting, we go short if you have enough potential.
What is the trade idea in terms of risk? Do we have seller protection? Does he want to lose money? Is it likely that he will let the price go against him? If you have received answers to these questions, then this trade has a reasonable risk, and you can open a deal.
If you ask yourself this way before each trade and evaluate the level and your entry point through the prism of the answers to these questions, the likelihood of a positive outcome of the trade will increase significantly.
IMPORTANT!
You must understand that trading in the middle of the range without seeing the critical price means risking being left alone with the market. If you are trading at a critical price, you are no longer alone, a major player and his big money are with you, and this, you see, is already support, and quite good!
If a confirmed level is broken, then why do we understand the risk? Because when leaving the range there should be a strong movement, and the buyer or seller will defend it on the other side. So that the price does not return to the range. Because raising or lowering the price is the goal that he pursued. And he needs to fix the position.
In other words, in this situation we just need to change our ally. If someone was able to move the price that our major player was holding, it means he is stronger than him.
Our task is to be with those who are stronger, so we change the banners and forward again, but only in the opposite direction! Let's move on to the second factor of our transaction analysis: who will generate the movement.
Features of trading based on levels
Key price levels are present in any financial market, including Forex. Often, such conditional horizontal lines act as either support or resistance to further price movement, which is why traders show such interest in them.
These key marks are formed due to a large accumulation of buy and sell orders. When the price reaches such a congestion, the current strength of the trend, as a rule, is not enough to close all these orders and move the price further.
Therefore, if the movement does not receive support, the price turns in the opposite direction. If volumes appear on the market that can “break through” a large accumulation of orders, then it is very likely that the strength of the trend will be enough for further movement, that is, a powerful breakdown of the level will occur. Of course, events do not always develop only according to such scenarios, but these are the two most likely options.
Many years ago, even on stock and commodity exchanges, such levels were formed as a result of secret agreements between the big tycoons of the financial world. Together they controlled the market and could always either put an insurmountable obstacle in the way of the price or create a powerful movement. Nowadays, such conspiracies are very unlikely, but there are still large players on the market, whose orders, due to large volumes, influence the price.
Thanks to this, experienced traders only need to correctly identify such levels and signals that the price is most likely to reverse. The classic level is an area constructed based on the opening or closing prices of candles (not high/low), which the chart has already touched upon earlier.
That is, if the chart, having risen to a certain level, rolled back, and then again approached this mark, then the price value at the extreme will be that same level.
For example, a similar level was formed for EURUSD at 1.2213 on January 19. On the next trading day, the level was tested again, which gave traders the opportunity to open buy transactions and take profits.
What moves the market
Let's understand what moves the market. The market is driven by initiative or so-called market orders. Stop losses will also be market orders (this is a limit order, which, when activated, turns into a market order).
Let's go back a little and see how the price behaves when the level is broken. When a buyer's level is broken, the movement will be generated by the stop losses of this buyer (selling long positions) and the market orders of the entering sellers.
The larger the buyer's accumulated position, the stronger the movement on his stops should be. When the seller's level is broken, the movement will be generated by sellers' stops (buying out short positions) and market orders from buyers.
The stronger the seller's level, the better the movement will be. This needs to be taken into account when setting goals. Let's look at a picture that will explain to you why you need to keep the price above the level when it breaks out.
Let's start with the fact that each daily bar is the average daily volume that our buyer or seller absorbed. If the position takes 2 weeks to gain, what happens if the player exits immediately after leaving the range? A huge momentum in which this player will not win, but lose.
Let's look at this situation using the example of a seller who needs to buy back his shorts, locking in profits on sales immediately.
In order to make a profit at the average price of a position set, at least a gradual decrease in price is necessary. The price must decline within a few days for the seller to lock in his position at a profit.
What is Price Action
First, let's understand the essence of this concept. As mentioned above, Price Action is trading based on analysis of price movement without the use of indicators.
Any price movement comes from Bulls (buyers) and Bears (sellers). When the price moves up, there are more buyers than sellers, and vice versa.
The market is in a constant struggle between Bulls and Bears.
Price Action trading is an analysis of who currently controls price and whether they will continue to control the situation.
If your analysis shows that the Bulls are stronger than the Bears and this trend continues, then you can open a Long position in order to profit from the growth (buy).
If the analysis shows that the strength lies with the Bears, then you can open a Short position in order to profit from the fall (sell).
What does it take to assess the strength of Buyers or Sellers? We will need two simple Price Action tools:
Support and resistance levels
. These are buy and sell levels that you can easily identify and place on your chart. As soon as the price reaches them, it turns in the opposite direction. Or it breaks through and continues moving. This allows you to buy or sell at the right time.
Candlestick analysis
. Reading candles can give you a lot of useful information about the market and also bring you big profits. Once you understand them, one look at the chart will be enough for you to understand who controls the price - Bulls or Bears. And what should you do - buy or sell.
These two tools form the basis of this Price Action strategy. You can use them to find reliable setups (conditions for entering a trade) for trading.
Generating market movement through stop loss orders of a major player
Usually, when exiting with a stop loss, the seller enters almost immediately (we do not take into account price manipulation). That is, the impulse will be strong, and this will generate a movement to go long on the stops of the seller, who will compete with the buyer to enter the position at the price he needs.
This is called a market auction. The presence in the market of two unidirectional players competing for the best price. Only one for entry, and the second for exit from a position. This will be the answer to the question: how is the price movement in the market generated?
Setting stop losses and take profits
The stop loss should be set in such a way that an accidental movement against the direction of the transaction, for example, a retest of a level with a false breakout, does not knock the trader out of the market. It is impossible to assign a specific value (for example, 10 points) for this style of trading; when setting a stop, you need to focus on the chart and the “tails” of candles in the foreseeable vicinity.
For example, when opening a buy deal on the Australian dollar at a price of 0.7844, the stop loss is set at 0.7830, taking into account the fact that the price previously reached 0.7835-0.7834. By setting a stop loss with a small margin, the trader will not only protect himself from losses in the event of negative developments, but will also avoid an offensive closure on a slight downward fluctuation.
As for take profit, there are no strict rules for setting it. You can use the standard technique by multiplying the stop loss value by 3 or 4 and setting TP at the resulting distance. This is the right move from a money management point of view. However, in each specific situation, there may be prerequisites for obtaining greater profits than a standard stop loss provides.
For example, you can focus on the next key level in the direction of the trade. However, unlike a stop, you need to set a take in such a way that the price is guaranteed to touch it when approaching the key mark.
How to determine the sales potential of a position in terms of levels
We are left with one last factor that we need to deal with: “What is the potential for price movement?” If you don't have a level nearby where there may be a strong buyer and seller and you have enough runway to the next strong level, you will take profit on a long position at the next potential resistance.
The stronger the movement can be when a level is broken, the greater your potential movement can be. As we already understood, during a breakdown there is an impulse. The impulse ranges from 1 ATP (primary) to 3 ATP of the instrument. Let's look at the graph:
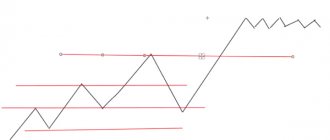
We already know what (or who) causes the price movement. Let's try to figure out who is moving the price in this case. We move from left to right. Double bottom. Two extreme points (highlighted by rectangles) from which the price moved upward.
This is our purchase zone, that is, buyers, just as in the highlighted rising extremum, put pressure on the price with a flow of purchases. Where is our seller in this situation? The border of the channel, that is, the point from which we went down.
When this extremum is broken, sellers exit their positions. We move up on the seller's feet and on purchases. Next, the movement stops, and we begin to trade, forming a support and resistance level. The range was held for a long time (11 days) and then it broke through the lower trading limit.
The seller turned out to be stronger than the buyer. The buyer capitulates and closes positions. The seller triumphs and fixes his profitable positions at the buyer's feet.
Along the way, fresh sellers are joining the movement. The market auction begins, where market players compete for the best selling price. And we have momentum. Planning a trade relative to levels.
Where is the clear risk for entering short positions? From the upper limit of the range on the test, where the critical price for the seller is, there he will lose money, which means he will protect himself to prevent this from happening.
Please note that we have not traded above this level for a long time. This increases the significance of the point, because the nearest resistance is very far away and the seller, when leaving the range, will not understand where else they can help him hold the price.
When a level is broken down, not only the pressure exerted by the seller, but also the stop losses of the buyer closing his positions will help generate movement.
Where are our potential support levels for profit taking? The level where there was a buyer (average price on the chart) that can remain in the market (highlighted by a rectangle).
Level trading strategy. Patterns for working with levels
1. Trading Strategy Before you continue reading about the level trading strategy, I would like to tell you that in reality this is a very complex type of trading. Levels and trends are good for history. Everything is clear in history, but during trading it is very difficult to interpret patterns. The chaos of the market is very difficult to systematize using levels and patterns. Beginners, when they look at a chart, have the illusion that the market is understandable. Here I would come in, and here I would leave. In practice, everything will be different. There are more reliable strategies. The same statistical arbitrage, despite the scary name, is much simpler for trading. Trading pairs is more stable than trading levels, patterns and signals of various indicators. In short, I gave you advice.
The level trading strategy is to look for strong levels on the daily chart, determine the type of market, and then look for an entry point on lower time frames in accordance with the model. The idea of this strategy is based on searching for traces of large players who build levels with their limit orders. Depending on the type of market, different models are traded. In a non-trending market, rebounds from levels and false breakouts are traded, and in a trending market, breakouts of levels are traded.
2. Support/resistance levels.
Finding levels using the same filters is quite simple. It is much more difficult to learn to understand the levels, how the struggle between buyers and sellers occurs, to understand who is winning at the moment in the market, what precedes the entry point. We determine strong levels on the daily chart, since it is on this timeframe that major players work. Usually, when trading this strategy, they start from the levels on the daily chart, then transfer them to the hourly and five-minute periods. A short time frame is needed only to enter a position and more accurately determine the place for the stop. The level system works because 3/4 of the time the market is in a range. A trader always needs to tie the price to something in order to understand what is happening in the market in order to correctly, for example, set a stop. The price can be tied to volume output, support/resistance levels. A strong level provides a comfortable entry point, a short and clear stop, and the opportunity to enter with large volume. What is a level? Any two points at the same price show us that there is a limit buyer or seller there. A point that is confirmed is a signal for us. We see that there is a bar that formed the level and a bar that confirmed the level. Next, we begin to observe this price level and see what the price does around it. This area of the chart becomes clear to us, we concentrate on it and trade this level. We are not interested in distant levels at this moment. After confirming the level, we wait for the price to fix above or below the level and open a position:
The gradation of levels by strength from weakest to strongest can be as follows:
- A level that has not been seen on the chart before.
- A level that has not previously been seen on the chart plus a round number (the importance of the round number is related to the option strike prices).
- A level that has been encountered before. Visible location of the level on the chart.
- The level that was encountered before, plus a round number.
- Double sided level. He is the strongest. When a support level turns into a resistance level and vice versa. Can be formed on one side even by a single bar. For example, a bar with a long tail:
You can combine signals and strengthen the entry point, wait for a strong level to form. For example, a two-sided level on a daily chart with a false breakout and entry along the trend:
The more hits the level receives, even from different sides, the stronger the level will be. In addition to strong levels, there are also strong points and strong zones on the chart. There may be a different classification of levels, points and zones depending on their strength. Below I have ranked them from strongest to weakest:
- Trend break points.
- Double sided level.
- Limit trading.
- Consolidation zones (floating level).
- The points from which the movement began, making a new high or low.
- A level built with unusually large bars.
The situation with the description of levels and their strength is further complicated by the fact that there are many nuances that strengthen or weaken a level. False breakout, gap boundaries, rollback depth, trend, what size bars the price approaches the level, whether the level is clamped in the channel, etc. Moreover, some things (for example, a false breakout) are important both for the level on the daily chart and for the entry point on a smaller timeframe. So let's get back to strategy. On the daily chart you need to identify key points. Key points are points that carry information where something happened. Important points are extreme points (reversal, rollback point), trading above or below the level. Extreme points are stronger:
Notice the graph in the middle. Levels formed by bars with tails are very strong. In the picture, this is a reversal formed by false breakouts. If a false breakout has formed at the lower part of the extremum, then we draw the level along the bar before the false breakout. It is important where the bar that falsely breaks the level closes. Its close must be higher than the close of the previous bar:
There is an important pattern associated with reversal extreme points. You need to look at whether the movement has formed a new high or a new top below the previous one. In the picture above, with extreme points, on the left chart, after a rollback, the price goes to a new high. Therefore, the retracement point (the lower retracement line in an uptrend) is an important level. If there is no new high, then this means that they are building a short position. The peaks are getting lower and lower:
Another reversal pattern is a chart that has bars with long tails and small bodies. This means that a position is being gained in this place. Long shadows are designed to collect stops. The level hit by the long tail will be the turning point. If a major player wants to collect a position through stops, then he places orders on the market to check the level. When such a pattern is formed, if we came from above, then someone is gaining a long position. They are trying to collect the feet from below:
Then the price usually goes up. You need to wait for consolidation and reduction of bars, wait for the point at which you can place a short stop. The same situation applies to the floating, fuzzy level, which represents the trading area. There we are also waiting for price consolidation, a place where we can place a reasonable stop. A floating level is a level that is constantly breaking through. After a vague trading area, we wait for someone to win. We are expecting consolidation above or below the level. If the price is above the level, then we buy, and if below the level, then we sell:
Trading near such trades should be avoided. Such areas are called “contaminated areas”. These are areas where buyers and sellers are densely packed and where it is unclear who is winning. There is no need to trade in such zones, because... they do not have clear levels:
The instrument needs to be traded near extreme points, where there is a struggle for the trend, where nothing holds the price movement, there are no areas of infection. Observe what the price does around the level and how it approaches it. A level that is gradually being pressed by small bars can be broken. The breakout pattern changes to a rebound pattern when the bars level off around the level: In the picture above, the buyer is no longer ready to buy, the dynamic buyer has left. You need to look at where the price will consolidate. If the price quickly declines to the level and consolidates, then most likely there will be a rebound. If it breaks through and consolidates below the level, then the movement will continue:
If consolidation appears in a trend and the price does not roll back, then the movement will continue:
There is one subtlety here. If the horizontal zone continues long enough, it may mean that the price has met support. A small pullback is better than a long horizontal zone for entering a trend. A strong pattern is steps (not too long), when there are no pullbacks in the trend:
On the daily chart you need to observe how the instrument closed. If it closes below a local minimum or maximum on the daily chart, then the position can be transferred to the next day, because we can expect a continuation of the movement, a continuation of the trend. Closing a bar below a local low is a strong short signal. It is also important to look at how the bar closes on the daily chart relative to the level. If the bar closes below the level, then open short, and if above the level (rewrite the local maximum), open long:
Although, in my opinion, we need to immediately make a reservation here and say on which instruments this works best. In my opinion, this works better in stocks. Futures are more raked instruments; they move more often in ranges. In general, I brought this picture to illustrate an important signal on the daily chart. You need to look at where the day closes, above or below the level. When a stock is in a range, it is impossible to say where it will go. Only when she leaves the range does the picture become clearer. If the price leaves the range when opening a position, the advantage in your favor creates a move towards the global trend. If the price is clamped by the upper and lower levels, then we are working in the direction of the global trend. The picture below shows the entry into a long position upon breaking through the upper level. Although, to be honest, I personally never liked such long entries on highs:
If the current price is lower than the previous day's closing price, then we call it a local downward trend. Longs will be considered counter-trend trades. Shorts will be a priority. If the current price is higher than the closing price, then the trend is up. If there is a gap, then we take the opening price and look at the current price relative to it. You need to watch how the issuer breaks through the level. At the point where there was a sharp movement of the issuer, there was a strong level. This means that in this place there was a player with a lot of money: If the level is broken through by the tail, then this is a false breakout, and if it is a candle with a large body, then this is a breakout. Another signal will be how the price moves. There are cumulative (in the picture below there is an example of the graph on the left) and distribution models (the right graph). In the accumulative model, the next day opens with a gap down to scare buyers into buying from those who exit at the opening price with a gap. On the right chart, the price is accelerated, an instrument is opened with gaps up, and the previously accumulated is sold to the crowd:
Gap boundaries are also very strong levels. The model in which the gap is combined with a false breakout is very strong:
False breakouts are very important, strong points. There are two types of false breakouts. Simple (all actions in one bar) and complex (two bars or several bars). A false breakout is the inability of the issuer to rewrite the high or low. A false breakout will show itself where the level will be:
For a complex false breakout, at least one bar must be above the level. The breakout bar is fixed above the level. Trades above the level will also strengthen the pattern. Stops are collected on false breakouts. The level can be broken several times with the highs pressed:
A false breakout is an after-the-fact phenomenon; it confirms the presence of a level. A false breakout can only occur relative to the previous level. Since a false breakout is a powerful tool for a major player to gain a position, false breakouts strengthen the previously designated levels, thereby confirming the presence of a major player. If after a false breakout the impulse does not begin, then you need to close the position. This means that the stops have not been collected, the necessary position by the major player has not been formed. It is important to understand where the level you want to trade from is located relative to other levels. Which level is located closer to the left on the chart, how far are the next levels located. Stronger levels are the levels closest in time to the left on the chart:
The level drawn by the green line can be stronger than the level drawn by the blue line. Most of the players who traded from the blue level could have already closed their positions. Trading from a level that is sandwiched by other levels is undesirable. An entry from the so-called internal level, which is sandwiched between support and resistance levels, has neither energy nor potential:
It all depends on the width of the channel and the ratio of potential to stop. If the channel width is at least 6 stops, then trading in the channel is allowed. Buying at the upper border of the channel is not advisable. If we are in the middle of the channel, then we measure the distance from the point to the channel boundaries. If this distance is more than 4 stops, then you can try trading in the channel. I would generally refuse to trade within channels. You need to wait for the price to go beyond the boundaries of the channel and consolidate behind them. Or wait for the model to enter near the borders. In this case there is more potential for movement. An internal level is important if a new high or a new low was made from this level. Then it looks like a continuation of the trend. This level will be protected by:
You must tailor your algorithm for levels and entries to your needs, based on your statistics, temperament, and how you understand the market. If you are starting out, trade each pattern (rebound, false break, breakout) for a few weeks to see what works best for you. When analyzing charts, don’t be lazy and write down why you like this particular level.
3. Entry, exit, stop points
The deal begins to be built from the levels marked on the daily chart, based on the understanding of who controls the market, buyers or sellers. Technical analysis, which we wrote about above, will help us with this. We are interested in levels close to the current price, taking into account the ATR of the instrument. We don't need very distant levels; they will clog up the chart. If we are going to trade in the medium term, then we need to note longer-term levels that may become relevant in a few days.
The level on the daily chart sets the direction of the trend. We look at where the price is relative to the level, in which direction the level is broken (if it is broken at all), and where the price has settled. There should be a power reserve on the chart. We look at the power reserve by the nearest levels, as well as taking into account the ATR of the instrument. When an instrument passes 75-80% of the daily ATR during the day, it is advisable to trade in a countertrend (if it is a ranged market and the issuer is clamped by levels). If an instrument breaks through a historical high or low, then countertrend trades cannot be made. ATR is only counted when moving in one direction. Those. if the price went up or down and then returned to the opening point, then the ATR will be zero and the instrument can be expected to continue moving that day. If an instrument is opened with a gap, then the gap must be taken into account in the ATR. Hep is part of ATR. Next, we switch to a short timeframe (hourly chart, 30-minute chart, five-minute chart - who is used to trading on which charts). The main thing is to choose one short timeframe and not jump to others. We transfer the level from the daily chart to the short time frame. On a short time frame, we watch the price behavior around the level and wait for the formation of an entry point and a suitable place for a stop. The entry point on a short time frame is a model in the form of a level formed by a limit order of a large player. On a short time frame, the entry model looks like several bars that go in a row and hit one point. The first and second bars must hit exactly the same price. The third bar may not reach the level a little, but cannot break through it. If the third bar breaks the level, then the pattern is considered broken. The only exception is Forex, because... There are many liquidity providers in this market. In this market, the third bar is allowed to break through the level by 1-2 points. Next, just before the third bar closes, we place a limit order and enter on the fourth bar. The order is placed not on the level, but nearby. If we make an entry against the global trend, then we need to wait for consolidation of more bars. In the picture below you can see what the variants of this model look like:
If the level is broken, then it is not a limit seller. In this case, you need to wait for the formation of the model again: If on the third bar the price moves away from the level (and closes) at a distance equal to the size of two stops or more, then the model is also considered broken. In this model, it is important that the stop is placed behind the level. If it is possible to place fewer stops when entering against the trend, then this should be done. When trading against the trend, you need to place a smaller stop size than when entering with the trend. The size of the stop depends on the volatility of the instrument, i.e. from ATR. The higher the volatility of the instrument, the larger the stop size. Stops can also be set based on technical analysis. For example, by the tail of the bar. If the level is strong and is formed not by four bars, but by a large number of bars (for example, 5, 6), then the stop can be placed shorter. If a strong level is broken, both short and long stops will be taken out. It's better to lose less. If you have determined the level correctly, then there is no point in losing on large stops. Next, I would like to consider the “false breakout” pattern. In case of a false breakout, breaking through the level and returning below it is already confirmation. The position is opened immediately after the stop order level. If this is a strong level and a real false breakout, then momentum will begin. Entering the stop behind the level is the only point where you can enter in this case so that the stop is of an acceptable size. If there is no impulse after entry, then you need to close the deal.
A false breakout is a strong signal and a lot of time is devoted to it in classes. If, when entering a false breakout, you were thrown out by the stop, you can enter again when the price goes below the level again. If there is potential in a deal, then you can enter several times. False breakouts will only strengthen the level. With a breakout pattern, you can enter a stop order immediately after a breakout or false breakout. The exit point can be determined either on a chart, at some level, or mathematically, as a risk/reward ratio. In the long run, you will earn more if you systematically close positions after the price moves in your direction by a certain number of stops. Those. It’s better to close not based on a signal on the chart, but when the price passes a certain distance from the entry point, tied to the size of your stop. For example, you can set the output point to be 1:3 or 1:4. You have placed a stop, placed a limit order to exit and are waiting to see which order will be triggered first. This approach removes unnecessary psychological stress. If the price passes the size of three stops, you close the position and take money from the market. You can go out in parts. Close a third of the position at a ratio of 1:2, another third at a ratio of 1:3, and keep the last third up to 1:4. It all depends on how much volume you are trading and whether your position can be split. For beginners, it is important to learn not to lose as quickly as possible, and then reach a volume of 2 lots, so that you can break the position in half and learn to sit out the movement. If you are just starting out and trading one lot, then set the ratio to 1:4, and when the price moves in your direction to the ratio of 1:2, move your stop to breakeven. Try different options, analyze the statistics, see which ratios turned out to be more profitable for you. There are a few more things to consider when trading. When choosing which model you will trade: breakout or rebound, you need to remember that in the first hour after the opening of trading, breakouts are traded. The levels begin to work later, when volatility begins to decline. As additional signals that strengthen or weaken a transaction, you need to look at indices. For the American stock market, we look at how the S&P closed and opened, where it is now, how key securities are traded in the sector in which you work. For the Russian Federation, you need to look in which direction the Asian market has opened, what is happening with oil, how the DAX is opening. You need to select the right securities for trading. If you trade American stocks, then select securities that trade in volume from 400 thousand to 5 million per day, with a price of 20-60 dollars. When selecting American stocks, we look at the trend on the daily chart (make sure that the trend has been for the last few days), and the power reserve. On a smaller timeframe, we look at intraday levels, how the paper holds them. We look at how the stock behaves so that there is no too high volatility and constant stop failures. On the first sheet, select stocks that have good daily and five-minute charts; on the second sheet, select stocks with a good daily chart or a good five-minute chart. On the third sheet there will be securities with a wide range, shares that move well intraday (more than $2).
4. Risk management, money management, statistics, psychology
In conclusion, I would like to say about risk management and money management. Set the risk for the day. For example, 1% of the deposit. Based on this figure and knowing the stop size, you will understand how many instruments and what volume you can trade. The fewer stops, the more volume we can take. You only set risk per day; you cannot set a monetary goal for profit (or in points) for a day or another period. The market simply may not move on some days, it may not provide an entry point, it may not allow you to make money. If you are trading several instruments with different prices and different stop sizes, then you must adjust the position size so that the risks and risk/reward ratios for the instruments are the same. You cannot trade both a cheap instrument with a small stop and an expensive instrument with a large stop in one lot. If you lose money on an expensive instrument, the profit on a cheap one will not compensate for this loss. You should buy a cheap instrument in large quantities so that the risks and potential profits are balanced. Also, depending on the risk for the day, the number of instruments and the volume traded, you can calculate the maximum number of losing trades you can afford to make per day. For beginners, it is recommended to set a maximum limit of three losing trades per day. If you lose 25% of your daily earnings, you also need to close your positions and stop trading that day. Be sure to keep statistics and analyze your transactions. You can use, for example, the Webmarketstat service. Statistics will show you where and when you lose money and what you earn. Do not start trading without external supervision from a risk manager. Use a special program from your broker that controls and limits risks. Don't rely on your discipline and algorithm. Most traders violate their own algorithm. There are actually two traders inside of you. One plans and the other executes. Often these two “people” are not friends with each other. Most people do not control themselves, so let the risk manager control you and your losses. Risk is the only thing that can be controlled in the market. Give control of your risk to another person or program independent of you. If you don't do this, you won't survive in the market.
Conclusion
A strong level is the level from which the player trades, and the place where its critical price is located. The relevance of a level shows us confirmation of a given level close to the current price; if the price bounces off the level, it means that the player is defending this level and it is relevant.
Trading from current levels will help you increase the percentage of positive trades. Your risks in the Forex market will be more clear and the potential of transactions will be greater, because from these levels there is often a strong movement.
These nuances should be taken into account when trading from levels, and then your trading will become more conscious and, very importantly, effective!
Don't forget to leave your opinion about this article in the comments!
What determines the strength of a level in trading?
A strong level is characterized by a high percentage of reversal. Let's look at the level strength indicators :
- High timeframe . If you use the time period D1 and above, you can see that the market in many cases turns on the daily chart.
- Strong impulse . If you mark the place from which the price impulsively flew in one direction, then in the overwhelming percentage of cases you can see the reaction.
- The price redraws past extremes . The place where the movement begins has the greatest power.
- Transition of support into resistance and vice versa.
- Number of touches. Here, each trader has his own opinion on the importance of the level. The more touches, the better, some speculators say. The latter use the level once.
What is the level of imbalance - we understand the terms
Imbalance is understood as a level that is critical for sellers and buyers. They try to break through it, test it several times, and many patterns are based on the chart’s reaction to this level. There are global and local imbalances:
- global - has a large weight, it is searched for in time intervals from M15. The conditions for the formation of GUD are stricter than in the case of local imbalance;
- local (aka LUD) – works even on the minute chart. The goals when entering from it are small.
Now more about each of the imbalances.
Round levels
Any level drawn at a price with one or more zeros is called round in trading. The more zeros, the stronger the level. For example, a price with a value of 5.2100 is stronger than 5.2190. This pattern is associated with the protection of round levels by large players. When you enter the market with large positions, tens or hundreds of lots, you place orders in advance upon request to your broker. Round numbers are easier to work with. That is why such levels often act as strong supports and resistances.
Fibonacci levels
The Fibonacci sequence or numbers were known in ancient India and Egypt as the golden ratio. But the magic number 1.618 - the ratio of the whole to the part - is also found in nature. The ratio of turns on a snail shell, the distance between leaves on trees, the ratio of parts of the human body obey the laws of this proportion. An Italian scientist described such a pattern in his works, after whom the sequence is called in our time. It also applies well to financial markets and is used in the form of levels calculated based on such numbers. If you superimpose Fibonacci levels on the current trend, you will clearly see the places where support and resistance are working out. Such information is the key to forecasting and entering the market.
How to correctly “pull” Fibonacci levels onto a chart
Today there is no need to calculate such proportions manually - the program will do everything. But it is necessary to set the start and end points for the correct location of the grid. The classic method of setting levels in the terminal will look like this:
- We mark the highest point of the last trend on the chart if it was downward. Click the left mouse button and hold it;
- Move the grid exactly to the end point of the trend and release the mouse button. Fibonacci levels are plotted.
In an upward trend, the opposite is true: we look for the lowest point and build levels from it. Now you can observe how the new trend, going in the opposite direction, reacts to the constructed levels. If the previous trend has not ended, then the grid is built incorrectly, and you need to find new peaks and valleys to reset the indicator.
To correctly construct Fibonacci levels, we determine the previous trend. In the example, it is descending with start (yellow) and end (blue) points. From peak values, from top to bottom, we “pull” the grid onto the graph. The new upward trend works out the levels perfectly. Observing the rebound and breakout from the lines, you can enter positions - a good entry for a correction to the 61.8% level and a rebound from it
Fibonacci levels in trading
Different numbers in the Fibonacci ratio have different strengths, and for a trend reversal, each level will work according to its own scenario:
- 8% is the first significant level, but the chart turns at it extremely rarely. Often serves as a good support or resistance;
- 100% – rarely a reversal. If the first wave that attacked the level has a deep correction, then the price may subsequently rebound from it;
- 2% – key level, reversal is likely;
- 8% – a reversal or at least a strong pullback or correction is possible;
- 8% – if the level of 200 is broken, the levels most likely have lost their relevance and it is necessary to switch to a larger time frame and reconfigure the indicator.
To improve trading efficiency, it is better to use the Fibonacci grid with other indicators and formations: moving averages, MACD, pin bar, candlestick combinations.
Additional Fibonacci levels
The classic built-in indicator will not show all levels, but the basic ones. To get more landmarks, you need to add individual options. For convenience, below is a table with all the settings.
| Percentages on the chart | Settings in the program |
| 14.6% | 0.146 |
| 23.6% | 0.236 |
| 38.2% | 0.382 |
| 50% | 0.5 |
| 61.8% | 0.618 |
| 78.6% | 0.786 |
| 86% | 0.86 |
| 94.2% | 0.942 |
| 100% | 1 |
| 118% | -0.18 |
| 127% | -0.27 |
| 138.2% | -0.382 |
| 150% | -0.5 |
.Now there are more levels, and the market can be monitored with greater accuracy.
MT4 indicators help to plot support and resistance levels
All MT4 indicators are divided into two types: some build zones, and others help in building . The first type is individual for traders and the list of programs is endless. When looking for indicators with line drawing, choose without redrawing.
Let's look at a useful Color level indicator for plotting on a chart . After setting the Color level, a panel with rectangles and slanted lines appears in the upper left corner of the terminal.
Download Color level for MT4 from the link. For MT5 the link is here.
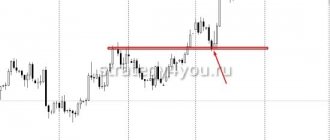
Changing the roles of support and resistance in trading
Any level in the market does not exist forever, but breaks through . There are frequent cases when support is broken and a retest occurs on the other side. In fact, a mirror level has formed or support turns into resistance. The example below shows a double option with further transition of resistance to support. That is, the price areas changed roles twice.
Working with Pivots and Fibo levels
The Pivot Points indicator and Fibonacci extensions also provide the position of significant levels. But in binary options, their use involves excessive risk.
Pivots, for example, do not take into account the position of previous extreme points. Support, resistance and pivot points are calculated using formulas that take into account extreme prices, as well as the opening and closing prices of the previous period. They can be used as a guide for take profit or stop when trading forex. But in BO you need an accurate signal; Pivots do not provide it.
The same goes for Fibo levels. We build them based on the previous strong movement; in the area of the correction zones of 38.2%, 50.0%, 61.8% there is a possibility of a reversal, but very often false breakouts of the levels occur and the price hangs around them.
How to find levels and plot them on a chart?
Before we start marking levels on the chart, first of all we must pay attention to the extremes, that is, the extreme points: the maximums and minimums of the chart.
As a rule, levels are usually marked on the chart with a red line, which is available in the MetaTrader 4 toolbar:
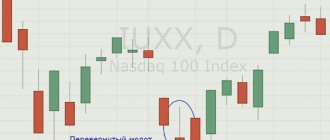
We draw levels at the extreme points of the candles, while trying to draw them through the zone of maximum density of bars. What does this mean? For example, on the chart we have an extremum point.
She stands out with her tail:
It would seem that you need to build a level along its tail, but if you look at the chart carefully, you can see that the price fought back several times from the obstacle that prevented it from going up. It is for this reason that we need to move the level just below the tail:
On the one hand, it is closest to the highest point, but at the same time passes through areas with the maximum density of candles. This gives a more optimal picture.
And I remind you once again that a level is not a line, but a zone. We look at the line, but remember that in reality it can have approximately this area of influence on the chart:
Let me note that the price does not have to reach our line point by point. It can turn around and go in the opposite direction without reaching the level we built. Therefore, imagine a certain zone and work within it.
How to understand that the level has been broken?
Sometimes there is a zigzag price movement on the chart. Because of this, it can be confusing which level belongs to what. The price zigzags and breaks through it back and forth.
Therefore, there is a very simple criterion for levels. To understand that the level has been broken, you need to look at the two closing prices of the candles at the level. If the level was broken for the first time, and then it was broken again, this means that the level was broken. There is nothing complicated about this, the main thing is to carefully follow the schedule.