In the last article, we got acquainted with oscillators - technical analysis indicators that “predict” further price movements. Today we will talk about an important property of these indicators - determining divergence and convergence in trading. Divergence in trading is a discrepancy between the data on the price chart and the indicator data. Convergence in trading is the convergence of the data on the chart with the indicator data. It’s not clear yet, right? This article aims to correct that.
Content
- Divergence in trading: examples and description
- Divergence trading rules - how to make money on divergence
- Convergence in trading: examples and description
- Convergence trading rules – use convergence to make a profit
- Hidden divergence in trading - how to trade hidden divergence
- Hidden Convergence – How to Trade Hidden Convergence
- Trading divergence and convergence along trend lines
- 9 important rules of divergence and convergence
- Divergence and convergence are formed in a trend
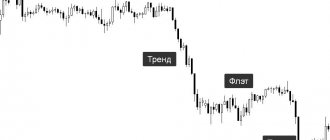
- Identify the trend correctly
- A trend follows a sideways movement
- Overbought and oversold are more important in determining divergence and convergence
- Connect the highs and lows correctly
- The maximums and minimums must coincide vertically
- Correct angle of inclination
- Divergence and convergence may not work for long
- The best signals on higher time frames
- Convergence and divergence - summing up
- Divergence
- Convergence
- Hidden divergence
- Hidden Convergence
Divergence in trading: examples and description
Divergence, in trading, is the discrepancy between the price chart and the indicator chart. In practice it looks like this:
- There is an upward trend on the price chart, and the price is updating its highs
- On the indicator chart, instead of copying price movements, each new high is lower than the previous one
Divergence is easily determined by such indicators as:
- MACD
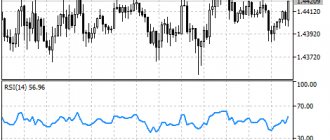
- RSI
- Stochastic
The rules for finding divergence are very simple - when updating highs on the price chart, you should pay attention to one of the above-mentioned indicators.
If the indicators copy the price movements, then everything is fine and we should expect the trend to continue. If the indicator readings are contrary to what is happening on the chart, this is divergence. For example, this is what divergence looks like when determined by the MACD oscillator:
If we consider the divergence using the Stochastic indicator, it will look like this:
Using the RSI oscillator you can also determine divergence:
In most cases, divergence predicts a slowdown, correction, or trend reversal. In any case, this phenomenon suggests that the upward trend has weakened very much, as the indicators tell us. Divergence can be used profitably in trading, but, of course, as in any other cases, there are no 100% methods for making a profit.
Advantages of the model and useful tips for traders
The main advantage of the signals obtained during the formation of divergence models is their versatility:
- They work on any timeframe.
- They can be used in both trend-following and counter-trend strategies.
- Regardless of the indication of a reversal, trend continuation or correction provides high accuracy.
A trader who uses such models in his trading must know a few simple rules:
- Divergence can indicate the nature of further market behavior, but does not indicate the scope of the movement. Therefore, when working with trend strategies, confirmation of a trend change is required, and when working with counter-trend strategies, additional tools are required to determine the level of correction.
- In any case, if you have open positions, divergence signals should attract special attention - this is a good time to increase or decrease their volumes.
Signals can be used as a reason to close a position or make a new deal. In the second case, goals for profit taking will have to be determined using appropriate tools - the resulting models will not help with this.
Divergence trading rules - how to make money on divergence
Divergence occurs in uptrends and signals a reversal, correction or stop in the trend - i.e.
about a possible movement against the current trend (down). It is the downward entry points that should be looked for after determining the divergence. Divergence is considered identified if there are at least two peaks on the chart (the second is higher than the first), and on the indicator each new maximum is lower than the previous one - there is a divergence. In such cases, a trade can be opened two candles later, after the divergence is confirmed.
It is important that the movement of these two candles is directed downward - so that a top is indicated on the price chart, after which you can look for a downward signal. At the same time, the indicator should also point to the top after which the fall began. This is best viewed on the MACD histogram (especially if it is colored - an increase in the histogram is indicated by one color, and a decrease in the histogram by another color).
If the fall began on the price chart, and the indicator did not react to this fall in any way, then we wait for the indicator’s reaction and only then count two candles, after which you can open a downside trade:
A downward trade should be opened for 3-5 candles. As a rule, this is quite enough for the transaction to close in profit. If we describe the divergence trading algorithm, it will look like this:
- The first local maximum on the price chart and in the indicator window coincide (it is not particularly interesting to us)
- The second local maximum on the price chart is higher than the previous one, and in the indicator window we observe that the second maximum is lower than the first maximum - a divergence occurs
- We are waiting for the formation of the second maximum on the indicator (it may not coincide with the maximum on the chart, but be sure to look at the indicator!)
- As soon as the indicator has formed a maximum and began to show a decline (the histogram or line moves down), wait for two candles and after them open a trade down for a period of 3-5 candles
To consolidate the material, I propose to consider one more deal:
In this case, the second maximum on the price chart and the second maximum in the indicator window coincide, so we count two full candles and open a deal at the beginning of the formation of the third candle. It's simple.
Convergence in trading: examples and description
Convergence, in trading, is the process of convergence of the price chart with the indicator readings. In fact it looks like this:
- There is a downtrend on the chart (downtrend)
- Price updates lows
- In the indicator window, the second minimum is higher than the first
As with divergence, convergence is easily determined by oscillators:
- MACD
- RSI
- Stochastic
Convergence is no more difficult to find than divergence: on the price chart there is a downward trend with constantly updated lows, and on the indicator each new low is higher than the previous one - this is convergence or convergence in trading.
If we look at examples of convergence, MACD will define it as follows:
The RSI indicator is also capable of determining the convergence of an asset:
And, of course, you can determine convergence using Stochastic:
Convergence indicates a possible trend reversal (from downward to upward), a price rollback against the trend, or a transition to sideways movement (consolidation). In any case, we should expect a movement against the current trend. In most cases this is what happens.
Convergence can be used just as profitably as divergence. The rules will be similar with one difference - trades after convergence are opened upward.
How do species diverge?
Sometimes convergence manifests itself in the absence of any organs. Thus, some volcanic islands are inhabited by wingless butterflies, flies and other insects.
So far, we have considered the processes that determine the emergence, inheritance, and maintenance of differences within a population.
Now let us dwell on the processes leading to the emergence of interpopulation differences and the emergence within a species of new forms, races, subspecies, i.e. Let us consider the initial stages of the process of speciation.
The process of speciation associated with spatial separation of populations is called allopatric speciation, while the emergence of new forms without spatial separation is called sympatric speciation.
Some researchers believe that allopatric speciation is the main way for the formation of new species.
The results of studying the ecological and geographical connections between closely related species in most cases undoubtedly indicate their initial spatial separation.
Let's look at some examples of allopatric speciation. Of the 1,200 species of fish east and west of the Isthmus of Panama, which formed in geologically recent times, only 6% are common to the fauna of both oceans - the Atlantic and the Pacific, while many other species are vicarious, i.e. geographically separated and long-diverted forms.
Convergence trading rules – use convergence to make a profit
First of all, you need to make sure that there is convergence:
- Convergence forms in downtrends
- Price minimums should be updated on the price chart
- The first minimum is not particularly interesting to us, but it should coincide with the minimum in the indicator window
- The second minimum on the price chart is lower than the first, but in the oscillator window the second minimum will be higher than the first
- We are waiting for the formation of the second minimum in the indicator window
- As soon as a local minimum has formed and the indicator shows growth (upward shift of the histogram or line), wait for two candles and open a bullish trade (we open the trade at the beginning of the formation of the third candle)
- Expiration time is 3-5 candles
Now let's move on to trading examples. The MACD indicator will be used as an oscillator that determines convergence (I like it and copes with its direct task very well):
In this example, you can notice two convergences going on one after the other.
In this case, you can trade both signals for an increase, because the graph moves from left to right, and we cannot predict the future. For variety, let’s look at another example of convergence, but using the RSI indicator:
Everything is just as simple here (if not simpler than using MACD). It is very easy to find a local minimum on the RSI, and after that all you have to do is wait two candles and open a bullish trade on the third candle.
Of course, trading convergence and divergence is fraught with risks:
- Divergence and convergence do not work out 100% of the time
- Pullbacks after divergence and convergence can be very short - 1-2 candles
- There are cases when indicators form false tops or bottoms, and after two or three candles they begin to form a top or bottom again - the signal is false, because by this time trades are already open
On the other hand, divergence and convergence work on any time frame, and the expiration time is calculated in candles, and not in specific minutes or hours.
Indicators for searching for models
It was said above that divergence (bullish or bearish) manifests itself on any oscillators. Beginners are often interested in the question of which indicator is used to consider such a model the most reliable. Experienced traders and most experts consider using the MACD indicator preferable for this purpose.
The main reason for this is the absence of the so-called in this indicator. "saturation zones". They are inherent in most oscillators (such as stochastic, RSI, CCI), since even the best indicators use calculation algorithms that require artificial delimitation of values (for example, for Stochastic and RSI at levels 0 and 100%). This introduces errors in determining divergences and interpreting signals.
However, indicators that use overbought (oversold) zones also have an undeniable advantage. According to the rules of technical analysis, all events that occur while the oscillator is in these areas are usually perceived as strong. Accordingly, we can talk about an increase in the strength of divergence signals during the formation of models in the corresponding zone.
In addition to oscillators, excellent results are shown by techniques using divergences (convergences) obtained when working with volume indicators.
Video: MACD divergence
Hidden divergence in trading - how to trade hidden divergence
Hidden divergence is a very rare phenomenon in which there is a discrepancy between the data on the price chart and in the indicator window. But everything happens differently from ordinary divergence. If we consider hidden divergence, it also occurs in uptrends, but we consider price lows on the chart and lows in the indicator window:
- The price moves up – the second highs and lows are higher than the first
- In the oscillator window, the second low is lower than the first
This is hidden divergence - there is a discrepancy, but it is quite “strange”:
Hidden divergence, unlike regular divergence, indicates a continuation of the uptrend, and not a reversal or rollback.
Simply put, hidden divergence determines the end of a pullback in trending upward movements. Hidden divergence trading is similar to the regular divergence trading algorithm:
- The first depression in an uptrend coincides in readings with the depression in the oscillator window
- The second depression on the price chart is higher than the first, but in the indicator window the second depression is lower than the first - a hidden divergence has formed
- We wait for the second depression to form and as soon as the indicator begins to show growth (the histogram or line begins to move upward), we wait for two candles, and on the third we open a trade to increase by 3-5 candles
This is a funny thing that allows you to find an entry point in the direction of the trending price movement. By the way, trading with the trend is much more profitable, but, unfortunately, hidden divergence is a rare guest (if you compare it with regular divergence).
conclusions
Summarizing everything said above, I would like to add that divergence in the stock market is a constant. So don’t worry about the fact that you haven’t been able to meet her in person yet. Be patient and wait for it to occur. this most powerful element of technical analysis . If you are the lucky one who found this manna from heaven on your work schedule, don’t hesitate and start taking action !
As your experience accumulates, the frequency of noticed points for entering a position will increase. Of course, you shouldn't make decisions based solely on discrepancies. Get familiar with the signals of other indicators, learn to work with setups and levels of resistance and support. Do not rush to trade against divergence . If you are not sure which way the market will go, it is better to stay out of the game. I wish you successful transactions, and see you soon! Don't forget to subscribe to my blog updates.
If you find an error in the text, please select a piece of text and press Ctrl+Enter. Thanks for helping my blog get better!
Hidden Convergence – How to Trade Hidden Convergence
Hidden convergence is another rare phenomenon that indicates a continuation of the trend, but this time downward. If we consider the nature of the occurrence of hidden convergence, we get the following:
- There is a downward trend in the market
- On the price chart, the right tops and bottoms are lower than the previous ones
- In the oscillator window, the right peaks (they are the ones that interest us in hidden convergence) are higher than the left ones
Convergence or hidden convergence occurs. Hidden convergence is worth trading in the same way as hidden divergence, but you should expect a downward signal in the direction of the current trend:
- The first top in a downtrend coincides with the top in the oscillator window
- The second top on the price chart is lower than the first
- In the oscillator window, the second top is higher than the first
- We are waiting for the formation of the second top, paying attention to the indicator
- As soon as the top has formed and the histogram or indicator line has moved down, we wait for two candles and at the beginning of the formation of the third candle, we open a trade for a fall - in the direction of the current trend
- Expiration time - 3-5 candles
Thus, ordinary convergence and divergence indicate a possible price reversal or the beginning of a rollback, while hidden divergence and hidden convergence indicate the end of the rollback and the continuation of the trend.
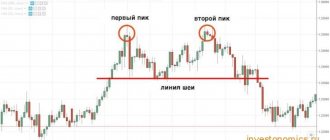
Trading divergence and convergence along trend lines
In addition to the method of trading divergence and convergence with identifying tops and bottoms, there is another method - trading along trend lines.
Let's look at it in more detail. Let's say we have identified convergence on the chart - it is formed in a downward trend:
The next step is to plot the trend line on the price chart. Since we have a downward trend, it is best to draw a resistance level - a line located above the price, drawn from the beginning of the trend through the tops:
We know the end of the convergence - the second depression in the oscillator window has formed and growth has begun. We wait for the moment when the candle breaks the trend line and closes behind it. We open a bullish trade on the next candle with an expiration time of 3-5 candles:
Hidden convergence trading occurs in exactly the same way:
- Determining hidden convergence in an oscillator
- Drawing a trend line - support level
- When the trend line is broken, open a downward trade for 3-5 candles
If we talk about divergence, then everything is exactly the same as with the convergence described above:
- Determining divergence on the price chart
- Drawing a trend line - support line
- When the trend line is broken, open a downward trade for 3-5 candles
Hidden divergence is worked out in exactly the same way as regular divergence:
- Hidden divergence is determined
- A trend line is drawn on the price chart - the resistance level
- When the level is broken, a trade is opened to increase by 3-5 candles
In my opinion, trading using a trend line has some serious disadvantages.
For example, a breakout of a trend line may occur much later than a trade “two candles after the second top or bottom has formed,” and this may result in the price retracement or reversal ending by the time the trade is entered. Another serious disadvantage that I see is the human factor. Each trader sees trend lines differently (there are no 100% indications), which means he may make a mistake in drawing the line, on which the quality of the signal depends. These problems do not exist (or are significantly fewer) in trading after the formation of the second top or bottom in convergence or divergence.
How do species diverge?
In animals, such factors are: chromosomal rearrangements, sterility genes and cytoplasmic isolation. An example of the latter is the following phenomenon established in mosquitoes (Culex pipiens). When crossing two forms from Southern (Og) and Northern (Na) Germany, hatchability in reciprocal combinations was as follows: 9 NaX o Og - 87%, 9 OgX cG Na - 0.17%.
All hybrids from the last crossing turned out to be females and contained only the maternal genome, i.e. they developed parthenogenetically. Consequently, Ha spermatozoa only stimulate the development of Og eggs. With the help of a series of backcrosses (HaxOg) xOg and further up to 50 generations, all three pairs of chromosomes of the Ha form were practically replaced by chromosomes of the Og form: The result invariably corresponded to the crossing HaXOg.
From this it was concluded that incompatibility in OgxHa crosses is caused not by nuclear genes, but by the cytoplasm. It turned out that the cytoplasm of the Ha form determines the inability of the sperm of this form to fertilize the egg of the Og form. Cytoplasmic isolation could conceivably be used to control disease-carrying insects by releasing a specific type of male into the wild.
Divergence and convergence as a source of profit
Divergence and convergence, as well as hidden “brothers”, are quite accurate sources of signals for opening transactions.
But, as with any other strategy, the trader requires experience and understanding of what is happening. There is one simple rule that saves me from losses - “if I don’t like something or something is unclear, then I don’t trade!” Do the same - if you don’t understand something now, then refrain from trading. Divergence and convergence will be a complex tool for many, and you should not delve into this topic just because it says here that it is “profitable.”
It is profitable for an experienced trader, but for an inexperienced one it is a complete failure and loss of money. Do you need it?! Of course, if you don’t try, nothing will work. You need to try, but you should gain experience gradually - you shouldn’t risk everything you have by trading using a method you don’t understand.
Trading has always been a marathon in which a trader gains knowledge gradually, the longer he is in trading, the more he understands. There is no need to make trading a sprint, shouting “I’ll learn everything in one day!” Don't study! If a topic seems interesting to you, but is still very distant, return to it when you have a clear understanding of what is happening and experience that will allow you to master the unexplored. Only in this case, any instrument, including convergence and divergence, will bring you profit.
- Previous Lesson: Oscillators in Trading: Using Oscillators in Binary Options Trading
- Next lesson: How to trade correctly on trends, pullbacks and during sideways movements (consolidation) + learn to identify trend reversals
Class C divergence
It is considered the weakest divergence and is recommended to be used in rare cases when you simply do not have other signals. In our opinion, this class of divergence is quite strong and should not be forgotten. It is possible that to confirm the signal, you should use knowledge of the trading volumes of a currency instrument. But let us repeat: C class divergence is a fairly clear signal and should not be ignored in your own trading. Actually, it is determined quite simply.
Bearish divergence : price tells us of a new, higher high; the oscillator forms a double top with approximately equal peaks. We consider positions in short.
Bullish divergence : price makes a lower low than the previous one; the oscillator forms a double flat bottom. We consider positions in long.