Beginning traders taking their first steps on Forex or any other exchange often hear the concept of “Flat”. It is used in analytics, trading strategies and indicators, on any exchange or binary options. Today we will shed light on what it is and how to trade Flat correctly.
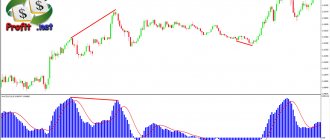
In trading, the term Flat means an area on a chart without a clearly defined direction of price movement, that is, a trend. In other words, a flat is the opposite of a trend. Here's what it looks like on a graph:
Flat is often called the following: sideways, saw, sausage, range (from the English ranging market - side market), consolidation. Here is a translation of some slang expressions that you can hear from traders:
- The price entered the range and a flat began.
- In the sausage market it’s the same, but here we may also have in mind Flat with a wide range of price fluctuations when the market is “sausage”.
- We are now sideways - there is a sideways price movement.
- I lost money on the saw - I lost money on a series of unsuccessful transactions in the Flat.
- There is consolidation in the market - in the Flat market.
Why do I take flat so seriously
Actually, I take everything related to stock trading seriously.
After all, any seemingly “trifle” can seriously affect your earnings, or even lead to losses. But flat is a more serious thing than gaps. I can’t imagine a single earning trader who could make money without understanding anything about flats. And I’m ready to argue about this for hours with those who dare to enter into the discussion. You definitely need to know what flat is in trading!
It is in the flat that a lot of money is lost or not earned. Therefore, guys, if you want to get what you deserve from the market, then be sure to read the article to the end. It’s better if you write your vision. Maybe I missed something.
How to determine a flat
Determining flats graphically
In fact, an experienced trader can determine the signs of a flat without using any special indicators, with the naked eye. To do this, it is enough to determine the lower and upper boundaries of the flat. These are support and resistance levels.
Flats indicated by lower and upper boundaries
But for beginners, you can also confirm your vision using technical analysis methods, it will be calmer. There are also some tools you can use to identify when there is a lull in the stock market.
Determining a flat using moving averages
Moving Average - moving averages. Don't forget that this indicator is a trend indicator. And it should be taken into account that such an indicator is lagging. First the candles will be drawn, and then only the moving one.
Such an indicator will help you enter the market on time only if this sideways trend lasts a very long time.
Prolonged flats in the market - the average lies on its side
Using the lag of the averages, you can take not one moving average, but three for work. When they intertwine, this is a clear signal of the formation of a sidewall. You can take the following average parameters:
| parameter 1 average | parameter 2 medium | parameter 3 medium |
| 4 | 8 | 18 |
| 5 | 10 | 20 |
| 8 | 13 | 21 |
Substituting the parameters of the first line 4,8,18, we get a better result. Of the three middle ones, the two fastest ones will line up when the side kick hits.
Three moving averages to determine the sideways trend. Although they are used to determine the trend
A lot of strategies include moving averages. They are very good at focusing on important points. But the parameters that I gave for practice are not a standard. It is necessary to select so that the signal delay is less.
Determining the trend using Bollinger Bands
This is a popular indicator among traders. And it was very clear to me when I got acquainted with different indicators. Bollinger Bands are a trend and volatility indicator. How to use it on the sides?
During sideways trading, volatility usually falls and Bollinger Bands narrow. Where the narrowing occurs, there will likely be a sidewall.
Bollinger Bands with the main parameter 20 to determine sideways
But that's not all. What I like about Bollinger Bands is that there is a second property that can be used to determine sideways.
Price movement between the lower and upper lines indicates a flat.
The price moves between the upper and lower Bollinger bands.
And if it’s already difficult to navigate, then we look for trends using the Bollinger bands, and the rest will be consolidations. Here's a hint to help you:
Finding the price between the middle line and the top indicates an uptrend. And between the middle line and the bottom line there is a falling trend.
Determining a flat using RSI
Oscillator RSI-relative strength index. If the RSI value is in the middle of the range, it indicates consolidation in the market.
Determining sideways using RSI
Construction of a price channel
It is believed that the simplest and most profitable price channel is the horizontal (flat) channel, the boundaries of which are the support level on one side and the resistance level on the other side.
Moreover, the width of such a channel must be at least 30 points so that it can bring good profits. Building trend channels does not take much time and effort. You simply need to draw trend lines from the two lows on the bottom and the two highs on top so that the trend lines are equidistant from each other.
It is allowed when individual Japanese candles or their tails go beyond the price channel, but in general, price rebounds from the channel boundaries should be observed. Over time, the price channel becomes outdated and additional channels need to be built. But do not rush to delete them, as the price may still return to them. /////////////// You may be interested in the article What is a trend in the Forex market. ///////////////
Narrow and wide flat
The distance between the lower and upper boundaries of the sideways shows the range of price movements. Accordingly, we can talk about a narrow or wide flat.
A narrow flat appears in situations of equality of supply and demand, when the forces of sellers and buyers are approximately equal. During such periods, as a rule, the market does not expect significant events and news.
Narrow flat on the 60-minute oil chart
A wide flat occurs when the price is between serious resistance and support levels. Neither sellers nor buyers have enough strength to overcome.
Wide protracted sideways trend on the daily time frame
Flat bonds
A bond trades unchanged if the buyer is not responsible for paying interest accrued since the last payment (accrued interest is usually part of the bond's purchase price). Essentially, a flat bond is a bond that trades without accruing interest. The price of a flat bond is referred to as the flat price, or net price. Typically, the flat price is specified so as not to distort the daily increase in the dirty price (the price of the bond plus accrued interest), since accrued interest does not change the yield to maturity of the bond.
A bond also trades flat if interest payments on the bond are required but the issuer defaults. Defaulted bonds must be sold without accrued interest and with delivery of coupons that have not been paid by the issuers. Additionally, if the bond settles on the same day that interest is paid, and therefore no additional interest accrues on top of the amount already paid, the bond is considered to be unchanged.
Reasons for the appearance of a sideways trend
Sideways don't just happen. A flat may occur for one of the following reasons, or perhaps in combination:
1.Reduction in trading volumes
It may occur, for example, on pre-holidays, public holidays, and vacation periods. Small volumes cannot have a significant impact and cause the emergence of a new trend.
Sideways trend in Rosneft shares before the New Year holidays
2.Waiting for important news or fundamental events.
We are not just talking about some financial news, this also includes anticipation of political events, interstate relations, etc.
Consolidation before the release of important news at 21-30 Moscow time
3.An equal number of offers to buy and sell.
In this case, the volume of transactions may be significant, but the demand is satisfied by the same amount of supply, thus balancing the market.
4. The presence of rumors or ambiguous decisions requiring additional clarification.
In this case, market participants may refuse to carry out serious transactions while waiting for the situation to be resolved.
5. Influence on the market of market makers and large companies.
They can artificially maintain a stable state by conducting appropriate interventions in the market, acting in their own interests.
Why traders don't like flat
It is always psychologically more comfortable to move in the direction of the trend, feeling the full power of the movement, and you feel completely different when there is no such support. During a flat period, volatility is low. Limited to a certain, relatively narrow price range. You need to monitor the market more often and be near the trading terminal.
There may or may not be more entries into the market. It all depends on the trader’s trading strategy and his emotional restraint. Earnings here are lower than with a good trend.
Again, predicting the development of events during a flat period is a very difficult matter. It often happened to me that I expected a sideways movement in one direction, but the market, contrary to technical analysis, went in the other. This once again suggests that no one knows where the market will go.
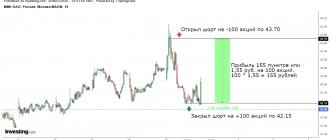
You need to work on risk management of your trading. In the example, after returning to the sideways position, I entered a short position, which ended in a loss. The price went the other way - up.
Sideways trading. The market suddenly went in the other direction
Trading on a rebound from the boundaries of the trading range
A rebound from consolidation boundaries is one of the best and most profitable trading setups in the price action system. There are several reasons that make range trading potentially beneficial for a trader. Let's look at the nuances and features of rebound trading.
Possible profit
The great thing about price action trading is the flexibility it offers. Price action can successfully fit into a variety of trading styles and offers many opportunities to customize your trading.
Consolidations can occur on different timeframes - H1, H4, D1. In most ranges you can successfully open at least two trades and even more.
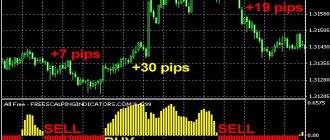
On H4 you can expect to make an average of 40 pips per trade, which over two trades will give you around 80 pips in profit. If a trading range forms on the daily chart, you can gain an average of 80 pips per trade. Thus, by making just 2 trades on the daily chart, you can make more than 160 pips of profit.
The profitability of trading ranges is unmatched. The main thing is to be able to open a deal on time.
Reliability
Consolidations provide ideal profit opportunities because they form between support levels and resistance areas, which are themselves buying and selling zones. Thus, when the price moves up, it enters the sell zone. When the price moves down, it enters the buy zone.
This gives us reliable points to enter the market. Let's look at some examples.
Above you can see a chart of the USD/CAD currency pair, which was in a range. The dotted line on the chart is the psychological level of 1.0000. This range had several trading opportunities that could be taken advantage of.
The reversal trading strategy was described in detail in the article Price Action Strategy for Beginners: Trading Reversal Setups. The basic idea is to find a directional move followed by an uncertainty candle at a support or resistance level.
I highlighted 5 rebounds that formed in the USD/CAD consolidation zone. Of the 5 trades, only the first one was unsuccessful. Since the trading range of the currency pair is 80 points, we can take 60 points of profit in rebound trades.
Trading strategy
You should focus on support zones (places to buy) and resistance zones (places to sell). Once the price reaches these areas, you can look for opportunities to open positions. Once your position is opened, you need to select the other side of the range to achieve your target profit.
If the price reaches your target, you can immediately enter a trade in the opposite direction. Trading consolidations is incredibly easy and requires minimal investment if you do it right.
Determining the range is simple. You just need to find two bounces from the support level and two bounces from the resistance level. When they occur, you will know that the range has been confirmed and you can enter the market.
Theoretically, you can enter at every touch from support or resistance levels, but this will be too dangerous. You will never be able to know when the price will leave the zone and breakout the level. If you are only looking for hopeful trade setups forming in buy or sell zones, pay attention to the price action patterns that should appear at the levels.
How can you not earn anything if you don’t care about flat
To begin with, I propose to define the term itself, what does it mean?
The word “Flat” defines the state of the market when the price jumps in a certain range (corridor) and does not have a clearly defined direction. In addition to “Flat”, this market situation is also called “sideways”, “consolidation” or even a “sideways” trend! These concepts are equivalent in meaning.
Many traders seek to trade in the direction of the trend, moving with the main crowd. What if the market has been flat for a long time, shouldn’t it work or something? And if this situation lasts for a long enough time, then you may not earn anything at all, waiting for a new trend to form. This, you see, is not a very fun scenario. Therefore, it will be very good if a trader learns to benefit by trading in a market that does not have a pronounced trend. All you have to do is make sure that there is definitely a flat in front of you.
How to do this?
About
How to make money on flat ranges
Before you start trading, you should make sure that the market is actually in a flat. After this, you can try to make money even on small price changes within the day session. In this case, the strategy will be like this:
We buy when the lower border of the corridor is reached, and sell when testing the upper level. Or vice versa.
A stop order should be placed outside the corridor. There are, of course, risks of false punctures with the order being triggered, but you should not trade without a stop loss.
There will always be punctures and stop losses when trading sideways. Therefore, take this into account in your trading. And there is no need to be afraid or upset of them. This is an investment in your business called Trading.
The second strategy when trading in a flat is to use signals about the beginning of a strong movement or trend. We place orders to open positions and wait for the breakdown of resistance (or support) levels. In this case, you can make good money. I wish I could always know when the sideways event will end!)))
Coming out of a sideways situation is an opportunity to get into a trend with the crowd
How to trade in a sideways market?
The best strategy for trading sideways markets is a false breakout. It usually provides a powerful impetus for price movement in the opposite direction. Market makers always collect traders' stop losses at levels to gain liquidity and then move in the opposite direction. This should always be taken into account when trading false breakouts. You can set take profit and exit the trade on the other side of the trading range.
If the market is too chaotic, its trading range is jagged, and the price moves too sharply and volatile, it is best to refrain from trading.
General conclusions on sideways trading
- It is better to trade in wide sideways. Then you can earn money and then relax until the end of the month.
- If you consider flats on daily timeframes, then the profit targets upon exiting the sideways trend will be more global. This means that you will have to wait for their achievement not for a couple of hours, but from one week to several months. My deal hasn't lasted for more than a month. I close with what I have.
- Oscillators can be used, but it is better in combination. For example, Bollinger Bands plus RSI, graphical method plus moving averages.
- There is no need to scour the Internet and look for magical oscillator parameters. There is none of them. It needs to be matched to the instrument. And this is again a temporary phenomenon. The market can change, and therefore the parameters of the oscillators.
- On New Year's Eve and May holidays, it is better not to conduct active trading. Everyone is already mentally on vacation. The picture on different instruments is different from year to year, but the volatility will still be lower.
- Don't trade in narrow corners. It is impossible to make money inside, but you can catch a strong trend on the way out.
- There is no need to look for side bars at any stops. Everything should be natural. In addition to you, other trading participants should also notice the flat, then there is a chance of a classic sideways realization.
- Your sideways trading should take into account that here you will receive a much larger stop-loss. And you shouldn't get depressed about it. If you have incurred losses, I recommend simply turning off your computer for a couple of days. This really works. You will always have time to lose, but to earn, you need to wait.
I hope, friends, that the article was useful to you. Now you should not have any gaps on the topic: “What is flat in trading.” Trade and don't take risks!
Types of flat betting
Which fixed bet size should I choose? Should you count in money or percentage? Should I recalculate the denomination after each issued coupon or is it enough to make adjustments once a day? We answer the most popular questions from beginners and tell you about each of the four types of professional flat:
- Academic.
- Static.
- Aggressive.
- Chaotic.
Try out the situations described below for yourself to understand which type of financial strategy will bring you profit over the long term.
Academic
The most democratic type of flat: the bettor himself determines the size of the bet (recommended from 0.5 to 2% of the total bank). Let's look at examples.
Situation 1
Ivan bets on football and tennis. He is well versed in football, shows decent ROI over time, but only plays the Premier League and La Liga. There are only about 1,000 matches per year, so the earnings are not too big, although stable. To increase his potential annual profit, Ivan joins tennis, where there are ten times more events. However, the ROI in tennis is very modest (1-2%), and series of losses often occur, since individual sports are less predictable, and this significantly “shatters” the bankroll. Sometimes Ivan makes good money on football over the weekend, but loses even more on tennis over the next weekday, so he reduces the bet size for the next round of the Premier League and La Liga and receives less profit.
To prevent this from happening, the player bets 2% of his bankroll on football and 0.5% on tennis. This way he smoothes out the dispersion from sensational tennis results and does not lose his bankroll before football tours. And most importantly, the same amount is placed on both sports per year (it’s just that four times as many bets are placed on tennis).
Situation 2
Peter plays only the NHL and makes two types of bets: with standard odds for totals (1.60–3.00) and against clear favorites (from 4.00 to 10.00). If you bet 2% on both 1.65 and 7.70, the chart will resemble a roller coaster: you can lose 20% in a day, and win 30% in the next day. You can’t lose all the money this way, but you won’t be able to achieve maximum profit either, since at the time of the upswing there may only be a third left of the bank.
Peter’s ideal solution is 2% for standard odds and no more than 0.5% for big sensations. Then the schedule will become smooth, the player will maximize profits at the peak and save nerve cells.
The key advantage of academic flat is the ability to make any bets with any odds, but at the same time avoid dangerous “staggering” of the bankroll.
Static
This is always a fixed rate - 1-2% of the bankroll. And only average odds (1.50–2.50) are suitable for the game.
The bet amount changes each time, depending on the balance: the more money, the larger the bet, and the less money, the more modest the coupon. Let's understand the flat betting strategy using a specific example.
Example
Player Vasily allocated 10 thousand - this is his initial total bankroll. He can bet on any sport, and most importantly, he always uses the same amount. 1% is ideal for starting.
The first day arrived, and Vasily chose six singles in the line with odds of 1.50, 1.80, 2.10, 2.20, 1.70 and 2.00. For each he must contribute 1% (100 rubles). The results are as follows: the first two bets were lost, the remaining four were successful. Vasily invested 600 rubles and received 800 (2.10*100 + 2.20*100 + 1.70*100 + 2.00*100). Now there are already 10,200 rubles in the account at the bookmaker’s office.
The next day comes - Vasily has four bets, all with odds of 1.90. But now 1% of the bankroll is no longer 100, but 102 rubles, so the player invests 408 rubles. to ordinary. But the problem is that all the coupons were lost.
At the beginning of the third day there were 9792 (10200 – 408) rubles in the cash register. Now 1% is 97.92. This is the bet size for each single.
Every day, before viewing the line, Vasily must evaluate the balance and determine the size of the bet. There is only one exception: if the coupon has not yet been calculated, then its face value is added to the bankroll, since the money has not been formally spent.
Advantages and disadvantages
Let’s highlight two main advantages of static flat that make this strategy perfect for careful bettors:
- Losing your entire bankroll is almost impossible: take a calculator and make sure that you will only spend 30% if you fantastically lose 50 singles in a row at average odds. To lose all 10,000 rubles, you need to make about 300 unsuccessful bets in a row.
- The strategy is ideally adjusted to series: when you constantly win, the bet size increases (profits are maximized), and when you lose more often, the bet amount decreases (losses are minimized). There are also disadvantages. Firstly, even an outstanding winning streak will not result in huge profits. Playing flat bets involves a very gradual rise, so in order to win significant amounts, you need to start with a solid bankroll. Secondly, it is important to keep the traffic rate at least 55%, otherwise betting will become unprofitable.
Aggressive
You need to bet 5% of your bankroll and never reduce the bet size. This strategy is used by professionals who place a small number of bets and only on the most predictable sports: the aggressive flat strategy in football betting is most justified. The logic is that the fewer bets, the better the events are analyzed, the lower the likelihood of negative variance and a long loss streak.
Example
An example is the player Dmitry, who is perfectly versed in the Italian Serie A. At the same time, he does not select all matches, but takes only one game of the tour, the result of which he is most confident.
Dmitry also starts with 10 thousand rubles. In the first round, he bets 5% on Juventus, but loses the bet - 9,500 rubles remain in the box office. However, in the second round, unlike Vasily, our hero again bets 5% of the initial balance, and not of the current one.
Suppose that, having lost several bets in a row, but without reducing the size of the coupon, Dmitry finally comes out in profit - 10,700 rubles at the box office. And only now the amount of the ordinary changes: now 5% is 535 rubles.
Summarize. Aggressive flat - 5% of the balance. The bet size is never reduced, but always increases if the player is in profit. The aggressive flat strategy works best in football betting.
Chaotic
Chaotic is similar to the game of a beginner or a drunk person: 1% is bet on some events, 5% on some, 10% on some. True, there is one important “but”: this approach is applicable only for matches of one specific tournament. This is the so-called “event bankroll”, which is divided into several bets, depending on the probability of their success. Let's look at an example again.
Example
Bettor Anton has 10 thousand rubles and a desire to play during the World Cup. During the entire tournament (including the playoffs) there will be about 60 matches, but there are some that, according to Anton, cannot be predicted and are better to be skipped.
As a result, Anton selects 30 matches and bets 2% of his bankroll on each in advance. But there remains another 40% that can be distributed on long-term bets. Anton puts 10% on France reaching the semi-finals, another 5% on the championship of Brazil and Germany, another 7% on at least three goals from Messi, and the remaining 13% is on the fact that all the favorites will leave the groups in the 1/8 finals. The more reliable the forecast, the higher the bet amount.
Anton used a chaotic flat and placed all his capital, but did it carefully: he has more than 30 bets in the game, and the chance of losing a large amount is negligible.