As you know, the exchange rate of currency pairs is determined by supply and demand, reflected in pending orders located in the so-called “glass”, and in already completed market transactions, expressed in trading volume. The value of this parameter, together with price behavior, is used to predict future movements - this analysis method is called VSA (Volume Spread Analysis).
Unfortunately, the specifics of the Forex market do not allow us to find out the real amount of funds spent on purchases/sales - the volume indicator reflects only the number of transactions carried out. Therefore, traders often resort to volume analysis using Futures and Options Open Interest. What kind of tool is this, where to look at the data, as well as specific application strategies are in our material.
Derivatives
Futures and standard (vanilla) options (not to be confused with binary options) are derivative assets or derivatives. In the classical interpretation, these are contracts that give the right to supply an underlying asset at a pre-agreed price after a certain period, providing for partial (collateral) payment of the cost of the volume.
Futures owe their existence to Sellers and Buyers of agricultural products. In the mid-19th century, deals were concluded in this way for future harvests, allowing producers to fix the cost of goods in advance.
It was also profitable for the buyer to purchase futures; at the end of the term, he received either a harvest or a return of funds, recalculated at the current rate at the time of calculation. Considering that a disruption in delivery could only be associated with a bad harvest, during which the price of agricultural products increased, the Manufacturer had to compensate for the difference from his own pocket.
In the 1970s, futures were standardized by the quantity of the underlying asset, called a lot, the size of the collateral - the collateral, the size of the margin, the price step, the duration of the contract - the expiration time.
Also, in addition to deliverable derivatives, settlement contracts appeared, where, with the help of clearing, the financial result was recalculated with the removal of negative or crediting of positive margin to the account of the Seller or Buyer.
Concept of Futures Open Interest
A future is a standardized contract valid for a week, month, quarter or year. This period is called expiration time
.
The number of futures is theoretically infinite - the exchange acts as the second party and issues a contract if a trader wants to buy/sell a futures and does not find a Seller or Buyer for it. The platform also keeps records of derivatives turnover, called clearing.
, checking the margin collateral of the derivative holder to prevent default on final settlement, which takes place on the last day of the futures or option expiration date.
The written contract remains open until the trader closes it by making an “offset trade”
– by purchasing an equal number of derivative instruments sold or by selling an equal number of contracts to the previously purchased ones (the total is zero).
Any exchange is required to report changes in public contracts, which are called " interest"
", and their volumes. Information about them is available to trading traders online (trading feed) and is publicly duplicated on the exchange (one or several times) during the day.
Futures open interest (OI) is the total volume of derivative contracts bought or sold held by traders.
As can be seen from the presented definitions, in contrast to the trading volume on exchanges and the Forex market, which states the fact of the exchange of money and assets, the OP characterizes the level of held or closed positions, most accurately reflecting the demand in the analyzed instrument.
Horizontal volume
Horizontal volume is loved by beginners and those who actively trade many assets and cannot analyze the chart for a long time. Serves mainly to search for levels and resistances.
In general, the thing is useless and it’s still not worth buying a subscription for this tool.
How to use?
The indicator shows only the volume whose candles are on the screen. If you move the chart to the left, then the volume will change.
This way we can open the Bitcoin chart taken from the Binance exchange and add an indicator. Thus, we will see the horizontal volume that was traded on Binance.
How to enable horizontal volume in tradingview
Again, using the / hotkey, call up the indicator search window, select the volume profile masonry and add the visible area indicator.
I recommend going to the indicator settings and changing the line size value to 100.
Such an indicator only shows the trade and nothing more, the rest you need to figure out yourself
Standard (vanilla) options
An option is a more complex financial derivative, sometimes thought of as a second derivative because it is always based on a futures contract rather than an actual commodity.
In simple terms, buying an options contract gives a trader the opportunity to insure an asset against falling or rising above/below a specific price. The value of an asset or the exchange rate of a currency pair is divided into strikes - round numbers in increments of 50 points. For each of them you can:
- Buy a Put contract, which assumes a profit from a fall below the selected level, equal to the futures if the contract were sold at the strike price;
- Buy a Call contract and receive a profit from growth above the selected level, equal to the futures profit if the contract was purchased at the strike price.
The insurance is valid during the expiration period - a month, a quarter, which coincides in terms with futures, but occurs a day or two later. The shift is justified by the accrual of a new series of deliverable options futures.
Like any insurance buyer, the trader only risks losing the cost of the premium paid at the strike, but retains the opportunity to profit from the rise/fall. The Seller immediately receives a profit from the transaction, since he is credited with the premium paid by the Buyer, but risks recording an unlimited loss at the time of expiration.
In reality, 80% of the premium paid goes to the Sellers, and the remaining 20% is compensated through complex strategies. Options are the only asset whose financial result and the size of the premium for each strike can be calculated in advance. Economists Fisher Black and Myron Scholes, who discovered the model for calculating the cost of a strike, received the Nobel Prize for this, and the company Long-Term Capital Management showed how you can make brilliant money and lose fantastically.
Another example of high earnings on option contracts was the strategy of the team of students - the creators of the Panda robot, who publicly presented the work of the algorithm at the “Best Private Investor” competition. The robot beat the market makers, increasing the liquidity of the derivatives market hundreds of times and achieving a profitability of 8000% in three months of trading.
The high profit was ensured by the “volatility smile” - a constructed curve of changes in the theoretical value of Put and Call option premiums, which made it possible to buy and sell contracts with a deviation from its values.
Unlike the spot or futures market, options, as befits a second derivative, have a non-linear change in the premium on each contract, which depends on:
- From time to the end of expiration it tends to zero;
- The speed at which the course approaches the strike;
- Volatility.
Open Options Interest
Unlike futures, where Open Interest is determined by a single value, options contracts have a separate OI for Put and Call, spread across each strike.
Open Interest of options is the total volume of purchased and sold Call and Put contracts, divided by price levels (strikes), separately for each type.
As can be seen from the presented definitions, in contrast to the trading volume on exchanges and the Forex market, which states the fact of the exchange of money and assets, the OP characterizes the level of held or closed positions, most accurately reflecting the demand in the analyzed instrument. Moreover, option contracts show the interest of trading participants at each price level - strike, which makes it possible to predict the direction of the trend and specify the moment of the quotes reversal.
Pros and cons of futures trading
Pros:
- Trading is carried out from 7:00 to 23:50;
- Free leverage is provided;
- For short positions, you don’t have to open margin trading and thereby avoid paying leverage;
- Wide selection of financial assets (indices, commodities, currencies);
- Great liquidity on popular instruments;
Minuses:
- Risks of hitting the price limit and not being able to sell the asset;
- Warranty coverage is constantly changing and this can create problems if large leverage is used;
- Not all stocks have futures, and for those that do, not all have good liquidity;
Related posts:
- Trading mode on the T+2 exchange - what does it mean?
- Investing in OTC Stocks - A Detailed Review
- Foreign exchange market, participants, nuances of trading - a detailed overview
- Applications for trading shares on the stock exchange - what they are and...
- Broker Sberbank - investment experience and review
- Buy Chinese shares for an individual - how to do it
- How to choose a broker for the stock exchange - what...
- How much can you earn by trading - detailed information
Futures on Forex currency pairs
Futures for currency pairs are present on many national exchanges, but the Chicago Mercantile Exchange (CME) is considered the international center for trading these assets.
This group includes several trading platforms operating on the same Designated contract market (DCM) platform. Its currency derivatives section has a dominant share of global turnover and the number of transactions in these instruments. As elsewhere, on this platform derivatives are standardized by contract duration, called a “series”
– week, month and quarter.
Since derivatives are a contract for the future price of an asset (in this case, a currency), they are traded long before the start of circulation; for example, a futures contract for the next quarter or month can be purchased “today.” At the same time, the quotes for derivatives of the current and subsequent series are approximately the same, therefore, in order to avoid confusion, each contract is designated by an international standard digital and alphabetic code.
Barchart
I learned about this resource about four years ago, and after trying many sites, indicators and scripts, I always returned to barchart.
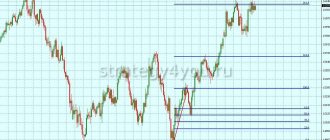
COT indicator on barchart. Large speculators are buying euros (highlighted with a green arrow), hedgers are selling (red arrow).
The net position indicator is plotted at the bottom of the screen. At the same time, the site provides one of the most visual options for displaying statistics on transactions of major players. Please note that on the daily time frame, the net position chart is stepped rather than linear. This construction format allows you to immediately determine whether the next maximum or minimum on the indicator has been updated. To do this, you don’t need to peer at the screen or try to “stretch” the indicator window (by the way, you won’t be able to do this on barchart).
COT indicator on barchart versus timingcharts (line chart at the bottom of the picture)
The illustration above shows a comparison of the stepped and linear options for displaying the net position indicator. A step chart is more visual, convenient and saves a lot of time if you have a lot of financial instruments on your trading sheet.
Reports on open interest in currency options on the CME exchange
Standard or “vanilla” options on the CME are the same as futures in terms of month and year markings. Currency options are deliverable, i.e., upon expiration, the trader receives futures for currency pairs that are the underlying asset. Otherwise they are very different:
- According to expiration dates - the exchange has contracts lasting a week, a month, a quarter;
- The underlying asset
of the option, a currency futures, is designated by two letters, rather than a number and a letter; - Open interest in contracts is indicated at each price level and is distributed over two types of Call and Put;
- Open interest is divided into in-the-money (ITM and ATM) and out-of-the-money
(
OTM) . The differences between ATM and ITM are described below.
The latter notation determines the current probability of the option buyer receiving the “insurance” premium.
The ideology of an option contract is that, unlike a futures contract, a trader can hedge future losses of an asset he owns at a specific price level, regardless of its current value.
For example, having bought the EURUSD currency pair at 1.10, you can each time purchase an “anti-fall” Put option, which will cover the entire loss with its premium if it happens that the dollar becomes one-to-one with the euro or even lower.
In this case, at a rate of 1.10, such a contract will have ATM status, which determines that the strike is equal to the current rate of the currency pair.
A fall below will provide it with ITM status , and the trader will be entitled to receive the premium on the option (in this example) Put.
If at the time of expiration the EURUSD rate does not rise above 1.10, the trader will receive a premium to the account and an open short at the current price of the futures 6E series of the next month.
A call is purchased as insurance against growth: for example, having bought it from the level of 1.145, a trader can safely short without worrying about a possible further rise in prices. Vanilla options are often called a “smart stop” - the premium will cover the loss received above the strike level minus the cost of the contract.
Often referred to as “intrinsic value” or simply “option premium,” it is the cost of insurance that the Buyer pays and the Seller receives.
Like futures, the other side of a buy/sell transaction can be either the exchange or the trader, so the Open Interest at each strike, which increases with each new contract written, is theoretically infinite and remains unchanged until the Seller or Buyer closes the contract "offset".
To access the data, the User performs similar actions as in the case of futures: opens the CME exchange website, finds the FX table and, going to a new page, clicks the Open Interest option on the left side panel. Three windows will open for him:
The reports required for forecasting and analyzing future movements of Forex currency pairs are located in the two extreme tables.
On the CME exchange, information about Open Interest in options is published twice a day - in the morning at 8-00 Moscow time in the preliminary report for the previous day, and before its opening at 17-00 Moscow time - in the final report.
The trader can observe changes in OI in the form of a histogram, in the left corner of which he can select (1) the currency pair of interest, the expiration month of interest (2) - the nearest (displayed by default) or distant (3), view weekly options (4), with the expiration date expiration on Friday (weeklies) or Wednesday (Wednesdays).
The table can be filtered by the number and type of displayed parameters in the “Settings” settings (5) or you can view the ROI for previous days (depth - week) through the list that drops out of the window (6), the type of published report is also indicated there: preliminary or final.
In the upper left corner of the table, you can update the report or download it in PDF format:
Direct analysis of Open Interest to predict the future movement of currency pairs is carried out using the following data:
1. Total CALL and PUT OP, divided into left and right tables indicating the percentage of ITM and OTM options;
2. Put/Call Ratio indicator, showing the ratio of “traded” daily volumes of two types of contracts;
3. Maximum values of RO Call and Put;
4. Strike and current price level;
5. Changes in total volumes for all series of options for the selected type of instrument;
Forecasting the future movement of Forex currency pairs using options is inextricably linked with the numerical value of the premium, which is located in the table (Options Board), where current and future contracts are combined with futures, for which the total OI is also displayed.
The table contains columns of strikes, each row of which displays the Call and Put premium separately, and the intensity of the green color of the cells shows the size of the Open Interest value at this price level relative to other cells.
Vertical
Vertical volume is a derivative from which other types of indicators are calculated, including horizontal. It can also be displayed graphically and is perhaps the most popular and, by the way, free indicator.
You can use it like this: Take two different candles. We need to analyze the volume under them and compare how many points the candles have passed and with what volume in them.
Example:
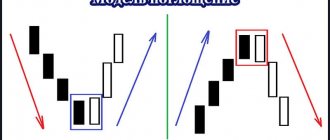
- First big full red down candle with low volume
- The second is green with a tail at the bottom and a not large body, but with a large volume
This situation suggests that there is buyer interest in this price and it’s worth waiting for a local move up, which means it’s too late to go short.
How to turn it on
In order to enable it, we will use the hot key / and enter the word volume into the search. That's what it's called. For convenience, I paint it gray #758696
From the screenshot you can see that I do not turn off the display of the average volume value. I also teach hotkeys that help you effectively use tradingview.
Why do currency pair quotes reverse from option levels?
Option levels are considered by Forex traders as lines of resistance and support, and therefore are used in a countertrend strategy for trading currency pairs. This ideology arose due to the nature of contracts.
The buyer of a naked option, who does not have a position in the underlying asset, receives a profit:
- From an increase in the Call premium as the rate increases and moves away from the strike at which the option was purchased;
- From an increase in the Put premium as the rate falls below the contract purchase strike;
In case of an incorrect forecast, the Buyer will only lose the option premium paid. In contrast, the Seller of the option risks unlimited loss, and the profit in the form of the premium paid by the Buyer will remain with him only if the option “burns out of the money”, i.e. The exchange rate at the time of expiration should be:
- Above the Put level of the sold option;
- Below the Call strike at which the contract was sold.
Therefore, the trader, in most cases, at the beginning of the contract period, will observe a picture of the maximum Put and Call Open Interest removed from the current quote values. Sellers will not write a large number of contracts at first-day prices for no particular reason. The maximum OI will be approximately at the edges of the volatility of the week, month or quarter.
Traders who bought Put and Call options much lower and higher than the current exchange rate of the currency pair (and judging by Open Interest, these are the majority), purchased them at a low cost, which will increase significantly when and if the strike equals the price.
But even if this condition is met, there may be no profit: over time, the option premium tends to approach zero as the expiration date approaches. Therefore, as soon as the currency pair approaches the strike, profit taking begins.
It differs from the foreign exchange and stock exchange markets, since a take profit cannot be placed on an option, because the pricing of the contract premium depends on many parameters described by the complex Black-Scholes formula. You can lock in the premium instantly by selling an equal number of futures against a Call option or buying against Put contracts.
The higher the open interest of the strike, the more futures will be sold or bought against the fall or rise of the currency pair. In theory, as the price increases or decreases, one can expect a gross growth of counter-trend transactions equal in volume to the OI of the strike price crossed by the quotes.
Thus, the size of Open Interest determines the probability of a trend reversal and the strength of the level:
- Resistances – by the number of open Call contracts;
- Support – by open interest of Put contracts.
The material provides a simple example of the operation of a mechanism that causes a reversal; in practice, option strategies are a complex structure of purchased and sold contracts of various types associated with currency spot and futures. In any case, the price movement causes a reorganization of the so-called exposure, which can lead to a reversal in quotes.
To find turning points, traders use monthly and weekly (Friday) options. The former provide the most significant levels of quote rollback, the latter guarantee this movement with less probability.
Countertrend strategy for trading currency pairs based on the levels of maximum OI of currency options
To find turning points, traders use monthly and weekly (Friday) options. The former provide the most significant levels of quote rollback, the latter guarantee this movement with less probability.
Many strategies on the Internet advise using each level, confirming the reversal using the formation of pin bars or technical indicators, in particular, oscillators. We will look at a strategy based entirely on Open Interest analysis.
Algorithm for working and analyzing the movement of currency pairs according to the levels of OI options CME
- On the CME website at 7-45 Moscow time (8-00) we tear off a visual histogram of the OP options for the next month, which is published in the preliminary report (Prelim);
- We determine the levels of the maximum OI Call (resistance) and Put (support);
- Let’s go to the “Options Board” table, where we find the cost of the premium for the levels of maximum OP Call and Put;
- We add the found values to the Call resistance, subtract the premium size in points from the Put support and plot the levels on the chart;
- Based on the calculated numerical values, we set the Buy limit (Put minus the strike premium of max. OP) and Sell Limit (Call plus the strike premium of max. OP) or enter the market if the current rate exceeds the found values;
- At 18-00 Moscow time (19-00) we check the positions of the strikes of the maximum OP Call (resistance) Put (support) in the final report, if the position changes, we close existing orders with profit (install used) or recalculate pending ones (Buy/Sell Limit) applications;
- If the order is activated, we set the take profit at the level of the Minimum Payout Point (at the strike level highlighted on the Max Pain histogram), stop loss at 150-250 pp;
- The algorithm for determining levels for weekly options is similar, but the series for the next month has a higher priority and probability of profit.
Setting up and algorithm for calculating option levels
Open the Open Interest Profile page of the CME website and select the middle OI & Settle Detail window.
Select the analyzed currency pair from the “Select Product” drop-down list. By default, EURUSD of the nearest expiration month will be selected, the date of which and the number of remaining days can be found in the window to the right of the instrument selection option.
Determine the maximum RO Call and Put strikes as resistance and support levels:
In the case under consideration, these will be 1.12 and 1.16, but the levels will need to be adjusted to the size of the option premium, which is known from the table values available in the Option Prices option.
- For a Put option, the premium is 15 pp;
- For Call option – 24 pp.
Thus, the actual location of the levels will be at 1.1215 and 1.1624. The premium changes daily, so the levels are dynamic.
We perform similar actions with weekly options, which are selected from the Weeklies section. We select the nearest week from the drop-down list and plot option lines on the chart; you can make them thinner to distinguish them from the levels of the month.
In the example shown, the levels will be: Put 1.1300 and Call 1.1450.
After plotting them on the chart, adjust the lines according to the option premium table, available through the Option Prices option, adding 39 points to Call + and subtracting 7 points from Put.
Tying it together
It's time to write our own script using some of the concepts we're already familiar with. We're going to combine the EMA and RSI and use their values to color the candles to create information that we can easily visualize.
This should not be construed as financial advice as there is no objectively correct way to use this indicator. Like all others, it should be used with other tools to develop your own strategy.
Now let's work on our new script. Remove all indicators from the chart and also hide the Bitcoin/BUSD chart so we have a blank canvas to work with.
Let's start by defining our study. Feel free to call it whatever you want, just remember to set overlay = true .
research (title = Binance Academy Script, overlay = true)
Remember our EMA formula earlier. We need to provide a multiplier with the EMA length. Let's make it an input that requires an integer (that is, no decimal places). Well, set, at a minimum, what it can be ( MINVAL ), and the default value ( DEFVAL ).
Study (title = Binance Academy Script, overlay = true) emaLength = input (title = EMA Length, type = input.integer, defval = 25, minval = 0)
Using this new variable, we can calculate the EMA value for each candle on our chart:
Study (title = Binance Academy Script, overlay = true) emaLength = input (title = EMA Length, type = input.integer, defval = 25, minval = 0) emaVal = ema (close, emaLength)
Big. On RSI. Well give it a length in a similar way:
study (title = Binance Academy Script, overlay = true) emaLength = input (title = EMA Length, type = input.integer, defval = 25, minval = 0) emaVal = ema (close, emaLength) rsiLength = input (title = RSI Length, type = input.integer, defval = 25, minval = 0)
And now we can calculate it:
study (title = Binance Academy Script, overlay = true) emaLength = input (title = EMA Length, type = input.integer, defval = 25, minval = 0) emaVal = ema (close, emaLength) rsiLength = input (title = RSI Length, type = input.integer, defval = 25, minval = 0) rsiVal = rsi(close, rsiLength)
At this stage, let's assemble the logic that colors the candles depending on the EMA and RSI values. Let's take a situation where (a) the candle's closing price is above the EMA and (b) when the RSI is above 50.
Why? Well, you may decide that these indicators can be used together to tell you when to open or sell Bitcoin. For example, you might think that both of these conditions being met means that now is a good time to enter a long position. Or, conversely, you can use it to tell you when not to go short, even if other indicators say otherwise.
So our next line will look like this:
study (title = Binance Academy Script, overlay = true) emaLength = input (title = EMA Length, type = input.integer, defval = 25, minval = 0) emaVal = ema (close, emaLength) rsiLength = input (title = RSI Length, type = input.integer, defval = 25, minval = 0) rsiVal = rsi(close, rsiLength) colors = close emaVal and rsiVal 50? color.green: color.red
If we translate this into plain English, we simply say that if the EMA value is above the closing price and the RSI estimate is above 50, well shade the candle green. Otherwise, paint it well red.
Then plot the EMA:
study (title = Binance Academy Script, overlay = true) emaLength = input (title = EMA Length, type = input.integer, defval = 25, minval = 0) emaVal = ema (close, emaLength) rsiLength = input (title = RSI Length, type = input.integer, defval = 25, minval = 0) rsiVal = rsi(close, rsiLength) colors = close emaVal and rsiVal 50? color.green: color.redplot(emaVal, EMA)
Finally, draw the candles, making sure to turn on the color :
study (title = Binance Academy Script, overlay = true) emaLength = input (title = EMA Length, type = input.integer, defval = 25, minval = 0) emaVal = ema (close, emaLength) rsiLength = input (title = RSI Length, type = input.integer, defval = 25, minval = 0) rsiVal = rsi(close, rsiLength) colors = close emaVal and rsiVal 50? color.green: color.redplot(emaVal, EMA) plotcandle(open, high, low, close, color = colors)
Here's the script! Add it to the diagram to see it in action.
BTC/BUSD chart with EMA/RSI indicator.
Features of reports on options on “reverse” currency pairs
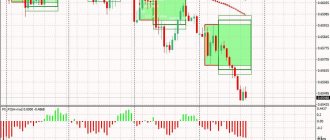
The CME exchange publishes quotes only in the “direct pairs” format, that is, USD is always in the denominator. Therefore, when analyzing USDCHF (other inverse pairs are excluded from the strategy), the trader must independently calculate strikes (divide the unit by the “table value”) and perceive the signals in a mirror manner:
- A fall below the Put level is a signal to sell;
- Growth above Call – buy;
The figure shows a visualization of USDCHF option levels, where the strike for the maximum Open Interest for Call and Put is the level of 1.055, showing a strong drop in the rate below these values. This means that the rate has risen above 1/1.055 = 0.95 and you should look for a selling point. Option premiums in the strike table are indicated in points, so they do not need to be recalculated; the levels are adjusted by adding and adding their values to the division result, in this case 0.95.
Tradingview
Tradingview is a resource that I use every day.
Reasons: convenient interface, a lot of financial instruments, the ability to create hybrid charts and add fundamental indicators (P/L, FCF, etc.) to the chart. The latter is a huge plus when analyzing securities.
Tradingview features. Apple Inc. Price (Weekly) and fundamental indicators: FCF Margin, P/S
I don’t know of free solutions that have this functionality, and the options described above significantly complement and simplify the process of analyzing financial markets.
Tradingview features. Gold price to platinum price chart
Rules for buying and selling a currency pair using a countertrend strategy for analyzing option levels
The strategy uses only the maximum interest levels of the option of the current month and week. Every morning after the report is released, around 8-00, the trader plots and adjusts, according to the premium, the levels of maximum Call and Put interest for each currency pair.
A limit order is placed on the received values:
- Sell limit on a Call option with maximum Open Interest;
- Buy limit on a Put option with maximum Open Interest.
The report must be checked again in the first hour of the start of the American session for changes in the position of option levels compared to the previous report. Any rearrangement is a signal to exit the position: on the first day at the entry price or with profit taking, on the second day – with the current loss.
Stop loss and take profit
It is advisable to use a high stop loss level - from 3 to 5 strikes. Options for major currency pairs have a standard step between strikes of 50 points, as can be seen from the tables, so the optimal stop should be 150-300 points.
If quotes have crossed the resistance/support level for the first time, it is advisable to set a loss limit for the second session, after the order is triggered, or actively use a grid strategy, the second leg of which is placed at the cost level of the “central strike” (the amount of the option premium at the price level boldly highlighted in the report CME).
Ideally, the grid should end with the maximum premium of the central strike on the first day of trading of the new option series, and the position should be held until the last day of expiration.
Take profit should be set at the Max Pain strike level - it is considered that this is the Minimum Payout Point (TMP) or the minimum total losses of Sellers and Buyers. The exchange rate of a currency pair will always tend to this point of “relative equilibrium”. To find out its value, click on the “Max Pain” option on the left panel; the TMB strike OP will be highlighted in a separate frame.
It must be remembered that no one guarantees that the rate will necessarily reach the Minimum Payout Point values!
Important features used when trading currency pairs using option levels
- Entry into weekly options must be made before Wednesday; pending orders are canceled on Thursday.
This tactic is associated with a sharp outflow of liquidity into options, which begin on Wednesdays.
- Rolling - moving the Maximum Interest levels in 80% of cases predicts a strong movement or trend change - Call or Put to the right predicts an increase in the rate, Call or Put to the left predicts a fall.
Options sellers maximize profits by selling options closer to the current price, or minimize losses by writing contracts as far from the current price as possible, having the inside knowledge to predict in advance the direction of price changes in the future. As described above, the Seller’s risk is “infinite”, so this work requires accurate forecasts.
The error of this method of analysis is due to the fact that it is possible to confuse the rolling signal with a simple movement of the OP due to the depreciation of the premium - the time decay constantly affects it and the positions. Therefore, traders can simply exit options that are no longer worth anything.
- Reversing the levels with the maximum open interest Put and Call is a signal to prohibit opening a deal.
Traditionally, Option Sellers offer a Call above the current price level and a Put much lower, increasing the likelihood of the contract ending OTM - out of the money. If the levels are reversed, a complex combination of option strategies is operating in the market, this will, in most cases, lead to a strong rise or fall with no reversal.
- The importance of continuous analysis (from day one) of a new option series.
The option premium changes daily due to time decay, but, as practical experience of working with maximum OI levels shows, the first point of intersection of quotes and the found level is important. An attempt to enter short “lower” or long “higher” based on analysis, without taking into account the previous reversal, can lead to a loss.
Since the strategy is counter-trend, the exchange rate may return to the maximum values reached, or the resulting level rolling signal will force the trader to leave the position with a loss.
How is Open Interest calculated?
Open interest is calculated by adding all contracts associated with opening trades and subtracting all contracts associated with closing trades. For example, if three traders (Trader A, Trader B and Trader C) trade ES futures, their trades could affect open interest as follows:
• Trader A opens a long position by buying one contract. Open interest increases to 1
• Trader B opens a long position by buying four contracts. Open interest increases to 5
• Trader A exits the position by selling one contract. Open interest decreases to 4
• Trader B opens a short position by selling four contracts. Open interest increases to 8
Calculating open interest becomes more complicated if we take into account that each trader buys/sells from another market participant, who, accordingly, sells/buys. Sometimes both sides enter into trades, increasing open interest. At other times, one of the parties will close their trade and the other will open it; this will not have an impact on open interest. It could also be that both sides will close out their trades and open interest will decline.
So open interest is not the same as volume. Volume increases regardless of whether a position is opened or closed. In the case of open interest, it increases when opening trades and decreases when exiting positions.
You may be interested in the article “COT Reports“.
Examples of transactions on currency pairs, based on the analysis of options levels
The strong fall of EURUSD led to the fact that quotes ended the Tuesday session at the floor, which was reflected in the rate “flying” beyond the Put level of the weekly WEDNESDAY option (expiration on Wednesdays) located at 1.1400.
According to level calculations, the option premium at this strike was 73 points, which means that at the time of the first day of action, the current rate was below the calculated entry level of 1.1327 at 1.1288, so the long was taken on the market.
After entering the market, a stop loss was set at three strikes at the level of 1.1150 and a take profit determined from the Max Pain histogram readings at the level of 1.14, where the previously taken long was closed with a profit of 100 points.
The expediency of buying a weekly option on EURUSD is explained by the fact that at the beginning of the December series of monthly contracts, the magnitude of the fall was “not enough” to trigger a pending buy order.
According to the levels of maximum Open Interest, Put was located at around 1.12.
Even without calculating the premium level, a change in which would require the support line to be lowered even lower, it is clear that the reversal occurred before reaching 1.12.
A different situation arose in the December series of monthly options: the CALL levels of the USDCHF pair already on the first day of trading turned out to be significantly higher on the CME chart of the current price, which meant a short signal due to the need for their mirror transformation. After dividing one by the strike, we got a resistance value of 0.955.
Options of the month have a very high premium at the start of trading, the table indicated a correction of the resulting line by plus 550 points, i.e. to a value of 1.0, where a pending short order was placed, which was triggered on the second day after the start of trading in the option.
At the moment, the trade brings a profit of 150 points, and the Max Pain level is quite far away, so it makes sense to set breakeven.
In December options of the AUDUSD currency pair, the level of the maximum Open Interest Call rolled. As a result of changes in positions by market makers selling options, the histogram column moved to the left, which is perceived as a signal of a future fall. According to Friday's reports, the maximum OI was at a strike of 0.75, but on Tuesday it shifted to the level of 0.7250.
Rolling coincided with the fall in the rate, but in this example I would like to draw attention once again to the word “coincided”, because the real reason for the shift in the maximum OI was a temporary decay, which led to a decrease in the cost of the premium to 5 points.
In this case, the displacement is perceived as an indirect signal, but the fact that the market makers left the max. without movement. Put OI indicated a possible continuation of the correction.
How to add COT indicator to barchart?
The link to the euro chart with the COT indicator added to it looks like this:
https://www.barchart.com/futures/quotes/E6Z17/technical-chart?plot=CANDLE&volume=0&data=DO&density=O&pricesOn=0&asPctChange=0&logscale=0&indicators=COTLC&sym=E6Z17&grid=1&height=500&studyheight=200
Let's assume that we are interested in the British pound. To display the COT indicator on the chart you need to:
- Select a financial instrument in the selector:
- On the page that opens, select the futures contract that is most actively traded (the largest Volume), for example B6Z16 (this is the British currency code, December 2022 contract):
- In the huge link presented above, replace the tool code with the current one (E6Z17 to B6Z17). Only the code changes (for example, for Mini S&P500 it is ESZ17, for gold - GCZ17, for ruble - R6Z17, etc.):
- We get a ready-made link, which, when clicked, opens the price chart and the COT indicator:
https://www.barchart.com/futures/quotes/B6Z17/technical-chart?plot=CANDLE&volume=0&data=DO&density=O&pricesOn=0&asPctChange=0&logscale=0&indicators=COTLC&sym=B6Z17&grid=1&height=500&studyheight=200
This is not the easiest, but the most effective way to add the COT indicator to a barchart chart. Contract codes are easy to remember, and after some time a new financial instrument will be opened in a few seconds.
An alternative option is to save the received link to your bookmarks and access barchart as needed. In this case, you must remember that the code of the current contract will change approximately once a month, and the link will have to be updated periodically.
Pros of barchart:
- one of the most visual options for displaying CFTC statistics
- COT indicator updates automatically
Disadvantages of barchart:
- You cannot “rewind” the chart to the past; to do this, you must select a different trading period or contract
- an intricate way to add an indicator to a chart
- no splitting into LONG and SHORT for each group of participants, only net position