For MT4, the number of different indicators has long been in the hundreds, if not thousands. In addition to the standard ones, a trader can independently load any custom algorithm into the terminal, and if he has programming skills, he can even write an indicator himself. It is very difficult to select the best from this mass.
But we tried to collect in this review the most prominent and popular representatives of the field of Forex analysis, and bring out a certain Top 10 indicators that you can successfully use when independently analyzing and trading on the currency market. So let's get started:
How the rating of forex indicators was compiled
All indicators can be divided into 2 large groups:
• standard - those that can be used immediately after installing the trading terminal;
• custom – they need to be downloaded/purchased and downloaded, and then installed in the terminal.
Among the standard indicators, it is relatively easy to create the top ones; almost all traders know them, but among the custom ones it is difficult to select worthy ones. There are too many of them and not all of them have usage statistics and reviews from traders.
We decided to compile 2 separate ratings - one small one based on standard indicators, and the second one based on custom ones, more advanced.
Choose the BEST broker:
| Olymp Trade | |
| Deposit from 5$ | |
| Bet from 1$ | |
| FinaCom PLC | |
| There is a demo account | |
| START TRADE | |
| FULL REVIEW | |
| Binary | |
| Deposit from 5$ | |
| Bet from 2$ | |
| MFSA | |
| There is a demo account | |
| START TRADE | |
| FULL REVIEW | |
| FiNMAX | |
| Deposit from 100$ | |
| Bet from 5$ | |
| TsROFR | |
| There is a demo account | |
| START TRADE | |
| FULL REVIEW | |
Rating of standard Forex indicators
Among the standard indicators, the following deserve attention:
• moving averages - the indicator is as simple as possible, but can be used both to determine the state of the market and as a support/resistance level; if you move the MA vertically, you will get a channel, the breakout/rebound from whose borders is so convenient to trade. And several MAs with different periods will allow you to determine the moment of trend formation. Moving averages are used in many custom indicators as an auxiliary tool, although they may not be displayed on the screen;
• Stochastic - in areas where there is no pronounced price movement, this particular oscillator works great. Excellent for strategies in which the market is entered at the end of the correction;
• RSI - relative strength index. It is used for the same purposes as Stochastic, it also works well during a flat, but during a trend it gives a lot of false signals. It has been known to traders for decades, but during this time it has not lost any relevance;
• MACD is an unrivaled tool for searching for divergences on a chart; a lot can also be understood by the position of the histogram relative to the zero level. A lot of custom indicators have been created based on MACD;
• Bollinger Bands - the algorithm is selected so that the price, with standard parameters, remains within the bands for approximately 95% of the time. The style of working with the indicator follows from this - it is excellent for trading on rebounds from channel boundaries, you just need to supplement it with several filters;
This is where we finish with standard indicators. They could be listed for a long time; we did not mention the Commodity Channel Index (CCI), ZigZag, volume indicator and many other worthy algorithms. This did not happen because they are bad or have lost their relevance, it’s just that most traders are familiar with them, and we agreed to pay more attention to custom indicators. Among them there are real pearls.
Laguerre indicator
This indicator has a rather unusual history of creation. Its author has worked for many years in the industry related to the production of equipment for working with aerospace signals. His responsibilities included the development of algorithms for smoothing signals and eliminating interference; later he applied his developments to create his own oscillator.
The history of the creation of this indicator is an attempt to find a balance between the delay in receiving a signal and its reliability. Everyone is familiar with the situation when, in order to increase reliability, a trader increases the period of, for example, a moving average, but ultimately receives a large delay in receiving this signal.
The calculation algorithm is complex, so let’s move on to the settings; you can only change 2 parameters:
• gamma – is responsible for the speed of the indicator’s response to price changes; as this parameter increases, the oscillator line becomes smoother, but the lag also increases. Default gamma = 0.7;
• countbars — sets the number of candles on which the indicator will calculate.
On the Internet, in addition to the standard Laguerre indicator, there is also a small modification of it, in which there are many more settings and the points of intersection of the indicator line with the levels are additionally indicated. The calculation algorithm does not change.
There are several signals:
• the line crossing the 0.75 level from top to bottom indicates a likely downward movement, the price has left the overbought zone, crossing the 0.25 mark indicates an exit from the oversold zone and likely further growth;
• identification of the market state - if the indicator line is below the 0.5 level, then we give preference to sales, if above, then to purchases.
Even the indicator itself does a good job of catching any price movements. But we still do not recommend trading only based on its signals; add a couple of filters. You can combine several Laguerre indicators with different Gamma values.
You can download the Laguerre indicator here
Black Gold indicator
This tool is interesting because it allows you to find out the price of oil in rubles. This gives traders a couple of interesting opportunities.
In order for the indicator to work correctly, it must be attached to the oil chart, that is, to the Brent/USD chart (in the terminal it will be designated as BRN or Brent). In the settings, be sure to indicate the name of the USD/RUB currency pair. As a result, the indicator multiplies 2 fractions Brent/USD x USD/RUB = Brent/RUB. The Trading View service provides the same opportunity, but you will have to pay about $30 per month for access to full functionality. Here you have the opportunity to get a spread chart absolutely free.
After launch, if everything was done correctly, you will see this picture. The price of oil in rubles is displayed at the bottom.
There are several use cases:
• look for discrepancies in the oil price chart in dollars and rubles and trade on the assumption that this discrepancy will certainly smooth out;
• you can reduce the scale as much as possible on the indicator itself, outline oversold/overbought zones and trade at the output of the indicator line from them. The idea is this: when the price in rubles rises too much and reaches extreme values, the fall of the ruble may stop. When it is possible to earn less and less for oil in rubles, the Central Bank may slightly lower the ruble in order to equalize revenues to the state budget in rubles. After all, the Russian budget is set in rubles, so by regulating the exchange rate of the national currency, it is possible to regulate budget revenues.
You can download the Black Gold indicator here
Price Action Indicator
We recommend using Price Action patterns to all traders, regardless of what trading strategy they use. If there are difficulties in identifying patterns on the chart, an indicator (or rather an information panel) will come to the rescue, which will display 3 typical RA patterns in automatic mode. You just need to evaluate whether this pattern is worth using.
He can work with only 3 RA patterns:
• pin bar;
• absorption model, in the indicator it is called a vertical bar;
• Double High/Low.
There are many settings, most of them do not directly affect the operation of the indicator, but there are a number of parameters that are directly responsible for the configuration of patterns, as well as the display of patterns:
• block of settings with timeframes - sets the time interval on which the indicator will search for patterns. By default, m5, m15 and monthly timeframe are disabled;
• Symbols - in addition to the 3 currency pairs for which RA patterns are searched, you can add any other simply by entering it in this field;
• Max_Body_Tail_Ratio—for a pin bar pattern, the minimum acceptable ratio between the body size and the size of the shadow in points is set. There are settings sections for the other two patterns.
After launching the indicator, a separate table will appear under the chart in which 3 currency pairs are indicated:
• Symbol — currency pairs;
• TimeFrame—at what time interval the indicator found the pattern;
• Direction — direction of the pattern;
• Pattern — name of the pattern;
• Age—how long ago the pattern was formed. The age of the models is indicated in candles;
• Completion—at what price the model was formed;
• Chart - clicking on the link immediately opens the chart on which the pattern formed. Moreover, it opens immediately at the desired time interval.
On the chart, a smiley face is placed above the candle where the pattern formation has completed.
Don't forget that the indicator only checks patterns based on the relationships between the key elements of the candle. Thanks to it, you will not miss a single pattern, but each one must be checked manually - not all marked patterns are worth taking into work.
You can download the Price Action indicator here
conclusions
In this case, we have such an interesting pack of indicators. Again, I’m just giving you information, but what to do with it is up to everyone to decide for themselves. I want to reiterate that the light on all indicators did not converge like a wedge. No matter how hard you search, you still won’t find an indicator that will always give you exceptionally profitable signals under all conditions.
Well, there is no indicator in nature that would always and under all conditions give you profitable signals. Of course, over time you will understand this, but the question is how much time will you lose before the realization even comes.
Trader Dynamic Index indicator
This indicator is a successful combination of several standard MT4 tools. Thanks to the original approach, it was possible to obtain an algorithm that produces reliable signals.
TDI uses:
• standard relative strength index (RSI) indicator, but it is smoothed using a moving average;
• Bollinger bands are used to estimate volatility, that is, the amplitude of fluctuations in the smoothed RSI is estimated.
There are many settings, but the indicator’s performance is most affected by:
• RSI period - by default the period is 13, the author does not recommend going beyond the range of 8-25 when changing the period;
• RSI price – at what prices RSI will be calculated, you can leave the default value;
• Volatility Band - the period of Bollinger bands; as the period decreases, the lines react more strongly to price movements;
• RSI Price Line and RSI Price Type – fast RSI smoothing period and smoothing type, by default a simple moving average is used for smoothing;
• Trade Signal Line and Trade Signal Type – the same, but for slow RSI.
Other parameters affect the visual component.
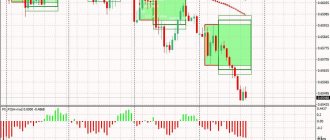
After launch, the trader will see the following picture:
• blue and yellow lines on the chart are the boundaries of Bollinger Bands and the midline of BB, respectively. Moreover, Bollinger Bands are built on the basis of a regular, unsmoothed RSI, although it is not displayed on the chart;
• green line – fast RSI; an MA with a short period was used for smoothing, so it looks broken and reacts faster to price changes;
• red – signal line, a heavier moving average was used.
Ways to use the indicator:
• trend determination. If the fast RSI line crosses the signal line from bottom to top, then a short-term upward trend is possible in the market. The midline of the Bollinger Bands can be used as an indication of the long-term trend. In addition, it is almost always in the range between levels 32 and 68, so if it has come close to one of them and is preparing to reverse, then a reversal is also possible in the market;
• volatility can be judged by the distance between the BB bands. During a flat they narrow, and during a trend they diverge.
As for signals, to work on small time frames and with small goals, you can limit yourself to the intersection of the slow and fast RSI lines (additional filter - both lines must be above the yellow BB line). You can try the option of medium- and even long-term operation by introducing an additional filter in the form of placing all lines above level 50.
You can download the Trader Dinamic Index indicator here
Strengths
The moon really has a strong influence on various phenomena. When it comes to influencing financial markets, Larry Williams was a pioneer in this area. He was the first to publicly announce this. Not everyone believed him at first, but he was a very reputable trader who had an impressive school of followers. Therefore, over time, his opinion was listened to.
Williams talked about unexplained phenomena. He saw with his own eyes how the market and lunar phases coincided. All this coincided with the rise and fall of asset prices. Only later did fans of wave analysis begin to use this theory. Main advantages:
- automated process of analytical processing of the price chart;
- free access to the indicator, it is presented in a live chart;
- high trading profitability.
It is not surprising that this strategy is still used so much today.
Currency Slope Strength indicator
The name of this indicator can be translated as “strength meter”. Strength does not mean volatility or the magnitude of the expected movement, but only the position of one currency relative to another. That is, after the indicator signal, a trend may arise that allows you to take a couple of hundred points, or it may happen that nothing happens, and the price moves in the desired direction by a couple of dozen points.
From the settings we note:
• autoSymbols - if you activate it, the indicator will draw lines in the window for all pairs that are in the “Market Watch” window;
• symbolsToWeigh - in this field you can specify the pairs for which you want to carry out the calculation;
• maxBars—how many candles the indicator lines will be displayed on; the value “0” disables all restrictions;
• addSundayToMonday — when this parameter is activated, Sunday will not be taken into account in the calculations;
• showOnlySymbolOnChart - work will be carried out only with those currencies that are associated with the current symbol;
• timeFrame—specifies the working timeframe;
•autoTimeFrame—the time interval will be selected automatically;
• extraTimeFrame — additional time interval;
• ignoreFuture—the indicator will not be redrawn;
• showCrossAlerts – the alert is turned on, a sound signal will sound as soon as the price crosses the line;
• differenceTreshold — if you have activated showOnlySymbolOnChart and the distance between the lines exceeds a predetermined value, the color of the line will change;
• showLevelCross—turn on/off the display of channel lines in the indicator field;
• levelCrossValue—set the values of the channel lines;
• cur, color — the first parameter allows you to enable the display of individual currencies, and the second parameter allows you to change the color of the corresponding lines.
As for signals, you need to take into account:
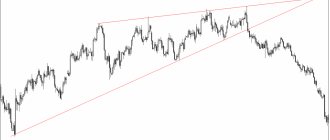
• intersection of lines, if the lines of 2 currencies intersect and diverge, while both are inclined at a large angle, then there is probably a good movement in the corresponding currency pair. In the GBP/CAD example, the cross occurred outside the channel, the lines quickly diverged, and the strength of the Canadian dollar grew. We see a reflection of this on the chart - GBP/CAD went down, which means the Canadian strengthened its position;
• areas where the lines are almost parallel indicate that this currency pair is in a flat. In the example in the selected section of history, the lines of the American dollar and the Swiss franc are almost parallel to each other
• you also need to take into account the breakdown of the channel, when the line goes beyond its limits, this means that the strength of the currency has increased so much that a trend can form.
This indicator can be used both as a basis in a trading strategy and as an additional filter.
You can download this indicator here
Results
Indicators are assistants for the trader. They take on a lot of routine and complex work, freeing up time for other things.
But you should not abuse such trading. The trader should control the process of working on the platform, and the chart should not be overloaded with a large number of elements, since the price in analytics is primary, and then the pictures drawn by the indicators are important.
Subscribe
New telegram channel to help the novice trader! All the most useful things - every day!
Telegram
Stochastic + RSI indicator
Another extremely successful combination of 2 standard MT4 indicators. Its authors, Stanley Kroll and Tushard Chanda, point out that standard oscillators, for all their advantages, also have a number of disadvantages. In particular, the relative strength index indicator most of the time is between the levels that limit the oversold and overbought zones without crossing them. As a result, the trader misses a lot of signals. Theoretically, Stochastic + RSI should be free from these shortcomings.
The settings are the same as in standard indicators:
• RSI Periods—relative strength index period;
• Percent_K and Percent_D – Stochastic parameter;
• NumOfBars - the number of candles in history for which the indicator will perform calculations. If the value is “0” there is no limit.
Among the differences, we note the absence of oversold and overbought zones as such, and the indicators themselves spend much more time at levels 100 and 0, they replace oversold/overbought zones.
It is more convenient to observe the differences in the operation of the standard versions of oscillators and the modified indicator if you add standard Stochastic and RSI to the chart. The same parameters are used as in the Stochastic+RSI indicator.
The main differences are immediately visible - when the standard RSI just begins to decline and forms the next minimum somewhere between levels 20 and 80 on the Stochastic + RSI line is already at the zero level. The same story applies if the standard RSI line rises.
Indicator signals:
• it is recommended to add standard oversold and overbought levels to the indicator. You can trade when the main line (thick line in the screenshots) goes beyond the zones;
• you can also work at the intersection of the signal and main lines;
• another option to work is at the intersection of the main line of the indicator and level 50. When crossing level 50 from bottom to top, there is a high probability of an upward trend.
This indicator can be used as a replacement for the standard Stochastic and RSI oscillators. .
Ozymandias indicator
This indicator is used to filter out noise, i.e. random price fluctuations. Can be used on any currency pair and on any time interval without exception. Ozymandias is extremely simple, its signals are easy to read, but this does not affect profitability; if used correctly, you can make money with it. It is recommended to work on timeframes from m15.
In the settings, you can change only one parameter - amplitude, that is, the number of candles that the indicator will use for calculations. The authors recommend changing it in the range from 2 to 4.
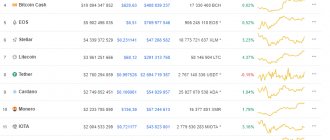
After adding the indicator to the chart, the trader will see the following picture.
Now according to the indicator signals:
• it can be used to identify the state of the market. The direction of the trend is indicated by the color of the center line, blue indicates a rising market, and red indicates the strength of the bulls. In addition, you need to take into account the slope of the line. If the line does not have a slope, then the market is flat; it can be either in a bullish or a bearish market, here you need to focus on the color of the line;
• the upper and lower lines should be considered as the boundaries of oversold and overbought zones. If the market is growing (this is indicated by the color of the central line and its slope), and the price is above the upper border, then it is considered that the market is not overbought and you can try to open long positions. For sales the rules are reversed.
Trading only based on the signals of one indicator is risky, but some traders try to work using Ozymandis’ signals. Let's look at the rules of the strategy using the example of purchases:
• you want the center line to turn blue and point upward;
• the highs of at least 2 candles must rise;
• the price is above the upper limit of the indicator;
• if the conditions are met, then the pending order is placed above the High price of the signal candle (at which the conditions for entering the market have been met).
The stop is placed below the minimum of the signal candle, and a fixed take profit may not be used, because it is not known how long the price will move in the desired direction. You can close a trade either after the line changes color or after the color of the center line changes.
If you work only according to Ozymandis’ signals, then the profit is small; due to the delay of the signal, the trader enters after him, at not the most favorable price. So it is better to use it as one of the elements of a trading strategy.
You can download the Ozymandis indicator here
Weak sides
The relationship between market and lunar phases is visible to the naked eye; it is foolish to deny it. The strategy was initially used to work on the interbank foreign exchange market Forex. Soon, experts were able to adapt it for binary options trading. The main disadvantages of the trading strategy:
- limited scope - only Forex and binary options;
- does not give clear signals, but helps to form an idea of the market;
- is focused on long-term trading, the minimum expiration period is 10 days.
Not everyone can or likes to wait. Therefore, the strategy is predominantly used by experienced investors rather than beginners. However, the trading system certainly deserves appropriate attention.