Author:
Alexander Borskikh
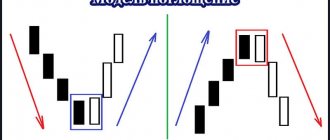
Steve Nison classified the Harami pattern as a medium strength pattern. According to his observations, this formation could become a reversal, but only if it formed at the end of a strong movement and there was other evidence of a reversal. The candlestick model works on Forex and other markets - there are no restrictions on working timeframes. But for Harami to bring profit, you need to know the rules of its formation and filters for assessing the strength of the pattern.
How the Harami candlestick pattern is formed
This pattern is understood as a construction of 2 candles, in which the second is completely within the range of the first. That is, it looks like an internal bar from Price Action or another model called Day with a decreasing price range.
Among the features we note:
- special requirements for the size of the bodies of Harami pattern candles. The body of the second candle should be several times smaller compared to the first;
- The 2nd candle should not have a large range (no more than 2/3 of the range of the first). Ideally, after the first large full-bodied candle, a top should form in the direction of the current trend;
- on Forex, the gap when the 2nd candle of the Harami pattern is formed is rarely formed, only when working on timeframes from D1. But in the stock market, gap patterns are more powerful. Please note that the gap should form in the direction opposite to the movement on the first candle. That is, in a falling market the gap should be up, the 2nd candle opens within the body of the first candle. Otherwise, we get an inside bar with dubious prospects for working it out;
This pattern is weak, and the support level has also been broken. In the end it never worked
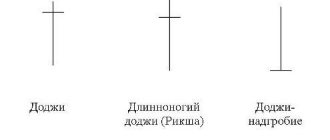
- if the 2nd candle turns into a doji (opening and closing prices are equal), the pattern turns into a Harami cross and is also put into action. The color of the 2nd candle does not play a special role, it indicates a suspension of the current movement, it is not so important whether the bulls or bears won during its formation.
In his book, Nison gave examples of patterns in which the 2nd candle rewrites the extremum of the first and has a large range. Such models have less power and their use is associated with greater risk.
Pay attention to the range of candles, take this parameter into account when determining patterns
Despite the fact that the High of the first candle is rewritten, this is also Harami. In his book, Neeson gives the following examples:
What is important here is the ratio of the bodies of the pattern candles. The body of the second candle is 7-8 times smaller than the body of the first candle
Candlestick analysis involves understanding the psychology of what is happening in the market. Harami means a slowdown in the current trend; when the pattern is formed, there is no break in the trend yet, but the current trend is already running out of steam. As a result, we get either a reversal, a correction, or a flat area.
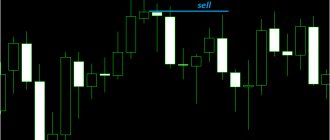
Buy levels and Stop Loss
The final confirmation of the model, and, therefore, the moment of opening a long position, is the price breaking through the highest of two levels:
- the middle of the body of a bearish candle;
- closing prices of a bullish candle.
The lower of the last two price lows is selected as a reference level for Stop Loss. A loss should be recorded in the following cases:
- the market closed below the Stop Loss level;
- For two days in a row, the price minimum broke through the Stop Loss level.
Harami Cross
This is a subtype of the usual Harami pattern, in which the second candle turns into a doji, that is, the Open and Close prices are equal. The physical meaning is the same as that of the usual Harami model; the doji only shows that after a confident trend movement, uncertainty is observed in the market - equality of strength between bulls and bears.
An example of a Harami cross pattern, after which the market reversed
Although it didn’t come to a full-fledged reversal, we still consider the pattern to have worked out
In Forex and other markets, the Harami cross is formed less frequently than a regular pattern. The strength does not differ from the basic design.
Psychological foundations of formation
After a strong and prolonged downtrend and after a day of heavy selling, bulls open the next day at a price level that is above the previous day's closing price. Short sellers become worried and close their positions. The result of the day is a rise in prices. This indicates that there is support strong enough for short sellers to notice that the trend has ended. If this is followed by another strong day, no one will be left in any doubt that the trend has reversed. Typically, there is a spike in daily volume .
How to filter the Harami pattern
Like other candlestick analysis models, Harami does not trade on its own. History is full of situations when designs that were good at first glance were not worked out. If you enter each such pattern, then it is not a fact that at least 50% of the signals will be profitable.
We recommend using Harami as one of the elements of your trading strategy. If you want to make it the basis of your vehicle, then in trading:
- do not go down to timeframes below H4-H1. Even on hourly charts, the reliability of Harami is low; it is better to work on H4, and ideally on daily charts;
- be sure to filter the Harami pattern by levels. Ideally, this pattern is formed after testing the level or with a slight loss of income, abandoning it. The probability of a reversal with this option is higher than if the model “hangs” without support/resistance.
An example of a strong Harami pattern. As a result, the resistance worked out and it was possible to earn about $10 on each stock.
The resistance level was tested twice, but it still held out. Reversal patterns also spoke in favor of a downward movement
Filtering by indicators is possible, but their effectiveness depends on the nature of the chart movement. Any indicator gives signals with a delay; if the Harami is formed on a sharp movement, you may miss the moment to enter the market.
Among the indicators, you can use standard RSI, Stochastic, and the Money Flow Index (MFI - Money Flow Index) performs well. If, during the formation of the Harami pattern, the indicator lines leave the oversold/overbought zone, this strengthens the candlestick pattern. This is true for Forex and other markets.
Formally, there was a breakdown of support, but at the same time we have divergence on Stochastics and the oscillator line exits the oversold area. There was no reversal, but during the correction it was possible to take a movement of $7-$8 for each stock
Here Harami is not confirmed by the withdrawal of support. There is also no exit from the oscillator line from oversold conditions. The correction ended up being very weak, the signal did not work
It is advisable to take into work only those patterns in the strength of which you are confident. Do not overuse indicators.
Application in trade
As mentioned above, the Harami cross is a reversal pattern of fairly strong strength (this means that, other things being equal, the probability of its execution is quite high).
To confirm the pattern, you should wait until the next candle immediately after the doji completes. For a bullish pattern, it should be an ascending (bullish) candle; for a bearish pattern, it should be a descending (bearish) candle.
An important advantage of the pattern is the ability to set a fairly short stop. So, when entering a position immediately after the completion of a confirmation candle, I usually place a Stop Loss order at the doji level. And to fully guarantee that the placed order will not be knocked out by random price volatility, it can be placed at the previous local extreme formed by the first candle of the pattern (in the example discussed below, we will do just that).
Here is an example of trading a bearish pattern:
As you can see, a short position here is opened immediately after the close of the bearish candle that immediately follows the doji and is confirmation of the validity of the pattern. And the loss limitation order is placed at the border of the trading range of the candle of the previous doji (although in this case the highs of these two candles coincide).
The logic of setting Stop Loss is such that when the price reaches this level, all the prerequisites that prompted us to open this position will disappear.
Indeed, imagine that the price, shortly after opening the position, reversed and reached the level at which we placed a Stop Loss order. Would you go short now? I definitely wouldn’t do this, because, as mentioned above, all the prerequisites for this have disappeared (in particular, the Harami cross pattern turned out to be false).
Please note the following example:
This also shows a bearish Harami cross pattern, but without confirming its validity with a bearish candle immediately following the doji. Well, as a result, no trend reversal followed.
Market entry methods
The Harami candlestick model suggests several options for entry points, the risk for each of them is different:
- maximum risk – enter the market immediately after the close of the second candle of the pattern. We recommend studying history and assessing how many candlestick patterns ultimately fail to work out. Moreover, at first you will not have experience in filtering patterns, you will make mistakes more often;
- a pending order Buy Stop (beyond the high of the 2nd candle of the pattern) or Sell Stop (it is placed below the low of the 2nd candle). A pending order filters situations when, immediately after Harami, movement continues in the same direction;
- entry with a confirmation candle; pending orders are also used. The color of the first candle after the formation of a reversal pattern should correspond to the expected movement. A more conservative option, but the ratio of take profit and stop loss changes not in our favor.
All options for entering the market after the Harami formation. At the time of formation of this pattern, a historical maximum was observed on the chart, so there is no support for the resistance level
The stop is always placed beyond the Harami extremum or the nearest local High or Low. With take profit it is more difficult, the optimal scenario is to place TP at the nearest levels, fix part of the profit, and troll the rest.
Example
The Eversource Energy stock price chart (ticker symbol ES) shows an example of two confirmed patterns: bearish and bullish harami
).
The bearish harami pattern formed after a sustained uptrend. Moreover, the first (bullish) candle did not have an upper shadow, and the lower shadow was insignificant. The final confirmation of the bearish reversal was the opening of the market the next day with a price gap down.
- ← Bullish Harami
- Bullish Engulfing →
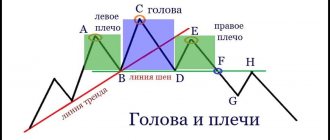
Three black crows
The three black crows pattern consists of three consecutive red candles that open inside the body of the previous one and close at a level below the low of the previous candle.
This pattern is the equivalent of the bearish three white soldiers. Ideally, these candles should not have long and tall wicks, which indicates constant selling pressure that drives the price down. The size of the candles and the length of the wicks can be used to assess the likelihood of consolidation.
Bearish reversal patterns
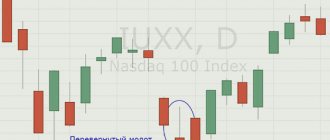
Hanged
The Hanged Man (from the English hanging man) is the bearish equivalent of a hammer. It usually forms at the end of an uptrend as a small body and a long lower wick.
The lower wick indicates heavy selling volumes, but the bulls still managed to regain control and push the price higher. Remember that after a long uptrend, such activity may be a warning that the bulls may soon lose control of the market.
Candlestick patterns based on price gaps
There are many candlestick patterns that use price gaps or gaps. A price gap, or gap, occurs when a financial asset opens above or below the previous closing price, creating a gap between two candles. Since cryptocurrency markets operate 24 hours a day, there are no patterns based on such price gaps. Despite this, price gaps can still occur in markets with weak liquidity due to the large spread between the bid and ask prices, but any candlestick patterns may not be useful in this case.
Bullish reversal patterns
Hammer
A candle with a long lower wick at the bottom of a downtrend, provided that the wick at the bottom must be at least twice the size of the body.
The hammer shows that although the selling pressure was high, the bulls pushed the price up near the opening of the candle. The hammer can be red or green, but green hammers indicate a stronger bullish reaction.