Shooting Star Criteria
To correctly identify a shooting star on a graph, the following criteria must be met.
- There must be a clear upward trend in the market.
- The first candle in the pattern should be a bullish candle, the body of which should not be short.
- The next day (trading session) should open with a price gap ( eng. Gap
) upward, that is, the opening price should be higher than the closing price of the previous day (trading session). - The second candle in the pattern should have a short body formed at the bottom of the trading range. It does not matter whether it is bullish or bearish.
- The length of the upper shadow of this candle should be at least twice as long as its body.
- The lower shadow, ideally, should be absent, but in analytical practice it is allowed if its length is insignificant (relative to the trading range).
Trading by model
Now let's move on to the trading itself. As follows from the definition - since our technical analysis figure is a shooting star, which is a reversal, then we will trade against the main trend. No one guarantees that the graph will go down very sharply.
Therefore, we will consider two trading options that have proven themselves over time:
- We open a sell trade immediately after the candle closes and a new one opens. If we are talking about the daily chart, then it may make sense to wait one or two hours, since low liquidity and brokers’ tricks can lead to a spread of up to 5 points for major pairs, not to mention crosses, in addition There may be sharp price jumps. The stop loss must be moved not only beyond the shadow level, but also within a small gap of 3-5 points. It cannot be ruled out that the price will try again to reach these values. The model does not assume any take profit. There is only a guideline of a few candles in time, that is, usually within 3-7 candles after a shooting star there is a downward trend, sometimes more, but depending on your luck.
- We wait for some time for the next trading day and look at the price behavior. It is not uncommon for another upward move to occur, which usually ends at or below the midpoint of the shooting star's shadow. In this case, you can go to a smaller time frame and see the reversal there. With this trading method, our stop loss will decrease, which we also remove behind the shadow and indent, and our take profit will also increase slightly (which is also not known in point-by-point terms). The only negative is that this does not always happen and you may miss the opportunity to sell, meaning you will have to enter a trend that is already gaining good momentum.
As a general rule, we can say that the shooting star reversal pattern works best when the body of the candle is black, that is, the close occurs below the opening level. This indicates that the new trend has high potential, since usually the opening level of the day is quite strong support and it is not easy to pass it, let alone gain a foothold on the other side.
Signal Boost
When one, or preferably several, of the following conditions are met, the reliability of the model increases.
- The shooting star is preceded by a bullish candle with a long body and short shadows, ideally a bullish marubozu.
- The larger the upward price gap, the more reliable the signal.
- The shorter the case length of the bearish candle, ideally a tombstone doji, the stronger the signal.
- The pattern formed near a strong resistance level or broke through it, provided that the close was below this level.
Market entry and stop loss.
You can place a sell stop order 2-5 pips below the low of the confirmation candle, or you can enter with a market order if you are confident that the price will decline further. In any case, your stop loss should be set 2-5 pips above the high of the signal candle. This is only a rough guide. In volatile markets, you may want to move your stop loss higher. Also, for higher timeframes, the stop loss should be set higher, for example, for the daily timeframe, 5-20 points above the high of the signal candle.
The larger the confirmation candle, the greater the likelihood of a reversal. However, if the candle is too large, then there may be problems with the optimal risk-to-reward ratio. For example, if the signal candle and the confirmation candle together reach 100 pips, then your stop loss will be at least 100 pips. Therefore, the take profit will have to be set at a minimum of 150-200 points. If the support level is within these limits, then you will have to miss such a signal and not enter the market, no matter how obvious it is.
Candles and candlestick patterns are the pulse of the market, determining price action ( Price Action ) and the sentiment of market participants, which is the driving force behind price action.
Example
The stock chart of Brunswick Corporation (ticker symbol BC) shows an example of a proven shooting star pattern.
It marked the end of a fairly gentle upward movement. Additional signal reliability was provided by two factors:
- the first bullish candle in the pattern has a long body;
- long upper shadow and no upper shadow in the second candle.
The final confirmation of the trend reversal was received the next day as a result of the formation of a bearish candle with a long body and almost complete absence of shadows.
- ← Bearish engulfing
- Inverted Hammer →
Similarities with a pin bar
At first glance, it may seem that the shooting star figure is somewhat similar to a pin bar . But there is a significant difference here - a pin bar must have a body as small as possible, while a shooting star must have it, and of a certain size (no more than ½ the length of the shadow and no less than 1/4).
Therefore, if at first glance it is difficult to understand for some reason, then you just need to carry out the calculation and see how the key indicators relate to each other. Despite the fact that the meaning of the models is the same, there are differences in construction, and for each model the rules are quite strict. Anything that does not fit into the description of one of the models should not be considered a pin bar or a shooting star. All descriptions were compiled for a reason and were repeatedly checked against history.
It is also worth noting that the pin bar is usually traded over short periods, that is, even five minutes can be seriously considered. As for candlestick models, here we at least use a four-hour time frame, and many models generally cannot be considered lower than the daily time frame. But on a daily chart, or, moreover, a weekly chart, a pin bar rarely occurs.
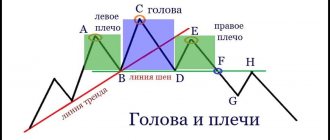
Morning star pattern and its mirror copy
If the shooting star consisted of one candle, the morning and evening ones are formed on at least 3 candles. The order of formation is as follows:
- on the 1st candle there is a movement in the direction of the current trend. There are no prerequisites for a reversal;
- The 2nd candle has a small range and a small body. It is desirable that the extremum of the previous candle be updated. The morning star is formed at the bottom of the market, should be surrounded by Low, and the evening star - on an uptrend. It corresponds to a weakening of the current trend;
- a reversal occurs and the 3rd candle is full-bodied, but directed in the direction opposite to the trend.
Pattern Notes:
- the morning star pattern and its mirror copy can, instead of one candle in the center, have 2-3 small candles, on which a reversal occurs;
- The presence of long shadows is undesirable. This requirement is especially important when forming the central candle of the morning and evening star pattern. Often a top or a small doji is formed in the center;
- If you studied the relevant literature, you might come across references to GEPs. But gaps on Forex are formed rarely and mainly at the opening of the week. The morning and evening stars on Forex are taken to work without fulfilling this requirement;
- the sizes of the 1st and last candles of the pattern should be comparable.
Although the pattern was formed on 4 candles, it worked well
Another morning star pattern
This is not the evening star. A reversal is not always accompanied by a corresponding pattern
Even good patterns can be poorly executed. There are no guarantees, so use partial profit fixation and move the stop to breakeven
These models are formed on any instruments and without restrictions on time frames. But a greater probability of working out is observed on older time intervals.
Internal bar and fakes
The inside bar is the opposite of the engulfing pattern and is a small candle that is completely within the range of the previous one.
A fake occurs when, after an inside bar, the price breaks the high or low of the inside bar and then immediately reverses. Thus, fakes can be compared to a false breakout pattern or a trap for bulls or bears, where the price breaks out and then immediately reverses.
Waiting for the candle to appear after the inside bar is the key to trading this pattern. Most traders use pending orders to trade inside bars, which makes their stops very vulnerable. This is why you will often see a fake pattern after an inside bar.
An inside bar shows a temporary pause in trading activity on the market and most often occurs after long trends or at the beginning of a new trend. As a rule, the market maker accumulates or distributes positions on the inside bar.
Engulfing pattern or outside bar
The engulfing pattern signals a strong reversal and is formed with two candles. The second bullish candle completely engulfs the first bearish candle. This means that sellers have lost their initiative after the recent downtrend and the bulls are now in complete control.
On the other hand, bearish engulfing shows us the opposite picture. This pattern occurs when a bullish candle is immediately followed by a bearish candle and completely engulfs it. This means that sellers have overpowered buyers and there is now likely to be a big drop.
Absorption is a very powerful signal, especially if it occurs in the right place and context. This pattern is more significant if the first candle has small shadows and the second candle is much larger than the first.
During trends, you will often see engulfing patterns occur during pullbacks, so this pattern can be used to add to an existing trade or to find a new entry point.
Features of Forex candlestick figures “Hammer” and “Star”
The peculiarity of these candlestick configurations is that they contain only one candle. They can be used not only in the stock market, but also in Forex; in the stock market, one can more often observe a situation where gaps are formed. When working with currency pairs, gaps also form, but are observed much less frequently, usually at the end of the trading week.
These candlestick patterns should be used in conjunction with additional tools, such as oscillators, to help determine trend characteristics.
Reversal candlestick configurations, discussed in this article, often appear on the chart, but you should remember the accompanying factors so as not to make a mistake with the forecast.
We recommend that you familiarize yourself with the list of the main trend reversal and trend continuation candlestick patterns for Forex trading.
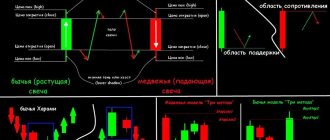
Top
The candlestick pattern indicates a fierce battle between bulls and bears. No one has won the battle yet, so the candle closes close to the opening price. Both bears and bulls tried to push the price in their direction, but they failed.
The body of the top can be either bullish or bearish - it doesn't matter too much. The important thing is that there are two shadows at both ends that are much larger than the body of the candle. The appearance of a spinning top pattern in a trend indicates uncertainty about further movement.
The spinning top pattern can often also indicate a possible completion and reversal of the current trend.
Candlestick patterns and their types
Over the years, Japanese traders have developed various candlestick patterns based on historical price movements. Every trader should invest their time and study these patterns as it will give a deeper knowledge and understanding of charts in general. Candlestick patterns can help you interpret price movements in the market and make predictions about the immediate directional price movement for a selected asset.
While there are many different patterns, we will discuss some of the most popular ones that will help you learn to read charts like a professional trader.
Reading candlesticks can give us information about three market sentiments: bullish, bearish or neutral.
Below are some patterns that can help us gauge market sentiment:
For example, a full-bodied bullish candlestick indicates a continuation of a bullish trend, while a full-bodied bearish candlestick indicates a continuation of a bearish trend. On the other hand, a Doji candlestick represents a neutral market condition.
When you see candlestick patterns, you must remember which candlestick patterns indicate bullishness, which indicate bearishness, and which indicate neutral market conditions.
If you read the chart and find a bullish candle, you may want to consider placing a buy order. On the other hand, if you find a bearish candle, you can place a sell order. However, if you find a candle like the Doji, it would be a good idea to stay out of the market.
One of the most important things to consider is the location of the candlestick formation. For example, a Tombstone Doji that appears at the top of an uptrend can indicate a trend reversal. However, if the same pattern appears during a prolonged downtrend, it does not necessarily mean a continuation of the bearish trend.
Once you have mastered simple candlestick patterns, you can move on to more complex ones such as bullish and bearish 3-candlestick formations.
The main difference between simple and complex candles is the number of candles required to form them. While a simple pattern such as a hammer requires one candle, more complex patterns usually require two or more candles to form.
For example, a bullish harami requires two candles, a Three White Soldiers pattern requires three, and a 3 inside up formation requires 4 candles.
Once again, remember that no matter the complexity, the placement of all these simple and complex candlestick patterns is one of the most important aspects of chart reading.
Pros and cons of candlestick charts
Compared to line charts, a candlestick provides more data for analysis.
Although the same four values can be obtained from bar charts, bars use horizontal lines on the sides of a vertical line to project the opening and closing prices. But a series of candlesticks on a chart can help traders more accurately determine the pattern of price movement in the market, which helps in the decision-making process.
With candlesticks, it is much easier to interpret price action over a period of time because a bullish candle shows a full body with a pre-assigned color, while a bearish candle shows a full body with a different pre-assigned color. As a result, many professional traders have switched to using candlestick charts because they easily interpret the simple visual appeal of candlesticks.
While candlestick charts make price movement much easier to interpret, they lack the smoothness of a line chart, especially when the market opens with a large gap. Therefore, sometimes professional traders use a moving average over a certain period of time to see the movement or lack of trend in the market.
Tweezers
The tweezer pattern usually occurs after a prolonged uptrend or downtrend and indicates an imminent reversal.
The most effective Tweezers pattern has the following characteristics:
- The first candle matches the current trend. If the price is moving up, then the first candle should be bullish. If the price is moving down, the first candle should be bearish.
- The second candle is opposite to the previous trend. If the price moves up, then the second candle should be bearish. If the price moves down, the second candle should be bullish.
- The shadows of the candles should be the same length.
How to identify trading patterns on a chart
design should be looked for in the following places:
- support and resistance levels from the H1 timeframe;
- decrease in volume - at the end of an upward or downward movement. Volumes are a display of trend potential. If large transactions are opened, then the price may continue to move in the same direction. In this segment of the chart, there is little point in looking for reversal structures - they are not supported by the behavior of large investors.
The decrease in volumes indicates a transition of initiative from some serious players to others. Or large investors have decided to remove the stops of small traders and are preparing to change the trend with new positions. Accordingly, if you follow them, you can get additional profit.
Visually, the reversal pattern can be found by the long shadow of the middle small candle . This shadow indicates a reversal in the currency pair. Sometimes the design includes 2-3 small bars, instead of one. Also, when searching for a candlestick combination, note support and resistance levels.
Maribozu
The Marubozu candle has no shadows at all. This is a strong trend continuation pattern that tells us that the bulls or bears are in complete control of the market.
Think of it in terms of a battle between bulls and bears. In the case of the bullish marubozu, when the candle opened, the bears were unable to push the price down one bit. She immediately went upstairs without any kickbacks. The opposite is true for bear maribozu. Since the bulls or bears have so much strength, it is logical to expect that they will have enough strength for the next candles and the trend will continue.
For the crypto trader: Japanese candlesticks and models based on them
06/19/2018 Alex Kondratyuk
#crypto-trading#trading
In one of the materials of the special project, Japanese candles were already briefly discussed. This review will focus on popular models based on them.
Anatomy of Japanese candles
As you know, the Japanese candlestick chart is very popular among traders in any market. Let us remind you once again what Japanese candlesticks are.
Each candle on the chart reflects the price movement over a specific time frame. The body of the candlestick is formed by the opening and closing prices, and the shadows are formed by the highs and lows.
Rice. 1 — Structure of Japanese candles
The upper shadow of a candle is a vertical line showing the difference between the high and the close of a bullish candle and the difference between the high and the open of a bearish candle.
If the closing price is higher than the opening price, the candle is bullish, and vice versa. A special case is the so-called Doji candle, where the opening price is equal to or approximately equal to the closing price.
The body of the candle represents the difference between the opening and closing prices. A bullish candlestick with a relatively large body indicates pressure on the market from buyers, while a large bearish one indicates the dominance of sellers.
Each individual candle, as well as their various combinations, carries a lot of valuable information about the state of affairs on the market. Moreover, many are convinced that Japanese candlesticks themselves are a fairly reliable technical indicator, and not just an option for displaying prices on a chart. Among other things, Japanese candlesticks can be effectively analyzed on almost any time frame - be it a daily or half-hour chart.
Note, however, that a single candle does not contain direct information about price movements within a particular time interval. There is no indication whether the high or low was reached first, or how many times price declines or increases occurred. For example, if the price contains an upper and lower shadow, it is impossible to say for sure whether the price first decreased or increased. To find out, you need to study charts of a smaller time frame.
Long-term observations of candlestick charts have allowed traders to identify various signals consisting of one, two, three or more candles. Let's take a closer look at the “anatomy” of Japanese candlesticks, as well as the elementary patterns based on them.
Candle body
A long candle body usually signals strong bullish or bearish pressure on the market. Short candle bodies usually indicate low trading activity, and/or relative equality of power between buyers and sellers during periods of market consolidation.
Rice. 2 – Long and short bodies of bullish and bearish candles
Bullish candles with a large body indicate significant buying pressure on the market. The longer the body of such a candle, the greater the difference between the closing and opening prices.
On the other hand, such candles must be considered each time in the context of a particular market situation. For example, if a large bullish candle appears suddenly after an extended downtrend, it may indicate a high probability of a reversal, a strong support level and/or an exit from a deeply oversold zone.
Likewise, if a large red candle appears after a long “Tuzemoon”, this may indicate that an important resistance level has been reached and/or an exit from a strong overbought condition.
Candle shadows
The upper and lower shadows of candles also carry valuable information. So, if a bullish or bearish candle has both shadows short, this indicates that most transactions were made in the range between the opening and closing prices. If the shadows of the candles are long, this means that, on the contrary, most transactions were carried out outside this range.
Rice. 3 – Candles with a long shadow
A candlestick with a long upper and short lower shadow indicates continued dominance of the bulls within a given interval, towards the end of which, however, the activity of the bears increased. Conversely, a candle with a long lower and short upper shadow indicates that sellers dominated for some time, who then lost ground somewhat under pressure from buyers.
Spinning Top
Japanese candles with long upper and lower shadows, which, at the same time, have a short body, are called spinning tops . The appearance of such candles on the chart indicates a high degree of uncertainty in the market. In this case, the color of the top does not play a special role.
Rice. 4 – Spinning Tops
The short body and long shadows of the top indicate significant activity of both bulls and bears, as well as the approximate equality of their strengths.
If a spinning top appears after a large bullish candle, this indicates a decrease in buying pressure. And, conversely, if a top appears after a bearish candle with a long body, this will indicate a weakening of pressure from sellers. Both situations signal a high probability of a trend change.
Marubozu
Candles with the mysterious name “Marubozu” should be included in a separate category. They are distinguished by the complete absence of shadows. This in turn means that the opening and closing prices coincide with the highs or lows (depending on whether it is a bullish or bearish candle).
Rice. 5 – Bullish and bearish Marubozu
The appearance of such candles indicates the undivided dominance of buyers or sellers (depending on the color of Marubozu) within a particular timeframe. Such candles can signal an obvious continuation of the trend, or a bullish/bearish reversal (if, accordingly, the Marubozu candle was preceded by a stable downward/upward trend).
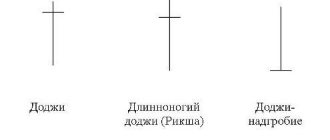
Doji
A characteristic feature of candles of this type is the complete or (almost complete) absence of a body. This means that the opening and closing prices of the doji are the same or very close to each other.
On the chart, the body of such a candle often looks like a thin line. The doji itself may look like a "+" sign, a "T" (including an inverted one), or a small horizontal line.
Rice. 6 – Classification of Doji candles
Dojis can signal uncertainty in the market and/or a head-to-head battle between bears and bulls. A very small candle body and large shadows indicate that the price moved significantly above and below the opening price, and ended up closing very close to the original level. Thus, neither buyers nor sellers managed to gain the upper hand in the confrontation - there was a kind of “draw” in the market.
If a doji appears on the chart, you should pay close attention to the nature of the preceding candles. So, if the doji formed after a series of large bullish candles, this will indicate that buyers are already a little “exhausted” and, quite possibly, sellers are preparing for a powerful counterattack.
Rice. 7 – The appearance of a doji after a bullish candle
If the doji occurs after a series of large bearish candles, then this will signal a weakening of pressure on the market from sellers and a likely reversal of the movement.
Rice. 8 – The appearance of a doji after a bearish candle
Thus, the Doji candle itself is a neutral pattern. This means that the bullish or bearish nature of such a pattern is determined by further confirmation. On the other hand, if the Doji appears among other candles with a small body, the significance of such a pattern is significantly reduced.
The candlestick with the funny name “Long-legged Doji” (Fig. 6) is sometimes called “rickshaw” by traders. This candle is distinguished by the presence of approximately equal upper and lower shadows, as well as a tiny body. The appearance of a “rickshaw” indicates significant uncertainty in the market and a fairly high probability of a trend reversal.
Doji Dragonfly candle (Fig. 6) is formed in a situation where the opening, closing and high prices are the same, and the low forms a long lower shadow. The result is a candle that looks like the letter “T”.
Such a candle indicates that sellers dominated the market for some time, but by the close of the trading session the advantage passed to the bulls. This brought the closing price to the opening level, which was also a session high.
“Dragonfly” signals a possible trend reversal. However, much depends not only on the nature of the previous candles, but also on further confirmation. Also note that a long lower shadow indicates not only significant bull activity, but also significant bearish pressure on the market. Confirmation for a reversal after an uptrend is the change from the dragonfly to a long bearish candle. Conversely, if after a downward trend a dragonfly doji appears, followed by a large bullish candle, then this will indicate a radical change in trend.
The Tombstone Doji (Figure 6) looks like an inverted "T". For such a candle to appear, it is necessary that the price minimum, open and close be equal, and the maximum form a long upper shadow.
"Tombstone" shows the initial dominance of bulls, which then gave way to the dominance of bears. By the end of the trading session, the latter pushed the price to the opening level, which is also a minimum.
The appearance of a "gravestone" after an uptrend may indicate a failed attempt by the bulls to strengthen their dominant position in the market. A reversal can be confirmed by the appearance of a large bearish candle.
If the “gravestone” appears against the background of a stable downward trend or near a strong support level, then it signals the weakening of the bears and the strengthening of the strength of the bulls. However, a large bullish candle is needed to confirm the trend change after the doji.
Hammer and Hanged Man
Some of the simplest single-candlestick patterns are Hammer and Hanged Man. Taken separately, such candles are absolutely identical, but everything depends on the trends preceding them.
Rice. 9 — Reversal patterns of Japanese candlesticks Hammer and Hanged Man
Both candlesticks are characterized by small bodies, long lower shadows, and the absence of upper shadows. However, in practice, the presence of the latter is allowed, but very short.
The hammer is a bullish reversal pattern that forms in the context of a downtrend. Traders often perceive the Hammer as a signal that the “bottom” is very close and an upward movement is about to begin.
Rice. 10 — Examples of reversal patterns with Hammer and Hanged Man candles
The long lower shadow of the Hammer indicates that sellers made a lot of efforts to push the price down, but they were not enough to do more - the bulls prevailed in the confrontation, eventually closing the candle near the opening price.
However, to safely enter a trade, it is advisable to wait for additional confirmation. This could be, for example, the subsequent large bullish candle that closed above the Hammer opening price.
Important characteristics of the Hammer:
- a long lower shadow, two to three times the size of the candle body;
- small upper shadow, or better yet its absence;
- the color of the candle does not play a special role, although some experts believe that in the short term the green Hammer is more reliable than the red one;
- The appearance of the Hammer must be preceded by a stable downward trend.
The Hanging Man is a popular single-candlestick pattern that signals a bearish reversal. The appearance of such a candle (Fig. 10) against the backdrop of an uptrend may indicate a collision with a serious resistance level, as well as the fact that sellers are gradually gaining the upper hand over buyers.
Thus, a long lower shadow indicates that the bears are seriously trying to push the price lower. Buyers intervened, but all they managed to achieve was to close the price near the opening level, nothing more.
Criteria for identifying the Hanged Man:
- the appearance of this candle must be preceded by a stable upward trend;
- the length of the Hanged Man's body should be small in comparison with previous candles;
- The color of the Hanging Man does not play a special role (however, in the short term, a bearish candle is considered more reliable than a bullish one);
- the length of the Hanged Man's lower shadow should be two to three times the size of the candle's body.
In addition, the signal requires mandatory confirmation in the form of a subsequent large bearish candle. It is also desirable to have a price gap between the Hanging Man and the previous candle.
Inverted Hammer and Shooting Star
Taken separately, these models from one candle look absolutely identical. As with the Hammer and the Hanged Man, everything depends on the direction of the previous trend.
Rice. 11 – Single candle reversal patterns Inverted Hammer and Shooting Star
Thus, the Inverted Hammer ends a downtrend and marks an upcoming bullish reversal. A shooting star, on the other hand, forms at the top of an uptrend, anticipating a significant price decline.
Such candles are characterized by a tiny body and a long upper shadow, or the absence of the latter.
Rice. 12 – Examples of reversal patterns with Inverted Hammer and Shooting Star candlesticks
As you can see in the picture above, the Inverted Hammer can appear against the backdrop of a downtrend. Such a candle indicates a high probability of a reversal. In particular, a long upper shadow indicates the determination of the bulls, despite the fact that they managed to close the price only near the opening level. At the same time, the bears are already running out of strength to continue pushing the price down. In other words, most of those who were planning to sell the asset have already done so.
Shooting Star candlestick patterns represent bearish reversal patterns. The shape of such a candle indicates that the candle opened near the low of the trading session, jumped up, but soon, under the pressure of the bears, the price rolled down.
In other words, the bulls tried to continue pushing the price higher, but they were effectively blocked by the determined bears. A shooting star is a bearish signal, which indicates that there are far fewer buyers than sellers.
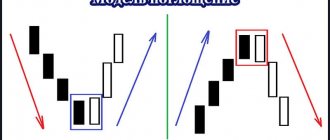
Takeovers
The popular Bullish Engulfing reversal pattern consists of two candles - a bearish one and a larger bullish one. This pattern forms at the end of a downtrend (less commonly, after a period of consolidation), signaling a likely reversal and subsequent vigorous upward movement.
Rice. 13 – Bullish and bearish engulfing
Bullish engulfing . This pattern occurs when a large bullish candle appears after a small bearish candle. The latter should overlap the body of the bearish candle. It is also desirable that the opening price of a bullish candle be significantly lower than the closing price of a bearish one (such a price gap significantly strengthens the model). In this case, the size of the body of the bearish candle does not play a special role - the main thing is that it is not a doji, which is too easy to absorb.
Below is an example of a bullish engulfing pattern, courtesy of the Galaxy Twitter account:
$BTC | Bullish engulfing (reversal pattern) spotted on the daily. Last time we saw this candle pattern, price went from 6k to 19k in a matter of weeks.
Not expecting this again since we're in a bear market, but expecting another 9-10k test in a matter of weeks. #bitcoin pic.twitter.com/Ic8Keqc36M
— Galaxy (@galaxybtc) May 30, 2022
This analyst noticed a Bullish Engulfing pattern on the daily chart at the end of May of this year. The last time this pattern occurred, he said, was last year, ahead of the rally from $6,000 to $19,000.
However, against the background of significant pressure from sellers and low trading volumes with upward impulses, a significant price recovery did not occur. After several unconvincing attempts on the part of buyers trying to take control of the situation, the initiative soon passed back to the sellers.
As for bearish engulfing , this is already a pattern signaling a high probability of a change in the upward trend to a downward one. This pattern is formed if, at the end of an uptrend, a significantly larger bearish candle appears behind a small bullish candle. At the same time, it is desirable that the trading volume decreases when a bullish candle is formed, and increases against the background of a bearish one.
An additional factor in confirming a reversal is the appearance of another large bearish candle, preferably with small shadows (or better yet, no shadows), as well as the presence of price gaps.
***
In this material, only the main types of Japanese candlesticks and some elementary models based on them were considered. In fact, there are a huge number of such patterns. At the same time, models consisting of two or three candles are very popular. They all have mysterious names, for example: Clearing in the Clouds, Bull Harami, Morning Star, Three White Soldiers, Three Black Crows, etc.
Within the framework of this special project, it is impossible to talk about all popular patterns, describing in detail the mechanics of their formation, as well as giving all of them a psychological basis. However, for a deeper study of this topic, ForkLog magazine recommends readers the book “Japanese Candlesticks: Graphical Analysis of Financial Markets” by Steve Nison.
Subscribe to ForkLog news in Telegram: ForkLog Live - the entire news feed, ForkLog - the most important news and polls.
Found an error in the text? Select it and press CTRL+ENTER
Three inside up and three inside down
Three Inside Up is a trend reversal candlestick pattern that shows that a downtrend may have ended and a new uptrend is beginning.
Here are his criteria:
- The size of the first candle should be larger than the bearish one.
- The second candle must be within the range of the first candle.
- The third candle must close above the high of the first candle to confirm that buyers have completely overcome the strength of the downtrend.
The opposite is true for a three-in-down pattern that forms at the end of an uptrend.