- home
- >
- Forex
Hammer candle
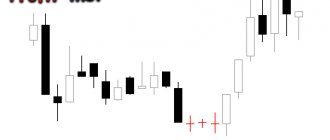
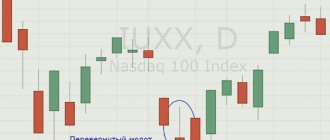
) occurs exclusively on Japanese candlestick charts and refers to bullish reversal patterns. It consists of one bullish or bearish candlestick, which has no or very short upper shadow, and the length of the lower shadow is 2-3 times the length of the body. Moreover, the difference between the maximum and minimum prices should be large relative to the trading range in the last 2-4 weeks. An example of a pattern is shown in the figure below.
Hammer candle criteria
To correctly identify the Japanese hammer candlestick pattern, all of the following criteria must be met.
- A clear downward trend should prevail in the market.
- Ideally, a candlestick should have no upper shadow, but in analytical practice its presence is allowed if the length is insignificant.
- The length of the candle body should be small, and whether the candle is bearish or bullish does not matter much.
- The lower shadow of the candle should be at least 2 times longer than its body.
How is a reversal candlestick pattern – hammer and inverted hammer – formed and what does it mean?
The psychology of the formation of this pattern is quite simple - the lower long shadow is nothing more than a signal that the price was pulled down by sellers with enormous force, but at the moment a turning point occurred, in which the advantage passed to buyers, who pulled the price of the traded instrument higher.
And this causes the formation of a short body and a long shadow of the Hammer formation. No matter how strange it may look, the Inverted Hammer candlestick pattern has the same properties as the Hammer pattern. On the price chart, our Inverted Hammer is also a bullish formation on a downtrend.
The conditions for the formation of the Inverted Hammer candlestick pattern are almost similar to the conditions for the formation of the Hammer pattern. The only difference is in the location of the long shadow - in the Inverted Hammer figure the shadow is located higher relative to the candlestick body. The color of this formation, as in the case of the Hammer figure, does not carry any meaning.
As a conclusion: it is quite easy to identify these reversal formations that indicate a support level and reverse the price on trading charts.
Important points when trading patterns: Hammer and Inverted Hammer on candlestick charts
These candlestick patterns are a sign of a reversal of the downward market trend in the opposite direction, that is, upward, and for this reason you should look for an opportunity to open buy orders.
In other words, if you found on the chart that a Hammer figure had formed, received confirmation that the trend had begun to reverse (the formation of a new long candle with a white body and an elongated lower shadow, a fairly large price spread was observed throughout the day), then you can safely open trades to purchase.
But there is one feature - the reliability and strength that our patterns have. The smaller the body of such a candle and the longer their shadow, the more significant the signal emanating from them.
It should be taken into account that the excessive length of the lower shadow of the Hammer formation or the upper shadow of the Inverted Hammer pattern (more than 3 times) may indicate panicky “throwing” of market participants.
Also, you should pay attention to the presence of strong bearish figures in front of the formations we are considering, and especially the “Maribozu Closing”. In such cases, it is better to refuse purchases. Also, it will be completely bad if our figure breaks through the support line with its candle.
As mentioned above, the color of the candle body in our formations does not matter, but it is an additional reversal signal. To put it simply, a white candle in these formations is a stronger signal in contrast to a candle with a black body.
We also note that if, during market analysis, in addition to the Hammer or Inverted Hammer pattern, no other figures are observed, then most experienced traders try to determine the occurrence of a moment of oversoldness of the assets being traded.
BEST FOREX BROKERS ACCORDING TO INTERFAX DATA
Top ECN broker, operating for over 20 years!
Now I additionally receive income from their cashback promotion ==>>> CASHBASK FROM ALPARI | review / reviews 2010. Certified by CROFR! | MAXIMUM BONUS | review / reviews Verified foreign broker |
START WITH 10USD | review / reviews Included in the TOP 3 leading ratings of Forex brokers. Great for Russia | MAXIMUM $1500 BONUS | review/feedback AS WELL AS THE BEST BINARY OPTIONS BROKERS IN 2022:
This options broker has the best reputation on the web!
| START WITH 10$ | review / reviews New fixed options. These are the only ones! | START WITH 1$ | review/feedback
Signal Boost
The reliability of the signal from this Japanese candlestick reversal pattern increases when the following criteria are met.
- The appearance of the hammer was recorded near a strong support level, and the closing price was above this level.
- The shorter the body length of a bearish candle, or the longer the body length of a bullish candle, and the greater the difference between the high and low prices, the higher the reliability of the bullish reversal signal.
- Although in the long term it does not matter whether the hammer is a bearish or bullish candle, in the short term (day trading) a bullish candle is considered a more reliable signal.
- The longer the lower shadow of the candle, the higher the reliability of the pattern.
Combining candlestick analysis with other technical analysis tools
In conclusion, I would like to say that we should not forget that candlestick analysis works great in combination with other technical analysis tools, such as trend lines, support and resistance lines of the trading range, channels, as well as indicator signals (oscillators, trend indicators, volume indicators). Several “live” examples from the Forex market – Figures 2.4, 2.5, 2.6, 2.7. Figure 2.4 shows a hammer that worked perfectly at the support of the downward channel on the weekly chart for GBP/USD. Figure 2.5 shows a hammer that gave a buy signal at the support of the trading range on the weekly chart for EUR/USD. Figure 2.6 shows two hanging on top that gave a sell signal on the weekly chart for USD/JPY. Figure 2.7 shows a hanging man who gave a sell signal at the uptrend resistance on the daily chart for AUD/USD.
Figure 2.4 Hammer at the support of the downward channel on the weekly chart for GBP/USD - candlestick analysis in practice
Figure 2.5 Hammer at the support of the trading range on the weekly chart for EUR/USD - candlestick analysis in practice
Figure 2.6 Hanging on top of the weekly chart for USD/JPY - candlestick analysis in practice
Figure 2.7 Hanging at the resistance of the ascending channel on the daily chart for AUD/USD - candlestick analysis in practice PS: If you take two traders who use Japanese candlestick analysis (candlestick analysis) in their work, and ask them to assess the situation on the same market, then most likely you will get two different results. The thing is that each of the traders has different principles of play, risk appetite and temperament. My point is that the trader’s personality greatly influences how he sees the market. Experience also plays a significant role in market analysis (including candlestick analysis). Gain experience and be successful!
"There is no shortcut to knowledge"
Author of the article: Mikhail Ivanovich Seryuga – creator and head of the Candle Market project
Psychological rationale
The formation of a hammer candle occurs against the backdrop of a downtrend and is usually accompanied by a sharp drop in quotes shortly after the opening of the trading session. After the intraday low declines, bearish pressure on the market continues. However, closing at a level close to the opening, but below it (in the case of a bearish candle), or above this level (in the case of a bullish candle), indicates an increase in bullish activity. If the bears' pressure on the market turns out to be weak in the future, many of them will decide to close short positions, while the bulls, on the contrary, will continue to open long positions. Moreover, if the hammer is a bullish candle, then this gives more confidence in a bullish reversal.
Reasons for education
The hammer reversal pattern appears on charts in a variety of areas. Usually, novice traders are too lazy to mark all the important levels, or they simply don’t know how to do it. Let us note the most important areas in which the appearance of the hammer figure is quite likely:
- The first thing you should definitely mark on the chart is the price support areas. They form where the price has already made a reversal. This is a classic Price Action, which does not lose its relevance and is based on a simple statement - there are zones of supply and demand that influence quotes. So we can expect repeated trend changes, both local and larger-scale.
- News background . This is an integral part of trading, so almost everyone has encountered such situations - the price has been falling all day, then a good publication occurs and the price rushes up, such a movement gives rise to a new trend. And it turns out that a relatively short-term movement ultimately provides prospects for a long-term position.
- Technical levels . Everything here is quite simple - there are impulses, there are corrections. The larger the trend, the more volume will accumulate near the Fibonacci levels and others from technical analysis. When a daily candle touches the level of 38.2 or 61.8, it can bounce very strongly and eventually close like a hammer candlestick pattern.
Buy levels and Stop Loss
The key level for opening a long position is the top point of the candle body, that is, the closing price. However, to make a final decision, you must wait for confirmation - the market closing the next day above this level.
The reference point for a Stop Loss order is the minimum price level of the hammer candle. At the same time, it makes sense to record a loss in two cases:
- the market closed below this level;
- For two days in a row, the minimum prices were below this level.
Trading by model
The hammer figure in candlestick analysis is traded very simply. There are different methods, including the inclusion of this pattern in a more complex technique, but all the differences usually come down to how to determine the goal of the movement itself after the reversal. There are no specific instructions here, so you can either focus on the size of the candle itself and set the take at the same distance, or look for other options. One of the most common is partial profit taking as the market moves and a new trend develops. As for entering the market, there are 2 methods, each of which has its own advantages:
- We wait for the completion of the formation of the model and enter the market at the opening of the next candle. If the time frame in question is large enough - at least daily, then you can enter a little earlier, 10-15 minutes, to avoid such an unpleasant situation as the widening of the spread and price jerks, which are usually observed at the beginning of a new trading day.
Entering the market using the hammer pattern - Since almost every candle has a shadow, you can wait until the price goes down within the next candle . This may be a local correction after growth has begun. This option will allow you to make a shorter stop, but at the same time there is a risk of missing an entry if growth begins right from the opening of a new candle.
In both cases, the stop order must be moved beyond the minimum of the hammer, that is, placed in such a way that even the repeated approach of the price to this mark does not lead to automatic fixation of the loss. You can move it 6-8 points from the minimum.
Effectiveness of the bearish hammer pattern
The bear's hammer illustrates human perception quite interestingly. Both bullish and bearish have a similar picture . It would seem that the only thing they differ in is color . A person usually tends to operate with templates. It's easier. This is understandable: digging into the details is energy-consuming and does not guarantee interesting calculations. But... let's be patient and look at the bear's hammer just as carefully!
The charts clearly show that trading volumes in no way help us use the bearish hammer. Anti-forecasts come true more than twice (183/84)!
Sadly?…. Not much! This means that it is possible to use this pattern as an indicator of the continuation of a bearish trend ! What additional information can be extracted from the Number of trades indicator?
The situation is similar to the one we saw above for the bull hammer. The value of the number of trades has a wider range for unsuccessful pattern forecasts. Successful forecasts are, on the contrary, characterized by a narrower range.
Rules for trading with these patterns
The basic procedure for working with these figures is almost no different from the general procedure for all figures:
- Technical analysis, which includes consideration of the location of candles in the area where the figure is located and the proportions of the formed pattern, as well as studying the connection with various levels when using main indicators.
- Using various indicators to facilitate the trading process: Fibonacci Grid, Color Macd, Stochastic, Shooting indicator, Ozymandias.
- Selecting a market and taking into account its features for trading with these figures, which will be discussed below.
- Focus on a suitable time frame, thanks to which you can get big profits.
- Pattern-based trading is the application of knowledge about the anatomy of patterns in action.
- Setting stop losses and take profits that minimize risks.
Markets
When using these patterns, trading is possible on both the foreign exchange and stock markets. But trading will differ depending on the type:
- Gaps between candlesticks are common in the stock market. The process of formation of such gaps is caused by some news. Stock markets are characterized by a gap at the end, that is, at the end of a trend.
- In the foreign exchange market, such a situation occurs rarely and usually at the end of the trading week (Friday-Sunday).
You can learn to manage the market situation when gaps form there. You need to learn to predict the disappearance of gaps (usually this happens at the opening of the stock exchange in Tokyo, when the market is revived), as well as the nature of the reversal. Gap trading is complex and carries a lot of risk.
Timeframes
Beginners are categorically not recommended to trade on short-term trading periods, since instead of profits they can get significant losses. Traditionally, a large time frame is considered the safest. Over a relatively long period of time, there will be fewer false fluctuations.
It is worth mentioning one useful detail that will increase profits. In trading, it is possible (and even necessary) to simultaneously analyze the market on different timeframes - large and small. Thus, using a long-term TF, you can determine the general trend, and by considering a short-term trading period, you can find the ideal entry point into the market.
We recommend reading about how to change and add timeframes in Mt4. You can install both standard and non-standard TF for trading.
Basic principles of trading
You need to trade under the “slope” of the Shooting Star based on these simple rules:
- A shooting star in the market is time to go short, it's time to sell.
- The figure should have the ideal shape that was mentioned earlier. The reinforcing sign is a bearish candle after the figure.
- It is worth understanding that not always good forms can meet the trader’s needs and often the trend does not change for some period of time, so there is no need to rush with stop losses.
- You need to use gain and resistance levels.
- You can enter by a closed candle, Sell Stop order (set just below the Low candle), Sell Limit (at the level of 38.2-50% of the star).
- The stop loss must be set at the recent high.
When using the Hammer, follow these tips:
- Just as with all patterns, it is important for the trader not to forget about the false and ideal signs of the pattern.
- When the hammer appears, you can open a deal (the so-called buy signal).
- Entry is available at the closing price, at Buy Stop (with an allowance of 4-5 points from the highest point), and at a limit order (50% of the hammer level).
- Only the hammer that formed at the end of the trend should be taken into account, otherwise it may not indicate a change in market direction, but passing impulses.
- There is no need to trade when bearish figures appear in front of the hammer.
- The stop loss will be at the minimum price.
Trading tactics with an Inverted Hammer, paradoxically, do not change.
Regarding the Hangman, it can be noted that the rules are similar to those when trading with the Hammer, taking into account the fact that the bullish strategy changes to a bearish one. But the risks are still greater due to the weakness of the signals than when working with the Hammer. You also need to look for ideal patterns and beware of bullish candlestick patterns ahead.
By carefully studying the features of these figures, you can achieve a level of mastery of these market instruments. Then making a profit will become as simple as possible, as will the figures themselves.
We also recommend reading about other Forex graphic patterns and their signals.
Market entry and stop loss.
You can place either a stop order to buy 2-5 points above the high of the confirmation candle, or, if you are confident that the price will move up, enter the market. In any case, your stop loss should be 2-5 points below the shadow (low) of the signal candle. This is only a rough guide. In volatile markets, you can move your stop loss further, just like for higher time frames. For example, for a daily timeframe, the stop loss is set at a distance of 5-20 points.
The larger the bullish candlestick that confirms the Hammer candlestick pattern, the more likely it is that the price will move up. However, if this candle is too long, you may have trouble using a reasonable risk-to-reward ratio.
For example, you might want to set a stop loss of 100 pips if the confirmation candle plus the signal candle together add up to 100 pips. Then the estimated take profit will be at least 150-200 points. If the resistance level is within these limits, then the probability of trading is assessed as low and you will have to miss this signal.
Candles and candlestick patterns are the pulse of the market, determining price action ( Price Action ) and the sentiment of market participants, which is the driving force behind price action.
Cryptocurrency data mining
At the time of writing this study, we have historical data on more than 1,000 cryptocurrency pairs. To carry out the task without the use of software processing is, to put it mildly, difficult.
We will use Python 3.7.7 as processing tools. We use libraries such as: scipy , numpy , pandas , plotly . Data mining is done using the Binance API. The sample size is 90 periods. We will use daily data. Let us note that, as practice shows, data obtained through the API may sometimes differ insignificantly from the data on the graphs . But... if you send trade orders via the API, this fact is not important.
Introduction
Candlestick analysis is one of the standard approaches in trading. With its help, they assess the current situation and make a decision to buy or sell cryptocurrencies. It, as a method, migrated from trading on commodity exchanges and stock exchanges to cryptocurrency trading. Candlestick analysis is based on standard patterns that are “sign”. These patterns are usually associated with a change, the beginning of trends. There are a lot of materials, articles, books that are devoted to candlestick analysis. But... the market is volatile. And... it’s interesting to determine how effective candlestick analysis patterns are ? How many of them are being formed and do they live up to expectations? Candlestick analysis contains a significant number of patterns in its arsenal. In this part we will look at:
Bull hammer, bear hammer.
