Hello, dear friends! Most traders have their own preferences regarding trading terminals. Everyone has their own favorite platforms on which they analyze charts and look for entry points into the market. Some people trade through MetaTrader 4 or 5 and are completely satisfied with the functionality, others trade through ThinkOrSwim and feel like they have no hands without it. We quickly get used to comfort , so when the need arises to work on another PC where the required terminal is not installed, we face serious problems. It was precisely this situation that prompted me to start looking for an online platform that could approach the capabilities of full-fledged terminals. The TradingView live chart is almost 100% analogous to full-fledged PC applications with one caveat - it does not require installation , that is, it is browser-based. You can work with it from any computer, you only need network access. In this review, I will try not only to describe the main features of the platform, but also to share my own experience of working with it.
Short description
As a small announcement, I will list the capabilities of this terminal:
- Almost all instruments that may be of interest to a trader are available. Currency and stock markets , you can work with stocks, futures, currency pairs, cryptocurrencies, and raw materials. The quote providers are the same as the top brokers, so there is no difference in quotes;
- There are a lot of indicators , the number goes into hundreds. You can create your own scripts and upload them to the library;
- All the necessary tools for graphical analysis . According to this indicator, TradingView leaves MetaTrader4 far behind;
- Powerful social component . Traders can share, for example, trading ideas (their display directly on the chart can be configured). So TradingView is also a real social network for traders;
- Module for full trading;
- Stock filter.
You can use the service simply to watch online currency rates on TradingView in real time, or you can make it your main platform for analysis. In terms of capabilities, it can easily compete with conventional terminals.
Initially, I was skeptical about this service. I couldn’t believe that online it was possible to implement almost everything the same as in the “desktop” version of the terminal. I think that after reading my review you will form your own point of view. Below I will leave a condensed video review indicating the main features of tradingview.com.
Why TradingView and not a broker's chart?
The broker's chart is, for example, an option from Wforex:
On platforms like Alpari there is no chart as such, it is indicative:
All these graphs have a lot of limitations. For example:
- you can’t see what happened to the price even an hour ago;
- it is not possible to use various indicators; usually there are three of them crippled, and they work strangely;
- graphs are not scaled - you basically cannot see the big picture.
This is where normal charts come to the rescue. There are a great many of them. But there are only two most popular:
- Metatrader;
- TradingView.
We will leave the MetaTrader alone - this is the topic of a separate article, plus, it does not hold a candle to the hero of this article. But Tradingview is what the doctor ordered not only for BO, but also for Forex and even stock exchanges.
Is it possible to combine the Tradingview chart and the BO broker?
You don't need to combine anything. Both the broker and Tradingview do the same thing - they simply broadcast the quote they receive from a third-party provider.
Where do quotes come from and what are they? Where do the candles come from, where do the prices come from?
Quotes are broadcast by prime brokers, specialized companies and investment banks. At the same time, on the charts you see indicative prices on the interbank market - the international foreign exchange market. It is also FOR eign EX change – FOREX.
However, interbank is unregulated. There is no common center that distributes these numbers. This is not surprising - banks are located in different countries, with different legislation, and currency trading is carried out in hundreds of systems, from ECNs like EBS or Currenex to various hubs and liquidity aggregators.
In other words, there are a lot of quote providers. They - the suppliers - simply give you a data feed, and you then show these numbers on your brokerage website or on a chart. Let's say:
- Binary shows quotes from Thomson Reuters;
- Tradingview shows quotes from FXCM (a well-known prime broker) and a number of other providers.
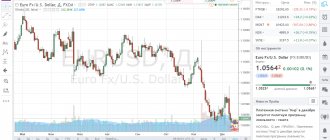
As a result, a beginner is faced with the phenomenon when the numbers on the brokers’ chart and in MetaTrader/Tradingview are different. For example:
There is no need to be afraid - this is how it was and will be. Quotes are always different. They all show the same thing, but slightly differently. And it doesn't matter. Microdifferences of a few thousandths in binary (and forex) are incredible.
The main thing for us is that the price movement simply coincides. So that when the price rises on all charts in the world, it also grows at the broker’s. It is not difficult to check the consistency of such a movement.
Remember: on a 1-minute timeframe, there are discrepancies between any charts not only in numbers, but also in price movement.
If you use a TF for at least 3 minutes, you can safely use a normal chart instead of a brokerage defect. Such as my favorite Tradingview.
On the broker's BO platform, you simply press the Up/Down buttons. And you do all the analysis on a normal chart.
Let's move on to its capabilities.
Registration in the service
Registration here is standard, but I’ll still focus on the main stages:
- After clicking the "Registration"A window opens in which you need to specify your email, password, and login. To simplify things, you can use the option of registering through one of the social networks, there is no difference;
- A confirmation letter will be sent to your email, follow the link in it;
- Registration is now complete . The service website is fully translated into 18 languages, there is TradingView in Russian, so there should be no problems at this stage.
When you verify your email, you will be redirected to the service page, you will be prompted to upload a photo and enter a name. This is an optional step , you can safely skip it.
We’ll talk more about subscription options a little later, but for now I’ll note that the full functionality of the service opens only after paying for access. But TradingView offers a 30-day free version for any type of subscription. There are no restrictions for those who use demo access .
Advantages and disadvantages
pros
- A huge number of charts of various types.
- Support for all trading instruments - from cryptocurrencies to government bonds.
- The opportunity to create and distribute your own ideas, make a name for yourself in the crypto community.
- Powerful social tools for user interaction.
- A special programming language for creating scripts.
- Paper Trading tool for free trading simulation.
- Regular addition of new features.
- Excellent reputation in the crypto industry – TradingView charts can be found on almost all cryptocurrency exchanges.
- The TradingView website has been translated into Russian.
Minuses
- Shareware platform.
- Limited number of supported brokers.
- Difficult to understand for an untrained user. You need to come to this service with a certain amount of knowledge.
Description of the service
After logging into tradingview.com, you will see the following picture. Popular authors and market overview are displayed at the bottom . They are traders just like you, but they actively use the social component. Their forecasts and opinions about the markets are read, which is how they end up in this section.
On the right is a whole set of buttons responsible for functions such as viewing personal messages, working with trading ideas, and contacting technical support. In the center there are 5 key tabs - ideas , markets , scripts , stock scanner and chart . I will dwell on each of them in more detail.
There is a search bar in the center. Here we will look for the necessary securities, just enter the company name and select the appropriate share.
Ideas
This term here refers to the opinions of other traders; anyone can publish their ideas. They are classified into:
- Trading and training. The first class includes ideas indicating possible entry points into the market; the essence of the second group is clear from the name. Educational posts include posts about risk management, the need to follow rules in trading and other trading-related issues;
- Types. When you hover over a tab Ideas A drop-down menu appears, in which the materials are divided into groups such as: asset class, trend and wave analysis, graphic patterns, indicators, Gann.
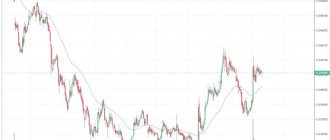
The ideas themselves most often look like several screenshots with chart markings, indicating entry points on it, key resistance and support levels. There is also a text explanation of what marks, in the author’s opinion, it is worth entering the market and what potential the signals have. This is what an idea from a popular author looks like for GBP/USD:
There is no single format for presenting ideas; here TradingView does not force traders into strict boundaries. In the training materials there are also just text posts without screenshots.
The Russian version offers the same functionality as the English version, but there are fewer authors of trading ideas. But among them you can find high-quality free analytics.
A lot of trading ideas are published, some authors specialize in currency pairs, others in the stock market. If you are going to use someone else’s free analytics, I recommend creating a pool of authors whose opinions you trust. Just subscribe to the signals and in the future you will not waste time searching for materials of his authorship.
There are some good authors on tradingview.com. The convenient thing is that you can first observe whether their forecasts come true.
Let me emphasize that the ideas service on tradingview com cannot be considered a ready-made recommendation for trading. These materials are published by traders just like you, so I would recommend considering them as an addition to your own chart analysis. Sometimes this helps to look at what is happening in the market from a different angle.
If you are looking for a good analytical portal , I recommend taking a closer look at investing.com. It is free, in addition to analysis of a whole set of indicators, there is also a powerful section with news, foreign reviews of not only the currency, but also the stock and crypto markets. There are fewer materials in Russian than in English, but what is there should be enough for a full analysis. I will do a review of the Investing service later, I will not duplicate the information, I recommend that you then follow the link and get acquainted with it.
Markets
This section contains comprehensive information on the instruments that are used to work on tradingview.com. All assets are divided into several categories:
- Currencies – and their number is an order of magnitude greater than what most Russian brokers offer. Besides majors (or main pairs) and popular crosses (that is, those in which the dollar is not involved) here you will find pairs such as, for example, USD/LKR (dollar and Sri Lankan rupee), USD/QAR (American and Qatari real). There are really a lot of tools, it’s not a fact that all of them will be useful, but for lovers of exotic things this is an excellent option;
- Stock;
- Indexes. There are a lot of them here too. The picture below shows a list of the main ones (Dow Jones and a number of popular ones), but there are dozens of others;
- Futures;
- Cryptocurrencies;
- Bonds;
- CFDs (contracts for difference).
For each of the listed asset classes there is a division into subgroups . For example, majors, crosses, and exotic instruments are distinguished for currencies.
In this section you will see 2 tabs - review and quotes . The first contains news, user analytics, videos and chart markings for all instruments. In order not to get confused in this abundance, it is possible to filter materials, for example, by your subscriptions (only those ideas whose authors you subscribe to will be displayed). You can sort by popularity, publication date, and so on. The quotes section directly displays the list of available instruments. By clicking on the name of, for example, a currency pair, you will see a line displaying the price change. If you click on the “ Interactive graph ” button, the same live graph will open in a separate window, on which you can perform your own analysis.
Below on the same page are trading ideas and the result of a summary technical analysis. The scale shows the trading recommendation for the instrument - from active sales to purchases. This advice is issued based on a comprehensive assessment of the schedule.
By going to the “ Technical Analysis ” tab, you will see for which instruments trading recommendations have been issued for a currency pair or other instrument. Pivot points are also calculated here . If you have worked with the Pivot levels indicator, you should know what it is.
Screener
This term refers to the ability to sort any instruments according to different indicators. Screener tab is located on the main page of tradingview.com. In it you will find:
- Signals for Forex and cryptocurrency pairs;
- The stock screener itself (in other sources it may be called a scanner - in this case these are synonyms).
Looking ahead, I will say that TradingView’s screener is not the best, in my opinion, in finviz this element is implemented somewhat better, it is simply more convenient to work with. There are no criticisms regarding functionality here, but there are some inconveniences . For example, when you go to the scanner window from the window with the graph, it “eats up” part of the usable area, which makes it not very convenient to work. As for Finviz, I previously reviewed this stock scanner, I recommend that you familiarize yourself with it.
On tradingview.com, the scanner looks like a large table containing lists of stocks of different companies. You can configure:
- Information update speed;
- Criteria by which the scanner will analyze securities, for example, information on income, balance sheet, etc.;
- Market type . You can work with shares of companies from all over the world;
- You can enable notifications for a specific type of event. For example, when the leader in capitalization changes, tradingview.com can notify you about this by sending an email, SMS to a mobile number, or simply sounding a beep.
Screener data can be saved to a PC in CSV .
Signals for cryptocurrencies and forex
In tabular form, tools characteristics are displayed in columns . On the surface, this is very similar to what we've seen for stocks. 4 column templates available :
- Review – general information on crypto assets will be displayed here. Opening price, change during the trading session, extreme points reached during trading, as well as rating. It indicates the trading recommendation;
- Dynamics – displays data on price changes for the last day, week, month. In the rightmost column is indicated volatility;
- Oscillators. The results of chart analysis based on a set of indicators are displayed here. Standard algorithms are used, most of which you have probably encountered in MT4 and other trading terminals. Just keep in mind that some are translated into Russian and may seem unfamiliar at first. For example, Awesome Oscillator turned into Wonderful Oscillator;
- Trending. Same result indicator analysis, but uses a different set of algorithms. Moving averages with different periods are used (a very common technique in Forex and other markets) and Bollinger bands.
The default screener view is shown. In the settings you can enable the display of additional information. For example, Pivot of points calculated using other dependencies, display of the upper and lower boundaries of the Keltner channel, Ichimoku clouds and others. You can customize the look of the screener for yourself and save this template so as not to waste time on customization next time.
As for signals for forex pairs, the default column template setup is the same as for cryptocurrencies. The only difference is that you can choose the type of tools you work with. By default, minor and major pairs are active; support for exotic instruments can be enabled through the settings if necessary.
I want to warn you right away - do not think that these signals will become a panacea for all occasions. This is a good assistant in work, nothing more . If you are just taking your first steps in the foreign exchange or stock market, then it is better not to rely too much on them, but learn to think for yourself. I did an extensive educational program on stock trading for beginners, a must read for beginners.
Scripts
Earlier I said that on tradingview.com you can create scripts yourself and upload them to the service so that other traders can use your developments. This tab contains everything they did on their own. Algorithms are divided into the following categories:
- Oscillators;
- Central oscillators;
- Volatility;
- Trend analysis;
- Volume;
- Moving averages;
- Market Breadth Indicators;
- Bill Williams indicators.
All scripts are also divided into indicators and strategies. There is also sorting by popularity. You can choose to display only the most popular ideas all time or the last week first. The description of the script contains not only instructions on how to add it to an online currency chart, but also the code. So if you have knowledge of programming, you can slightly modify the algorithm you like to suit your own needs.
Personal profile
I want to dwell on this in a little more detail. From your personal profile you can learn a lot of useful information about the trader.
Displayed here:
- Registration data , when the trader opened an account, how long ago he logged in;
- Reputation;
- How many trading ideas were published , what ratings were given to them by other traders;
- Number of subscribers;
- Distribution of activity by market;
- Favorite tools that the author uses to generate ideas.
Even a quick glance at someone else's profile is enough to understand whether you should trust this person's opinion. Of course, there are no 100% guarantees, but if a person has been on this service for more than one year, has published hundreds of trading ideas, and the number of subscribers is in the thousands, then his opinion is worth listening to.
TradingView Charts
Let's take a closer look at the TradingView online chart, the main tool for a trader. In order for working with it to be beneficial, you need to understand a number of nuances and make the appropriate settings. The graph contains four main menus; let’s look at their contents.
Menu on the left
Contains 16 categories of graphical analysis tools:
- Cursor type.
- Lines – rays, arrows, horizontal and vertical lines, trends.
- Fibonacci figures, fans, pitchforks and other graphical analysis tools.
- Geometric shapes - ovals, rectangles, triangles. They are more complex instruments designed for experienced traders.
- Adding text elements.
- Patterns, patterns, cycles, waves.
- Forecasting and calculating risk – projections, short and long positions. The Forecast tool is very popular among traders due to its simplicity. You just need to indicate the direction of price movement from the candle.
- Additional icons (arrows, emoticons, drawings, special characters).
- A ruler for measuring sections of a graph.
- Magnifying glass for changing the scale.
- Magnet with adjustable force - this tool helps to “attract” points of objects to the nearest prices.
- A lock that allows you to lock the drawing mode or disable locking.
- Lock for simultaneous fixation of all objects.
- “Eye”, with which you can hide or show all drawing objects.
- Remove drawing objects, indicators, or both.
- At the very bottom there is a tree of objects.
Drawing is easy and intuitive - the starting point of a line or shape is indicated, pressed with the mouse and modified until the desired result is obtained. You can change the thickness or color of the line, or save the drawing as a template. In addition, any tool can be added to favorites so that it appears in the settings panel and is quickly accessible.
Menu on top
This TradingView menu includes the following items:
- A field for specifying the currency pair with which all further work will be carried out. Simply enter the first letters of the asset and then select the desired option from the drop-down list.
- Timeframe – from 1 second to the specified number of months.
- Type of chart (Japanese candlesticks, bars, heiken ashi, empty candles, areas, lines, baselines, kagi, linear break, etc.)
- Adding a chart of another currency pair or trading instrument for comparison purposes with the first one.
- Indicators/strategies. A large number of different built-in and user scripts, as well as those created by you personally.
- Reporting. For each currency pair there are reports for certain periods of time (mainly quarter and year). Studying it will allow you to understand the dynamics of development and the prospects of investments.
- Templates. Managing indicator templates – choosing a ready one or creating and saving a new one. Everything is saved to the cloud and can be accessed at any time.
- Alerts. Most often, alerts are set at the moment of price reversal; this method is suitable for use in most strategies.
- Market simulator. Simulate real trading using Paper Trading, Trading View's own development.
- Buttons for undoing and redoing actions.
Menu on the right
On the right side of the Trading View website there is a vertical auxiliary panel containing the following functions:
- Quotes, information and news. Opens a list of quotes and information about the selected instrument.
- Alerts. Creating new alerts and logging existing ones.
- Data window. Opening price, closing price, minimum and maximum price of an asset.
- Market leaders. Opens a list of leaders in trading volumes for different countries of the world. Includes information about instruments and their price changes.
- Calendar. Economic calendar of events and forecasts of changes in asset values in connection with these events.
- My ideas. A list of ideas created by you personally. Each of them can be viewed, edited, or opened for public viewing. The idea is a short article in the analysis or teaching style, complete with graphs, screenshots and tags.
- Chats. Communication with live TradingView users. Messages are located at the top of the screen, and you can select a topic at the bottom.
- Personal chats. Personal dialogues with specific users.
- Ideas feed. A list of fresh ideas from those you follow.
- Notifications. History of notifications from the site.
- Application panel. Connect to a brokerage account.
- DOM – order book. Current buy and sell orders for the selected asset.
The Russian version of TradingView is quite viable, almost everything is translated and of very high quality. Therefore, beginners are recommended to use it.
Menu below
At the bottom of the screen you can select the screener you are interested in (forex, stocks, cryptocurrencies).
The “Notes” tab contains functionality for quickly creating notes.
The Pine Editor is a tab used to write your own scripts. The finished script can be immediately added to the chart or published.
The Strategy Tester allows you to quickly apply any strategy to a chart and test it. Strategies are either written in the Pine editor or downloaded from the Indicators and Strategies database.
Trading panel – here you can connect to a supported broker, log into your brokerage account and perform trading operations. TradingView supports the following brokers:
- Trade Station;
- iBroker;
- Saxo;
- Tradovate;
- OANDA;
- AMP;
- CQG FCM;
- Alpaca;
- FOREX com;
- Gemini;
- Alor.
After connecting to the broker, the “Buy” and “Sell” buttons will become available in the upper right corner of the chart.
Panel No. 1
Click on " Chart ". A window will open in which we will perform the analysis directly. Here you can work with indicators and graphic markup tools. The view of the window will be as in the figure below.
To add the desired currency chart, in the search bar we simply begin to enter the name of the instrument we are interested in. From the drop-down menu you just need to select the currency pair or share that suits you. Pay attention to the details, for example, if you want to find out the rate of a cryptocurrency and add an online chart of the same Bitcoin, tradingview.com has data from several crypto exchanges . Price may vary.
For convenience, the online currency chart can be expanded to full screen. This increases the area of the working window, and it becomes much more convenient to work.
Clicking the right mouse button opens a context menu in which you can:
- obtain information on the current instrument;
- change it;
- edit the time and price scale;
- add indicators and templates;
- work with alerts.
By clicking on the gear next to the name of the chart, go to the style settings menu . Here you can:
- choose the color of the candles and the style of the price line;
- choose scale type, set indentation;
- in the "Fill» colors are selected to display individual elements on the chart. Here you can disable the display of indicator parameters;
- time zone – local time is set;
- trading – you can configure the display of positions on the chart and whether confirmation of the transaction will be shown;
- events and alerts – in this tab you can configure the display of important events on the chart. If you leave them active, then markers corresponding to important news will be displayed on the chart of, say, a currency pair.
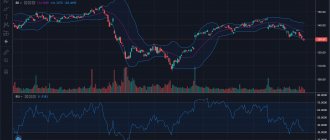
As an example, I’ll switch to a graph displaying the ruble exchange rate; circles are visible at the bottom of it. They correspond to important events (news). When you click on such a circle, a brief description of the news in English is displayed in the pop-up menu.
This feature is more useful for working with Forex instruments. On cryptocurrencies, for example, news is not displayed. You will have to monitor them yourself on specialized resources.
If you click on the eye icon next to the tool's name, it will become inactive. That is, the graph will disappear and a white background will remain. This feature is useful when comparing 2 tools when one of them needs to be disabled.
Scenarios for using a live chart
This tool can be used both as an auxiliary tool and as an analogue of a familiar trading terminal. For example, a live chart for binary options
can be used to search for signals, and then switch to the broker’s terminal and enter into transactions. Online platforms of BO brokers have extremely poor functionality; it is impossible to perform a full-fledged market analysis on them. For convenience, you can divide the screen into two parts and open the chart from Trading View in one, and your broker’s terminal in the other.
The live graph can also be used for training. Clicking on “Paper Trading” will open a demo account with virtual $100,000. This money can be used to trade directly through the Trading View chart.
If the broker is supported by Trading View, then you can work on a real account through a live chart. This can be done both on tradingview.com and through the broker’s website. Currently, the chart from Trading View is owned by the broker Intrade Bar.
Panel No. 2
The left side is reserved for graphical analysis . The matter is not limited to banal trend lines and horizontal levels of support and resistance. The arsenal here is impressive, there are Gann tools, Schiff pitchforks, Fibo elements such as the spiral, wedge and Fibonacci circle. The figure below shows an example of the tools available for use.
It is possible to simplify constructions in wave analysis. I don’t use exotic instruments in trading, but I highly appreciate the opportunity to use them. The developers do not limit the trader in choosing chart analysis methods.
For each of the tools added to the chart, you can adjust the line thickness, fill color, and transparency. It is very useful that you can immediately create an alert through the settings.
In the figure above, the window for setting an alert for the chart to go beyond the channel on a 2-hour timeframe is open. This is a useful function; if you use graphical analysis in your work, be sure to take it into account.
There are a couple of interesting and very convenient tools here - long and short positions, which are very convenient for calculating risk , the ratio between stop and take profit.
A short position tool has been added to the oil chart above . The range boundaries correspond to the stop and take profit positions. Based on the amount of the trader’s capital (set in the settings) and the position of orders, all the necessary ratios are calculated.
Data connection
The basic version uses test data. Next, you need to connect your data provider using one of two solutions: JS API or UDF . It is not possible to directly “feed” a data array. We will look at JSAPI; UDF is connected in a similar way, with the difference in specifying the endpoint on the server from where it will receive data.
- JS API - client side connection
- UDF - connection on the server side
The main difference between JSAPI and UDF is that UDF does not have the ability to add a WebSocket connection. When specifying an endpoint on the server, you set the interval for each request: datafeed: new Datafeeds.UDFCompatibleDatafeed('https://localhost:3000/datafeed', 1000)
Documentation
TradingView JS API adapter
To configure the adapter, you need to understand that each hook is executed sequentially and for debugging it is better to add output to the console about the launch of the hook console.log('[<hook name>]: Method call').
Launch sequence: onReady => resolveSymbol => getBars => subscribeBars => unsubscribeBars .
If you change the timeframe, symbol, the unsubscribeBars , which calls your function, which resets the WebSocket connection to the data provider. If you don't use subscribeBars , then you don't need unsubscribeBars The getServerTime hook is optional, but if you need to use server time, include it.
If the data provider does not provide volumes, you can specify resolveSymbol — has_no_volume: true .
export default { // Initialization of settings, must be given ASYNCHRONOUSLY onReady: (callback) => { console.log('[onReady]: Method call'); // setTimeout(() => callback(<
When the data provider does not allow you to request data directly from the client, for example the Binance exchange, so the request can be sent through a proxy.
JS API Documentation | Working example
TradingView UDF adapter
The UDF adapter is relevant when data is requested from its server. In the client constructor you need to specify datafeed: new Datafeeds.UDFCompatibleDatafeed('https://localhost:3000/datafeed', 1000)
// example of a plugin design for **Fastify** // main.js const app = Fastify() app.register(import('./modules/tradingview'), {}) // tradingview.js const plugin = async ( app, options) => { // check the endpoint is working app.get('/', (req, res) => { res.code(200).header('Content-Type', 'text/plain') .send('Welcome to UDF Adapter for TradingView. See ./config for more details.') }) // server time app.get('/time', (req, res) => { console.log('[ time]: Method call') const time = Math.floor(Date.now() / 1000) // In seconds res.code(200).header('Content-Type', 'text/plain').send( time.toString()) }) // analogue of onReady // https://github.com/tradingview/charting_library/wiki/UDF#data-feed-configuration-data app.get('/config', (req, res ) => { console.log('[config]: Method call') }) // called if: supports_group_request: true & supports_search: false app.get('/symbol_info', async (req, res) => { console .log('[symbol_info]: Method call') }) // called if: supports_group_request: false & supports_search: true app.get('/symbols', async (req, res) => { console.log('[ symbol_info]: Method call') const symbol = await getSymbols(req.query.symbol) return symbol }) // analogous to getBars, requests historical data app.get('/history', async (req, res) => { console .log('[history]: Method call') }) }
UDF Documentation
Panel No. 3
At the top there is a set of buttons responsible for:
- timeframe change (from minutes to months). Unlike MT4, you can create any intermediate time intervals here. In MetaTrader, this can also be done, but you will have to tinker with the “crutches” - install additional indicators and scripts;
- selecting a chart type – 11 in total. Some are not particularly useful, for example, line, area, empty candles. Below, BTC/USD is displayed as X's and O's. I recommend reading my post about Japanese candlesticks for beginners, in which I give a detailed description of the methods of working with them and how to get the most information from this type of chart;
- comparison of different tools in one window. Just enter the name of the one you need, and it will be displayed on top of the main one as a line. If you use it in trading correlation, this might come in handy;
- adding indicators, strategies. There are a lot of tools for analyzing charts, there are dozens and even hundreds;
- saving templates . The principle is the same as in MT4 - add the necessary indicators once to the chart, set their parameters and save the template. In the future, it will be enough to apply it and there will be no need to manually add and configure indicators again;
- alarm clock icon is responsible for creating alerts. Tradingview can not only remind you with sound that the specified conditions have been met, but also report this through SMS And send email. A total of 13 conditions are available (crossing, going beyond or entering channel boundaries, changing the course by a specified amount in%);
- in the right part of the top panel you can configure the graph display scheme . You can choose to display several in one working window, but this option is convenient only on large monitors;
- The cloud icon allows you to configure the frequency of saving changes on the chart ;
- The gear is responsible for going to the chart settings .
Selecting the right tool
Trading View supports hundreds of financial instruments - currency pairs, stocks, futures for oil, gas and other commodity market instruments, CFDs, indices. For convenience, all tools are divided into categories.
For each instrument, not only its full name is shown, but also its ticker, as well as the source where the information comes from. Shares of the same company can be traded on different platforms, you can choose the one you need.
In the “All Exchanges” section, you can limit the search for the desired asset to a specific exchange. Trading View supports several dozen stock exchanges, the largest Forex brokers, and cryptocurrency exchanges.
Panel No. 4
General information is displayed on the right side of the terminal. From top to bottom there are windows with:
- list of tools;
- trading recommendation for an open instrument;
- news.
On the right side there is a set of icons. Let me decipher their designations:
- Magnifier – responsible for displaying quotes and news;
- Alarm clock is a manager for working with alerts. Alert history is displayed;
- The list icon is responsible for displaying the data window;
- Fire icon – a window opens with market leaders according to a given criterion;
- Economic calendar;
- Bulb – a list with your ideas opens. You can enable the display of trading recommendations directly on the chart. They will appear in the form of multi-colored circles above the candles. After hovering the cursor over such a circle, a brief description of the idea will appear, its author, but if you click on it, you can read the full description. The function is useful, but I recommend that you first create a pool of authors whose opinions you trust. Thousands of people use the service, almost on every candle 2-3 ideas appear (sometimes in different directions), this confuses and confuses;
- Below are buttons responsible for switching to general chat and personal messages ;
- The last two icons are the ideas feed and notifications .
Panel No. 5
Below the graph there are also several important menus. Here you can work with tools such as:
- Screener, its functionality has already been discussed above. It's not very convenient to use. The figure below shows that after the opening, the Bitcoin chart almost halved in height. From the developers' side, it would be more appropriate to open the scanner in a new window;
- Notes – existing ones are displayed, it is possible to create new ones;
- Pine editor – if you have programming skills, you can create your own scripts and indicators;
- Strategy tester – any TS and indicator can be tested in the same way as you do in MetaTrader4;
- Taking screenshots - this is done by a button with a camera ;
- Trading panel – brokers supported by tradingview.com are displayed here. If you have an account with one of them, you can trade directly from a live chart;
- Create an idea . And then you can share it with other traders.
Just like in MT4, stop and take profit can be set here by simply dragging the trade opening level up and down.
Interesting indicators on TradingView
In one review, it is physically impossible to give even a brief description of all the indicators of this service. Therefore, I have identified several algorithms that are most interesting in my opinion; the list is shown in the figure:
The link below is a small guide to using indicators in general .
Sling Shot System
A full-fledged trading strategy, work is carried out according to the trend . Let's look at the principle of trading using an example from the author.
In the picture above:
- Red triangles at the top of the window indicate the direction of the trend ;
- The color of the channel indicates the market sentiment ;
- Entry into the market is carried out either as aggressively as possible, that is, at the moment the chart touches the channel, or after a rebound has been formed. Candles yellow colors match aggressive entrance, blue – conservative.
This technique works on almost any timeframe. Above is a series of signals on the hourly chart.
Weiss Wave Volume
The volume indicator differs from the usual one in that it reacts more strongly to the movement of the chart. The author claims that using WWV will make it possible to easily find areas of interest of major players.
If you compare it with a regular volume indicator, you can see that WWV really reacts more sharply to chart changes. The indicator is a clone of Weis Volume Plugin for another trading platform (the author does not specify which one).
It is not recommended to use it for Forex, but it is perfect for stock charts .
Linear Regression Slope (version 2)
This version differs from the first version in a large number of settings, and the methodology for constructing a regression line has also been slightly redesigned. Otherwise, this is the same indicator, built on the basis of linear regression .
The author uses this tool together with the volume indicator. The approach works on all timeframes, but the developer gives preference to hourly charts.
Externally, the indicator strongly resembles MACD. You can use several signals:
- The intersection of the regression line and the zero level;
- Divergences;
- Intersection of line and histogram.
Madrid Moving Average Ribbon
This indicator is a combination of several regular or exponential moving averages . The approach is not new, and I mentioned it for the reason that everything is implemented well here.
In total, almost two dozen moving averages with different periods are used. Depending on their location relative to each other, the color changes. Red indicates a bearish market, green indicates a bullish market .
This tool is good for identifying trends, but I don’t recommend using it in flat areas. The lines intertwine with each other and give false signals .
Moving Average Colored EMA/SMA
This is a colored version of regular moving averages. The name includes the prefix EMA/SMA; the author added to the tool the ability to display 2 moving averages at once. Through the settings, you can enable the display of not only exponential moving averages, but also simple ones.
The color of the line depends on its direction. When both moving averages are enabled, we get a simple trading strategy. You just need to experiment with the settings.
Squeeze Momentum Indicator
This is an adaptation of John Carter's TTM Squeeze indicator. Allows you to find moments when the market is just preparing for a sharp movement. When black crosses appear on the horizontal axis, this indicates that the Bollinger Bands are inside the Keltner channel . At such moments, volatility is at a minimum, and this ends with sharp and strong movements in the chart.
According to Carter, work is carried out after the appearance of a gray cross after the black one. The direction of trade indicates the position of the histogram relative to the zero level.
It is allowed to take into account divergences .
This indicator can be used in conjunction with the Sling Shot System , this strategy is called Shot System and it uses the Squeeze Momentum Indicator as a filter . For example, for a sell transaction, an arrow pointing downwards should appear, and the histogram should fall and be red at this time. This approach filters out most false signals.
Fixed range
This indicator plots horizontal volumes , highlighting the most important levels for traders. You just need to manually specify a fragment of the graph; a horizontal histogram will appear on the left side of the terminal. The line will show the most important level.
You can work with it in the same way as with regular support or resistance. This indicator is applicable both on Forex and on the stock market. I have a good article about support and resistance levels, I recommend you read it.
JS API getBars hook is called many times
This happens when there is not enough data and the library independently tries to “upload” the information. getBars hook has a firstDataRequest that returns a boolean value true\false, use it. Returns true only when the market is loaded.
getBars: (symbolInfo, interval, from, to, onHistoryCallback, onErrorCallback, firstDataRequest) => { console.log('[getBars] Method call', symbolInfo, interval) console.log('[getBars] First request', firstDataRequest) if (firstDataRequest) { console.log('do something') } },
Scheme of working with the service
Below I will provide sample instructions for working with this service. For myself, I outlined exactly this action plan:
- First, activate your subscription to the PRO version (you can limit yourself to a trial). You will learn how to do this in the next section;
- Then you need to work with stocks and indices. Analyze them and create portfolios, diversify risks, do not rush from one extreme to another;
- For indices we use Weis Wave Volume, for stocks – horizontal volumes, we use graphical analysis to determine the direction of the trend and important levels. It is very convenient that if you apply the indicator to one instrument from the list, it will be applied to the rest of the portfolio components;
- To quickly calculate risk, TR and SL values, we use the tools “long and short positions” ;
- After completing the analysis, we determine from which levels we can enter the market. We definitely place alerts on them on trading charts. Then we just wait for the entry point into the market.
Conveniently, you can import a list of instruments included in the portfolio and export it to Trading View in the future.
Something doesn’t work for me, I’m doing everything according to the documentation
A real case, a freelancer approached me with a project, the project was old, he was rewriting it. As a result, there was simply an old version of the library. Check the version.
Another situation is when they try to call methods on a chart that is not yet loaded, monitor the state via onChartReady . If there is no reactivity under the hood to track the loading of the graph, use the Observer .
widget.onChartReady(function() { // It's now safe to call any other methods of the widget });
TradingView Subscription Types
Full functionality is available only to those who have signed up for a paid subscription to the service. Without this, you will not be able to access, for example, some indicators and some types of charts. On tradingview.com you can sign up for a 30-day free subscription to any of the tariff plans and use the service without restrictions. Many people take advantage of this loophole and simply change their email once a month and register again.
In addition to the free option, tradingview.com has 3 paid subscription levels. There is a detailed comparison on the site, I will not duplicate it, I will only note a couple of important points:
- There are no restrictions on the number of saved charts only with the premium subscription ($59.95 if paid for 1 month). For pro and pro+ plans there is a limit of 5 and 10 schedules respectively;
- There are restrictions on the number of indicators on the chart. For pro, pro+ and premium plans the limit is 5, 10 and 25 respectively;
- Users with a premium subscription are eligible for priority support.
As for the free subscription, to register you will need to enter your bank card details and confirm your subscription via phone .
Just click on “ 30 days free ” and follow the instructions.
When the month is up, you can register again, subscribe again and continue to use TradingView for free.
Design customization
By default, two themes are available: theme: “Light” || "Dark". You can also use your own color schemes. Over time, you will encounter a problem when the colors have changed everywhere except the header_widget (the top block with the search, compare, etc. buttons), it needs to be changed through .css .
In the widget options you need to specify: custom_css_url: '/tradingview.css', where / is the absolute path from your index.html. With content:
.chart-controls-bar { border-top: none !important; } .chart-page, .group-wWM3zP_M- { background: transparent !important; } .pane-separator { display: none !important; }
Documentation
TradingView Affiliate Program
The service administration decided not to fool themselves and their clients with a multi-level affiliate program. Therefore, one rule applies here - for each attracted client you will be given 30% of his payments . So the referral will generate income for you as long as he remains an active user of tradingview.com.
To be able to attract clients, you need to:
- Register as a service partner;
- Get a referral link;
- Start attracting clients. TradingView provides all the materials necessary for this free of charge .
You can withdraw money after the amount of affiliate contributions exceeds $300.
Results
TradingView has no analogues among online platforms for trading and chart analysis. The service works online, which means that you do not need to download a separate Android application for your phone, tablet and PC. Just go to the site, log in and start working.
Tradingview.com cannot be called ideal. There is, for example, no ability to perform normal volumetric and cluster analysis. The stock screener is not very convenient to work with because it takes up space and the chart becomes too small. You will probably find some other shortcomings. But they cannot be called critical. For the vast majority of traders, the opportunities that exist will be quite enough. Nowhere else will you find online functionality comparable to full-fledged PC applications.
This is why I recommend mastering live charts from TradingView even if you have constant access to your PC. Situations in life are different, and having the opportunity to work from anywhere in the world will definitely not be superfluous .
This concludes my review. It turned out to be quite voluminous, but there is no other way - there are too many functions on tradingview.com to get by with a couple of phrases to describe them. Surely you still have questions , I will be glad to answer them in the comments . Subscribe to my blog updates. This will allow you to be the first to know when new materials are released. All the best and see you soon!
If you find an error in the text, please select a piece of text and press Ctrl+Enter. Thanks for helping my blog get better!
Trading through brokers on TradingView
The Trading View platform supports 11 verified brokers; you can synchronize their accounts with your account and gain access to financial transactions with assets. If you don’t want to open a brokerage account yet, you can use the Paper Trading trading simulator. In this case, all “transactions” will be simulated on the company’s servers. Another option to practice is to open a demo account with a broker. Almost all brokers provide this opportunity. You need to create a demo account on his website and link it to TradingView by entering your credentials.
The service is gradually adding more and more new brokers, but this is not a quick process due to technical and legal limitations.