olegas Jan 18, 2022 / 173 Views
Another classic figure in technical analysis is the Pennant pattern. In its form, the “Pennant” pattern resembles such patterns as “Triangle” or “Wedge”, and in its essence, the “Pennant” is a trend continuation pattern.
What is the difference between the “Pennant” patterns and the “Triangle” and “Wedge” patterns? This difference is quite obvious and consists in the fact that the “Pennant” figure, unlike the other two, has an element called a flagpole (see figure below).
The formation of a pattern occurs as follows. First, there is a sharp rise in price initiated by a wave of purchases (a flagpole is formed). Then there is a pause, the market “digests” the consequences of a sharp rise (a pennant is formed). After this short rest, the price again continues its strong upward movement.
Description of the graphical model - what is it?
The pennant pattern in technical analysis is a pattern of continuation of movement on the stock exchange. Usually confused with the flag formation due to the same structure and the presence of impulses with corrections.
The pennant is one of the most common formations that can be easily found on any trading instrument.
In the article we will analyze what a pennant on a chart means, the main trading strategies, and the logic of formation. We will also consider setting a stop loss with a take profit and compare it with other technical analysis figures.
The technical analysis pennant visually resembles the object of the same name
Fundamental base
The appearance of the Pennant means short-term consolidation. In simple words, this happens when, due to too active speculation in the market, an imbalance of volumes arises and the market for some time cannot determine the overbought/oversold zones. This happens after strong news or when large StopLoss are removed in the area of critical levels.
If a bullish or bearish Pennant has generally decided on the trend, then a horizontal Pennant is similar to a symmetrical Triangle, that is, it shows a temporary market balance of buyers/sellers with a slight advantage of the current direction. After the pause, the market should continue the price movement according to the previous trend. To trade, you must check for the presence of a similar pattern in older periods.
Characteristics of the Pennant pattern on Forex
Models cannot begin to form without a push. They need a price jump, a sharp movement.
Structure of the technical analysis formation:
- Two flagpoles (another name for flagpole ).
- The panel is a price pause, which consists of 3-5 price fluctuations.
itself is located between two sharply converging trend lines . The upper leg represents resistance and the lower leg represents support.
The shape of the panel is not always symmetrical, but always triangular.
Why does the Pennant figure appear in technical analysis?
Let's analyze the balance of forces in the market according to the alternating phases of the formation of a bullish model:
- Rising movement. Buyers have complete control over the price. The section of the chart is characterized by the entry of large players to the exchange.
- Accumulation. In the middle of the trend, a banner appears. Many speculators begin to fix their purchases, fearing a reversal. A pullback provokes other traders to sell, anticipating a change in trend.
- Next price impulse. Such machinations of large players within the accumulation phase lead to a sudden increase in quotes and the collection of sellers’ stops.
Varieties
The types of patterns differ only in the further price movement.
- Rising
- Descending
It is important to look for price patterns in a trend, not a flat.
Rising technical analysis pattern
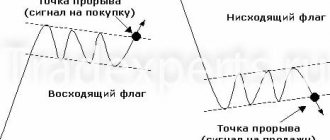
A bullish pattern occurs when the flagpoles point upward at an angle , with a banner between them. Impulse can be represented by any number of Japanese candlesticks . Consolidation always consists of several short price fluctuations.
A diagram with an example of construction on a graph is shown in the figure.
Inverted pennant
The bearish version of technical analysis appears in the opposite direction. The impulse picks up speed with a downward slope , and the subsequent correction has a fleeting period with the continuation of the trend.
Logic of model formation
What is the purpose of the Pennant, and why is it a signal for a trend to continue? The explanation is as follows:
- • The formation of an impulse in front of the figure is a sign that a group of large players is beginning to actively join the market. First they provoke a crowd, and then a large flow of orders appears from small traders and other speculators. • Consolidation - temporary decrease in activity. During it, large players may unload or accumulate positions. Transactions are partially closed with impulse. Many people try to see a reversal here, mistakes are made, as evidenced by the presence of a flow of orders in the opposite direction. • New impulse. Within the consolidation, everyone made a decision about where the market would go next. Now the big players are again provoking the crowd to go in one direction or another in order to bring their orders into profit.
At the peak of any momentum, fear reigns among traders. It is one of the reasons why the Pennant is formed, because those who are afraid of losing profits from a strong movement try to close positions faster. They create a flow of transactions in the opposite direction.
A small crisis arises for the trend, since those who wanted to have already entered the market, and those who did not have time to run into a new crowd closing transactions in a different direction. When it becomes obvious that the movement will not reverse and this is just a temporary break, players enter into trades again and form a new impulse.
Difference between pennant and triangle technical analysis patterns
We will look at the similarities and differences with a symmetrical triangle. Because the ascending, descending and diverging triangle have little in common with the figure in question.
Main similarities:
- Same construction and triangular shape of the price range.
- After leaving the boundaries of the figure, the market continues to move along the trend.
Main differences:
- The difference is in the scale of the figure . A pennant is a small triangle of several impulses that forms faster.
- There is no need for impulses in the triangle. Traded during a rollback to the trend line after the price exits the pattern.
You can read more about the triangle in the article Triangle pattern in technical analysis.
Practical examples of the pattern
Trend correction according to the Pennant scheme is not always clearly displayed. What does it mean?
This graphic pattern is significantly weaker than the more classic Flag pattern. You can assess the likelihood of the model working out by the accumulation of trading interest at the breakout point, but if the Pennant has an inclination in the direction of the current trend, then such signals become even more unreliable.
The most effective strategy for Pennant is the classic breakout of boundaries. We are waiting for a breakthrough, fixation of the bar behind the key zone (the retest strengthens the signal) and open a trade in the direction of the breakout. Those who are ready for aggressive trading can place a BuyStop/SellStop pending order behind the key line of the model. You can even place a bunch of layaways in both directions, because the chances of the Pennant being realized using the “Reversal Wedge” scheme are quite real.
The flagpole is rarely worked out completely and the problem of correct TakeProfit arises. You need to use ordinary trading logic and consider targets at Fibo levels, in the zone of round levels, local Forex extremes or according to money management.
A classically correct pattern on a chart is rare; a shortened version appears more often: the first impulse, a rollback of 30-45% and the trend continues. We remind you: the trading targets of the model are calculated from the breakout point, and not from the beginning of the formation of the Pennant. The minimum TakeProfit is obtained at the level of the pattern height (or better yet, the height of the flagpole) at the breakout point, the next one is at the height of 50-70% of the flagpole. If a strong price level falls within the range of the flagpole, then it is recommended to use the “shortened” option - from this level to the max/min of the entire model.
Difference between pennant and flag figures
The pennant goes closely with the flag technical analysis figure. The reason for this is that the formations contain an identical structure, namely equilateral . They are united by the way prices go beyond their limits. However, the pennant is organized more quickly than the flag. Also, a smaller time frame is required, which provides a comfortable entry into the market.
The main difference from the flag is that the lower sloped line of the accumulative range is not parallel to the upper side in the pennant.
Organizations
Currently in Russia there are several organizations, football and hockey clubs bearing the name “Vympel”:
- A special purpose group belonging to the Russian FSB. This special unit carries out special operations on the territory of the Russian Federation. Today, the center’s work is aimed at conducting counter-terrorism operations. This is the elite of the Soviet special forces school, considered one of the best in the world (according to some estimates, the best).
- A design bureau that develops and produces aviation weapons, for example, missiles of various classes (air-to-surface, air-to-air). It also develops anti-aircraft missiles for use in missile defense and air defense systems.
- Bureau for design and technical support of vessels of various purposes and classes. To date, more than 6,500 vessels, as well as waterborne engineering structures, have been built according to the designs of this design bureau.
- A complex of enterprises working in the field of missile and space defense.
- Radar station.
- A plant producing vessels of various classes and purposes, located in the city of Rybinsk.
- “Vympel” is the name of football clubs, one of which is located in Korolev and the other in Rybinsk.
As you can see, this term is found in various spheres of human life, although many associate it only with the flag.
Difference between pennant and wedge patterns
The wedge also has a triangular shape, but reverses the trend when the price goes beyond the geometric figure.
The main difference is whether the wedge price consolidation narrows at an upward or downward angle. The pennant panel can converge at different angles depending on the trend.
A wedge that continues to move is often called a pennant.
How to trade - pattern trading strategy
To enter a trade on a bullish type of structure, you need the following algorithm of actions:
- Define impulse movement
- Monitor the formation of a flat
- Draw straight lines along the minimums and maximums . The segments must be constantly narrowed
- Wait for the maximum of the panel to break upward and at this moment open a long position.
- Take profit is delayed from the last low at support by the length of the flagpole.
- The stop loss is placed beyond the minimum of the candlestick range.
Rules for breaking a pennant - a classic way of trading
The reverse formation of technical analysis is traded in reverse.
Alternative approaches are possible for entry
- Open a deal when the breakout candle closes beyond the breakout point.
- Additional confirmation , namely from indicators.
- Strong volumes at the end of the first flagpole and the beginning of the second.
may occur where a trader is already in a trade when a graphical pattern appears . There is no need to rush to close the deal; you can get by with partial profit taking and wait for further development of the situation . to take more profit from a large price surge
Using pending orders
options for how to place a pending order:
- Stop order at the breakout border.
- Limit order on a return to the trend line . The situation is rare because more often than not the second flagpole begins with a sharp recoilless impulse.
The convenience of the method lies in the absence of the need to constantly monitor the schedule. At the same time, you can devote more time to other assets.
Aggressive entry
The essence of this method is to predict at the stage of formation of the canvas the future continuation of the trend . That is, the entry is made at any point of the correction.
A significant disadvantage is the danger of entering on a reversal.
The advantages include the fact that take profit is set to a large value, and stop loss is very short.
Application of volumes
A common situation on the chart, which can be seen using the trading volume indicator:
- Growing volumes on flagpoles
- Reducing the diagram when forming a panel
Individual cases of pennants
Here we will talk about wave structures that every trader would do well to know. They do not require deep knowledge of Elliott theory, so they will be a good addition to non-wave trading. So, in accordance with Elliott's theory, a corrective form consisting of 5 movements in a narrowing, that is, a triangle, in any movement will mean a continuation of the trend, while it will precede the final movement. Simply put, pennant patterns will very often be the second to last within a trend. This confirms the very meaning of the trend continuation figure and at the same time will bring some clarity to the construction itself. In this regard, let's look at cases that may be useful when considering corrections and guessing our pattern:
- According to Elliott, a triangle has 5 waves. Everything is simple here, our pennant is also usually five-wave, three-wave designs can be considered, but they are not very reliable. Since it is usually difficult to see and distinguish ideally defined 5 waves, and besides, drawing the generators does not always have the only option, you can also see 7 waves. In any case, the most important thing is the narrowing, everything else is details.
- There are times when the narrowing seems to stretch. The case is not very common, so it does not deserve special attention. You just need to remember that not only 5 and 7, but even 9 waves in a triangle are possible. Elliott himself presents this as the formation of this form within the last wave of the triangle. A triangle within a triangle is obtained. This also does not affect the trading plan in any way, it just extends the wait over time.
Long tapering pennant - An incorrectly defined pattern can cause us to expect an upward movement, but instead we end up with a bearish pennant. And all for a simple reason - wave B is presented in the form of a five-wave structure with narrowing. This is provided for by the theory, so you need to very carefully monitor how our triangle is drawn, whether there was a strong wave against the trend before it, which became the first correction wave, after which the triangle began.
Bearish pennant
An example of trading a pattern on the market
Although a pennant rarely appears on a chart, in practice there are exceptions when there is a whole series of patterns one after another.
On the USDJPY currency pair, at the market lows at the beginning of each day for three days, a whole scattering of models appeared . There were three good opportunities to take profit . The last time another price jump had a strong impact on the asset and a global trend change occurred.
Example of trading on Forex (Metatrader 4 terminal)
It is not uncommon that after the formation of the second flagpole, the price reverses almost immediately. It is this feature that is associated with setting take profit.
At the close of the signal candle, which broke out of the frame, the trader buys EURUSD. After an impulse movement with acceleration, the risk to reward ratio is 1 to 2.
The stop loss of the example could be placed just below the nearest low of the buy candle by several points.
Wedges
Oh, and some wedges too! In fact, a wedge is another variation of a triangle, where two converging lines are formed by a series of highs and lows, as shown in Fig. 12-3.
Rice. 12-3. Wedges
But there is one nuance here. A triangle consists of one falling trend line and a second rising trend line, or a rising/falling line and the second is horizontal. In a wedge, both trend lines point in the same direction, just like in a pennant.
A falling wedge is a temporary respite for a growing trend and, conversely, a rising wedge is a falling trend. When forming any wedge, it is desirable that the volumes decrease. Well, since it takes 2 to 8 weeks to complete a proper wedge, wedges are often caught on weekly charts. During menstruation, they are too short, not counting, of course, the royal ones, which we talked about in the last chapter.
Rising wedges are often found in bearish trends. Upon their completion, the price likes to break down sharply, especially if the breakout occurs on large volumes. Pennants and wedges are close relatives in that both consist of converging lines and are directed against the underlying trend.
But there is a difference and it is significant - in the pennant the breakdown occurs very close to its “tip”. With a pennant, you can project the lines further and there they can converge - often literally, right on the chart.
In Fig. Figure 12-4 illustrates exactly this concept, where the projected trend lines for the wedge converge after the breakout has already occurred.
Rice. 12-4. Pennant and wedge
The pennant on the left looks like an ordinary triangle. Sometimes the difference between two patterns is quite tenuous. For example, in chart 12-6 the pattern is called a pennant, but some would call it a wedge. In any case, wedges take longer to form than pennants, which is worth remembering.
Chart 12-10 shows Yahoo shares with a growing wedge that appeared after the price fell.
Schedule 12-10. Yahoo shares, daily TF
At the time of the breakdown, the lines were not even close to closing, but the volumes on the day of the breakdown jumped, as expected. In general, in a bear market, prices often fall under their own weight.
However, as soon as activity in the market increases, it means that sellers have woken up, are motivated, and the entire market as a whole is on a bearish track.
In Chart 12-11, Vitesse shares show us an excellent example of a small growing wedge, a benchmark in terms of price action.
Schedule 12-11. Vitesse shares, daily TF
The volumes, however, are not quite typical, since they do not contract during the formation of a wedge and do not expand during a breakout. Based on this example, it is clear that a good wedge can form without confirmation by volumes.
However, if volumes fall when a pattern is formed, and shoot up sharply when it breaks out, this situation increases the mathematical expectation of the transaction to the maximum.
Sometimes it is enough to reduce the volume when forming a pattern, which will be a powerful indication of its full completion.
False breakout and traps for traders
The flag and pennant shapes take the position of a continuation pattern when the conditions for creation are fully met.
If an important support level appears before a bearish pattern, then most likely the price will rebound from it and not fulfill the take profit . An example demonstrates this. It can be seen that there is no subsequent abrupt downward movement, and after a false breakout, the graph curve reverses.
Pros and cons of Pennant as a technical analysis figure
The main advantages and features of figure trading:
- It will be useful for novice traders to trade using an algorithm with prescribed breakout rules.
- Ease of Formation.
- Corresponds to the golden rule of trading: open trades primarily according to the trend.
- Occurs on all time periods of the MT4 terminal.
- A good risk to reward ratio is used.
If we look at the shortcomings , we can highlight:
- The probability of running into a false breakout . This situation occurs predominantly near the support (resistance) level.
- Rarely found . Speculators often see the formation of a pennant after working out.
- Anticipating the formation of a candlestick pattern and opening an order without the start of a flagpole. Market instinct is the reason why many traders fail.
Technical parameters of the model
Technical analysis began to highlight the Pennant as a special trading pattern relatively recently: it has a strong “visual” connection with the classic Triangle (support/resistance zones) and with the Flag (“flagpole” and “panel”).
Correctly identifying such “relatives” is quite difficult. As a result, the Pennant and Flag patterns should be realized in the same way, and what will happen after the symmetrical Triangle depends on the dynamics of volumes, so additional analysis cannot be avoided.
Basic scheme for forming a Pennant:
- Price impulse (large volume manipulation, news speculation or other market force majeure).
- The second impulse is a rollback - market makers fix transactions after the first impulse and open new orders.
- Flat period – the price amplitude gradually decreases.
- The main trend is restored and positions opened in the second stage are closed.
In the area of the “canvas” of the Pennant, it is necessary to clearly form not 3-5 waves and the breakdown of the pattern border must occur before the calculated intersection point. If the market has already passed the virtual top of the model, but the flat continues, then all potential Pennant signals need to be canceled and the analysis must be performed again.
