iMOEX - what is it?
IMOEX is a price composite index of the Russian stock market, calculated for the most liquid shares of the largest issuers, taking into account their market capitalization. Its structure includes companies with types of economic activities related to the main sectors of the Russian economy. It began its history on September 22, 1997 with a starting value of 100 points.
The Moscow Exchange Total Gross Return Index is the main indicator of the domestic stock market, showing the direction of its movement. Its previous name was MICEX. It includes the 50 most liquid securities of Russian joint stock companies. The following symbol (ticker) is used on the exchange: IMOEX.
The main purpose of the Moscow Exchange Index is that it is used as a benchmark for constructing the majority of mutual funds in Russia. Thus, it is used as a benchmark for investment funds, analysts, portfolio managers as well as general investors. In general, if the value of this indicator grows, then the Russian economy is growing. This allows you to assess the economic situation in the market and predict its direction in the future.
It is important. Sometimes IMOEX can be used for other purposes. It is used to know when it is necessary to suspend trading in shares on the Moscow Exchange in cases where this is provided for by the Law “On the Securities Market”.
A little history
If the history of the world's main stock indices, in particular the most famous and popular Dow Jones (DJIA), goes back more than 100 years, then the history of the Moscow Exchange index (MICEX) is limited to the last 20 years. The index acts as a benchmark (from the English benchmark - standard, guideline) of the state of the Russian economy. At the time of its creation in 1997, the Moscow Exchange listing included shares of RAO UES of Russia, OAO Mosenergo, OAO Rostelecom, RAO Norilsk Nickel and LUKoil. The first index was calculated for these shares, the base value of which was taken to be 100 points.
Today, the Moscow Exchange index is used in various financial and economic fields of activity. Using it, you can determine the prospects of assets for investment and their profitability, predict the price of shares (as well as bonds) or the exchange rate of the national currency.
I also recommend reading:
Shares of travel companies: risks and prospects
Is it time to pick up travel stocks?
What stocks are included in the index?
IMOEX includes about 40 of the most liquid shares of the largest domestic issuers. The number of securities is a variable quantity. For example, in 2022 there were 39 of them, in 2022 – 45, in 2022 – 44. Blue chip companies, which represent priority sectors for the Russian economy, remain an unchanged part of the index structure. Currently it includes shares of the following companies:
- Gazprom;
- Sberbank;
- NorNickel
- MTS;
- Lukoil;
- Rosneft;
- Surgutneftegaz;
- NLMK;
- Rostelecom;
- VTB;
- Tatneft and others.
The limit on the weight of one issuer is 15%, and on the weight of 5 companies – 55%.
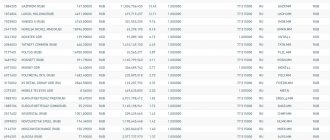
As of Q3 2022, the following assets are included in the calculation:
| № | Name | Code | Tool weight, % |
| 1 | Gazprom | GAZP | 15,93 |
| 2 | Sberbank | SBER | 13,88 |
| 3 | Lukoil | LKOH | 11,05 |
| 4 | Yandex | YNDX | 7,46 |
| 5 | NorNickel | GMKN | 6,49 |
| 6 | Novatek | NVTK | 5,48 |
| 7 | TCS Group | TCSG | 3,86 |
| 8 | Rosneft | ROSN | 3,16 |
| 9 | Polymetal | POLY | 2,54 |
| 10 | Polyus Gold | PLZL | 1,94 |
| 11 | Magnet | MGNT | 1,81 |
| 12 | Tatneft | TATN | 1,71 |
| 13 | ALROSA | ALRS | 1,69 |
| 14 | Severstal | CHMF | 1,61 |
| 15 | NLMK | NLMK | 1,56 |
| 16 | Surgutneftegaz | SNGS | 1,51 |
| 17 | X5 Retail Group | FIVE | 1,39 |
| 18 | MTS | MTSS | 1,39 |
| 19 | Moscow Exchange | MOEX | 1,32 |
| 20 | Sberbank (P) | SBERP | 1,26 |
| 21 | VTB | VTBR | 1,19 |
| 22 | Surgutneftegaz (p) | SNGSP | 1,09 |
| 23 | Mail.ru Group | 0,8 | |
| 24 | Inter RAO | IRAO | 0,79 |
| 25 | GC PIK | PIKK | 0,78 |
| 26 | MMK | MAGN | 0,76 |
| 27 | PhosAgro | PHOR | 0,76 |
| 28 | OZON | OZON | 0,74 |
| 29 | Rusal | RUAL | 0,67 |
| 30 | Fix Price | FIXP | 0,62 |
| 31 | HeadHunter | HHRU | 0,48 |
| 32 | AFK System | AFKS | 0,47 |
| 33 | RusHydro | HYDR | 0,46 |
| 34 | Rostelecom | RTKM | 0,46 |
| 35 | Transneft | TRNFP | 0,46 |
| 36 | Child's world | DSKY | 0,38 |
| 37 | Aeroflot | AFLT | 0,35 |
| 38 | Tatneft (p) | TATNP | 0,34 |
| 39 | GLOBALTRANS | GLTR | 0,32 |
| 40 | Petropavlovsk PLC | POGR | 0,27 |
| 41 | FGC UES | FEES | 0,23 |
| 42 | ICD | CBOM | 0,21 |
| 43 | LSR | LSRG | 0,17 |
| 44 | Rosseti | RSTI | 0,15 |
Blue Chip Index
From the table in the example above, a pool of shares with good liquidity is selected. In the future, they can be filtered using the blue chip index; its basket includes the largest companies on the Russian market. in the “ Calculation Base ” tab in the corresponding section on the MICEX website. If a company passes liquidity filter and is simultaneously included in the MOEX Blue Chips basket , it can be dealt with intraday.
Blue chip quotes are more suitable for making money. illogical on the chart ; they lend themselves better to technical analysis.
Charts of low-liquid assets are more difficult to analyze. For them, the norm is calm for several days or weeks, and then the appearance of a candle with a range 20-50 times larger than its neighbors. This is how the traces of large players appear: due to weak supply and demand, with a large volume of buying or selling, all liquidity is taken out and a large candle appears. It is impossible to predict the emergence of such a movement .
How is it calculated?
To calculate IMOEX, it is necessary to calculate the ratio of the market capitalization of shares that are included in the calculation base to the total market capitalization of the same securities at the initial moment of calculation. The resulting value must be multiplied by the IMOEX value on the starting date.
This indicator is calculated online in ruble equivalent.
In 2022, the Central Bank of the Russian Federation revised the IMOEX calculation methodology and issued a new regulation. As a result, the requirements for the level of liquidity of shares that are part of the indicator were increased. This made it possible to move to a floating number of securities. These innovations were established in order to increase investor interest in stock indices. But, more importantly, it will contribute to a more complete reflection of the market situation.
MICEX calculation method
The Moscow Exchange index reflects the relative level of capitalization of its member organizations. The chart of this financial instrument demonstrates its dynamics in value terms. If the indicator grows, this indicates the rise of the Russian stock market and the growth of its capitalization. The drop in the parameter reflects a decline in stock exchange prices and the predominance of bearish sentiment.
The index is calculated by the Moscow Exchange during trading (from 10.00 to 18.50). The frequency of calculations is 1 second. Mathematically, the indicator is the ratio of the market capitalization of the current trading session to the capitalization of the previous one, multiplied by the previous index value.
To calculate the current capitalization of each company, the latest share price is multiplied by the security weight, the share issue size and the free-float factor (determines what percentage of the securities are in free float). To determine the total market capitalization, the indicators for all shares included in the list are summed up.
In November 2022, the Bank of Russia increased the requirements for securities for their inclusion in the Moscow Exchange index line. Such changes are designed to increase the interest of Russian and foreign investors in the Russian stock market and more objectively reflect the situation on the stock exchange floor.
Under the new rules, to be added to the index, stocks must meet the following requirements:
- The share of securities in free circulation is at least 10%. If the indicator falls below 5%, the issuer is excluded from the calculation base.
- Liquidity ratio (calculated by the exchange) - no less than 15%. If the parameter value is below 10%, the paper is excluded from the calculation base.
- The share weight should not be less than 0.25%. The exclusion criterion is a drop below 0.2%.
There are a number of restrictions for issuers of securities:
- the weight of 1 share should not exceed 15%;
- the maximum permissible share of all securities of one issuer is 30%;
- the weight of any 5 issuers should not exceed 60% (otherwise the parameters are recalculated using a correction factor).
Differences from the RTS index
Both indicators - those of the Moscow Exchange and the RTS - are composite indices of the domestic stock market, which are weighted by market capitalization. Both indicators include the most liquid securities.
At the same time, IMOEX is still the main indicator of the domestic stock market.
Since 2012, both indicators are calculated using the same formula. They include the same companies with the same weight. The main difference is that the RTS index shows market changes in dollars, while the IMOEX shows market changes in domestic currency.
MICEX Index 10
This is a composite price equal-weighted stock index of the 10 most liquid shares on the Moscow Exchange. This indicator is calculated as the arithmetic average of stock exchange quotations of securities.
The parameter is recalculated after each price change. The list of shares is revised quarterly depending on the liquidity of the securities.
The index includes the following stocks:
- Lukoil, Jsc;
- MMC Norilsk Nickel, JSC;
- Gazprom, JSC;
- Bank VTB, JSC;
- Sberbank of Russia, JSC;
- Sberbank of Russia, ap;
- Rosneft, Jsc;
- Surgutneftegaz, ap.;
- Alrosa, Jsc;
- MosBirzha, Jsc.
Profitability over the last 10 years
If we consider the statistics by year, over a 10-year period IMOEX shows progressive dynamics. This can be seen in the graph below.
Thus, on August 1, 2011, the opening price of IMOEX was 1,705.22 rubles, and on August 1, 2022 - 3,789.33 rubles. Why the index fell in 2022 becomes clear if you analyze the global economy as a whole. This year, the coronavirus pandemic was in full swing, which caused the percentage decline in quotations.
Index dynamics and profitability
The growth of the index also means the overall growth of shares and an increase in their investment attractiveness. The fall, accordingly, shows a decrease in the rating of the companies included in the index. During its existence, the dynamics of the index as a whole have changed in a positive direction, but there are also moments of significant decline on its chart.
I also recommend reading:
What does the P/B multiple say about the company's value?
P/B multiple is another way to look for undervalued companies
As can be seen from the graph, the index reached its historical maximum at the beginning of 2022 and amounted to 3079 points. The global economic crisis also affected the financial condition of Russian companies, which caused the index to drop to 513 points. It is true that it is necessary to take into account the fact that a serious devaluation of the ruble took place throughout the year, which may have kept the index from falling even further.
The most significant indicator for investment planning is real profitability, calculated taking into account annual inflation. To do this, subtract the inflation rate from the nominal annual yield.
The index's return is not a stable value and fully reflects the economic situation of recent years. But the average annual rate of return, which is important for long-term investing, was 31%.
conclusions
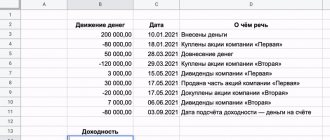
The Moscow Exchange Index can occupy a worthy place in investment portfolios. But the question remains about how to invest in the index. To explain the complexity of the problem, it is enough to provide statistics on the profitability of the index mutual fund Otkritie Management Company, which has been tracking the Moscow Exchange index since 2007.
| OPENING OF MICEX | MCFTR | Difference | |
| 1 year | 17,74% | 19,01% | -1,28% |
| 5 years | 13,42% | 15,55% | -2,13% |
| 9 years | 5,36% | 11,99% | -6,62% |
The difference in results is too big. It is especially noticeable over long periods. And this is for one of the most progressive index mutual funds with the lowest commission (about 1% per year for management). From this example, it becomes obvious how important factors are the accuracy of management and commissions of management companies involved in index funds.
We can only hope that the new exchange-traded fund of Sberbank Management Company will demonstrate better results than most of its competitors.
Tags: Index Moscow Exchange Index Moscow Exchange Moscow Exchange Dividends Opening S&P500
Related materials:
— Dividend yield of the Moscow Exchange Index (MICEX) in 2022
— Dividend yield of the MICEX Index
— Deposit Index (OKID): inflation and profitability
— Review of MICEX index funds 2016
— MICEX Index — new calculation methodology
Comments ()
- Aidar September 28, 2022, 1:20 pm 0
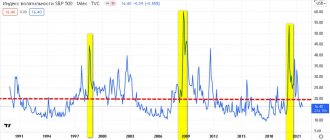
Why is the “S&P 500 TR Index” curve so flat in 2014 on the “MICEX Index TR vs S&P 500 TR” chart? After all, the ruble has depreciated by half, and the S&P 500 index consists of foreign currency assets.answer
- Sergey September 29, 2022, 08:34 0
Aidar, thank you for your attentiveness. There was a mistake on my part. Incorrectly multiplied columns in EXCEL. I recalculated the return on the S&P 500 TR.
answer
Sergey, do I understand correctly that due to the peculiarities of taxation, it is correct to compare mutual funds with the total gross return index - MCF RR (before taxes), since the management company acts as a tax agent and it does not pay taxes until the client redeems the share?
answer
Sergey October 07, 2022, 07:49 0
Yes, that's absolutely right...
answer
Thank you for your reply. As a rule, the prospectuses of management companies indicate the Moscow Exchange index without dividends as a benchmark. It is likely that the delta of their mutual fund or remote control strategy will be larger and the management result will look more solid. This means that the client needs to independently compare the TR with MCF and draw a conclusion. Over long time windows, the result may change significantly. And with what is it more correct to compare your portfolio made up of Moscow Exchange shares (8-10 securities) if a person is a resident of the Russian Federation? There are 3 indices - the Moscow Exchange index without dividends, MCF TR (gross) - the Moscow Exchange index with dividends before taxes and MCF RR (net) - the Moscow Exchange index with dividends after taxes. I believe that it is most correct with MCF RR (net), because will dividends with already withheld personal income tax be transferred to the person’s account?
answer
- Sergey October 08, 2022, 19:01 0
Oleg, and again you are right. As a tax resident you will be closer to the MCFRR. I really haven't seen a comparison of MCFTR and MCFRR graphs. Something tells me that the numbers there are not much different...
answer
Stanislav 06 September 2022, 12:08 0
Comparison
answer
Sergey, good afternoon! Continuing the topic. If you compare index returns from the beginning of the year, you get the following results, right? MCF TR MCF RR IMOEX dates 12/29/2017 3144.34 3015.71 2109.74 10/16/2018 3799.11 3618.68 2417.26%, from the beginning of the year 20.82% 19.99% 14.58%
That is, MCF RR is already ahead of IMOEX by 5.42% in less than a year.
answer
Sergey, good afternoon! Tell me, please, a resource where I can see statistics on the dividend yield of the Moscow Exchange index as a whole?
answer
- Sergey August 23, 2022, 1:19 pm 0
Oleg, the statistics are in our article: Dividend yield of the Moscow Exchange Index (MICEX) If you need the current dividend yield of the Moscow Exchange Index, then it is on
answer
Please explain, if your total return on the Moscow Exchange over an average of 15 years is 0.94 percent lower than the same return on the American sp500 index, then why is the accumulated return on the MICEX over the same time higher than sp500???
answer
- Sergey July 05, 2022, 08:16 0
Everything is very simple. MCFTR data has been available since February 2003. Calculated data on accumulated returns and information on the graph are displayed for 15 years and 11 months, i.e. for almost 16 years. The tables that provide data on average annual returns contain only figures for exact periods of time: 1, 5, 10, 15 years. Therefore, over the full 15 years the situation looks somewhat different than over 15 years and 11 months.
answer
Well, if over the course of 15 years the S&P 500 TR on average per year was ahead of the MCFTR by 0.94% and, accordingly, its accumulated profitability during this time should be significantly higher than that of the MICEX, then over the past 11 months it has lost this significant advantage and is also lagging behind by 967-913=54%!!! Don't you think this is incredible???
answer
- Sergey 06 July 2022, 14:44 0
I agree, it's interesting. Unfortunately, I could not find the original calculations. Back then I still calculated everything in EXCEL. I'll try to restore and check. Maybe some kind of bug 
answer
Sergey July 07, 2022, 07:30 (The comment has been changed) 0
There is an error in calculating the average annual return. The accumulated amount was calculated correctly. Correct values for the average annual return for 15 years: MCFTR - 14.64% S&P500 - 14.83% For 15 years 11 months: MCFTR - 16.45% S&P500 - 15.41%
answer
If an investor does not take dividends into account as the value of shares, then he can play slot machines...
answer
- Sergey January 03, 2022, 08:30 0
It’s not entirely clear why this is...
answer
Results
excellent earning options on the Russian market We can identify at least 10-15 companies that are capable of generating an income of about 10-20% per annum due to rising share prices. Bonus – dividends ; they can be reinvested and receive a cumulative effect over a distance.
Don't be confused by the abundance of companies trading on the MICEX. Using Moscow Exchange indices and a quick analysis of their financial indicators, you can quickly select promising stocks . Afterwards, only technical issues remain - registering an account, installing software and directly concluding transactions.
I will definitely answer your questions in the comments. If anything remains unclear, write about it in the comments. I also recommend subscribing to my blog updates in telegram . This is convenient: after a new material is released, you will receive a notification and are guaranteed not to miss it.
This is where I say goodbye to you and wish you success in investing and financial stability in these difficult times.
If you find an error in the text, please select a piece of text and press Ctrl+Enter. Thanks for helping my blog get better!
Profitability statistics
| average annual return | Average inflation | real yield | |
| 1 year | 20,99% | 3,42% | 16,99% |
| 5 years | 15,92% | 7,21% | 8,12% |
| 10 years | 19,34% | 7,35% | 11,17% |
| 15 years | 14,64% | 8,72% | 5,45% |
It is easy to notice that at all periods of time the MICEX index showed quite good profitability and was ahead of inflation. The accumulated return since February 2003 (a little over 15 years) was 967%.
Let's compare with the ruble return on investment in a similar total return index of American shares S&P 500 TR.
| MCFTR | SP 500 TR | |
| 1 year | 20,99% | 21,40% |
| 5 years | 15,92% | 27,74% |
| 10 years | 19,34% | 24,85% |
| 15 years | 14,64% | 14,83% |
Over most time periods, the S&P 500 TR has outperformed. What is important, over a maximum 15-year period, Russian stocks showed a return of only 0.19% per annum, inferior to the American index recalculated in rubles. Moreover, in the period of time before the devaluation of 2014-2015. The Moscow Exchange index was the leader in terms of profitability.
Since February 2003 (beginning of calculations), over 15 years and 11 months, the Moscow Exchange Total Return Index has generated 967% income. The S&P 500 index has a total return of 913% (of which 116% is due to the growth of the dollar).