What is the S&P 500
The definition of the S&P 500 (pronounced “esandpi 500” in Russian) will not be fundamentally different from any other definition of a stock index. Differences in composition and calculation principle.
In simple terms, the S&P 500 index is a basket that contains shares of the 500 largest US companies that are traded on American exchanges and cover almost all sectors of the economy.
Securities are included in it if certain criteria are met. The requirements are set by the company that calculates the index - Standard & Poor's (hence the abbreviation S&P in the name).
Any stock index is needed to determine the investor’s mood, to understand whether the stock market is rising or falling. The S&P 500 is often compared to another well-known and older index - the Dow Jones (also called the industrial index). But the second includes only 30 US companies, the so-called “blue chips”, which do not represent all sectors of the economy. The S&P 500 has broader coverage. Agree, 30 and 500 are a big difference.
There is one more difference from Dow Jones, but we will discuss it in the section on the calculation methodology.
Features of the trading instrument
The main feature of the S&P500 indicator is that it has become the basis for determining investor sentiment, predicting future economic crises and moments of “safe” entry into the market. We are talking about the famous VIX volatility index and the cost of options on stock indicator futures traded on the CBOE platform.
The price of any option contract can be calculated in advance using the Black-Scholes formula, which won the Nobel Prize in economics. Professor Menahem Brener in 1989 proposed, based on these data and real option values, to calculate the expected (future) market volatility.
Later, the CBOE exchange mathematically implemented this idea by releasing the VIX index. The meaning of this indicator can be seen with the naked eye, even without special knowledge in technical analysis of the stock market. Surges in the VIX were pre-empted or coincided with moments of the dot-com bust, the subprime crash, and the Covid fallout.
It is believed that a value above 40 points is a “fear zone” for investors, warning that a crisis is imminent. In this case, to resume asset purchases, you should wait for a fall into the “greed zone” below 20 points.
The VIX index can be found on TradingView.
Stages of development
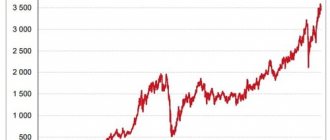
Standard & Poor's first introduced the S&P 500 to the world in 1957. Over the past 50 years, it has grown from 89.5 to 3,335.47 points (as of September 30, 2020). But the history of development began long before 1957:
- 1923 – An index of 233 stocks representing 26 industries was created. It was difficult to track changes on a daily basis.
- 1926 - The Standard Statistics index appeared, which included 90 securities: 50 industrial, 20 railroad and 20 utility companies. For the first time, its values began to be updated daily.
- 1941 – Standard & Poor's creates an index based on 416 stocks from 72 industries. But the S&P 90 also remained, although it consisted of 100 items.
- 1957 - The S&P 500 combined the two previous indices and began to exist in the form we know. This unification became possible thanks to the development of computer technology and automation of the calculation process. The structure was as follows: 425 industrial, 60 municipal and 15 railway enterprises.
- 1976 – the structure changed: 400 industrial, 40 utility, 40 financial and 20 transport enterprises. For the first time, securities of financial companies were included in the list.
Anywhere in the world you can monitor changes in the S&P 500 online on an interactive chart. Hundreds of websites publish its dynamics. By ups and downs, you can track the dates of global financial crises and periods of economic recovery. Over the past 50 years, the graph looks like this:
Composition of the S&P 500 and calculation methodology
The S&P 500 is not a static indicator; it changes with the economy. Some companies appear in it, others leave, and the percentage of industries also becomes different. If you look at the list of companies, for example, in 2005 and in 2020, you will see a huge difference: 163 companies underwent acquisition, merger or division, 16 went bankrupt.
Complete information about current strategies that have already brought millions of passive income to investors
The composition is reviewed quarterly. Today the list consists of 505 stocks from 500 issuers (some companies issue different classes of shares). The most famous: Apple, Microsoft, Amazon, Facebook, Alphabet (Google), Visa, Johnson & Johnson.
Criteria for including securities in the S&P 500 calculation:
- market capitalization over US$6 billion;
- high liquidity – more than 250,000 shares per month over the last six months;
- listing on the NYSE or Nasdaq exchanges;
- the share of shares in free circulation is at least 50%.
More than 100 cool lessons, tests and exercises for brain development
Start developing
Now let's return to the main competitor of the S&P 500 - the Dow Jones Industrial Average. The difference between them is not only in composition, but also in the calculation method:
- The Dow Jones is price-weighted, meaning the more expensive a stock is, the greater its impact on the index.
- The S&P 500 is market capitalization weighted, meaning the larger the company, the larger the share it receives. In this case, only securities in free circulation are taken into account in the calculation (the term free-float is used). The final value depends on the price of shares and their number in circulation.
Let's look at an example. ABC Company issued 5 million shares at a price of $5. Market capitalization was $25 million. DEF issued 10 million shares at a price of $1. Its capitalization is $10 million. Let's say that the total market capitalization of all companies included in the S&P 500 is $500 million. Then the shares of our issuers will be:
ABC = 25,000,000 / 500,000,000 * 100% = 5%
DEF = 10,000,000 / 500,000,000 * 100% = 2%
How to invest in an index
The S&P 500 is a numerical analytical indicator, not a trading tool. It cannot be bought on the stock market. But investors still have the opportunity to invest in the index and make money from it. Let's consider the available options for Russians.
ETFs and mutual funds
Direct access to US exchanges where index funds following the S&P 500 are traded is available either to a qualified investor or through an overseas broker. If these options do not suit you, then only the Moscow Exchange and the ETFs and BPIFs traded on it remain.
On the Moscow Exchange you can buy index funds that include shares of American companies from the S&P 500:
- FinEx's FXUS follows Solactive rather than the S&P 500, but they are very similar. The fund covers 85% of the US stock market and includes 507 stocks. Commission – 0.9%. Quote as of September 30, 2020 – RUB 4,771. Profitability for 5 years in rubles – 118.22%, in dollars – 81.39%.
- BPIF “Sberbank – S&P 500”. The maximum commission is 1%. Quote as of September 30, 2020 – RUB 1,381.6.
- BPIF “Alfa – Capital S&P 500”. The management company's remuneration is no more than 1.4%. Invests through the purchase of shares of a foreign ETF. Quote as of September 30, 2020 – $11.54.
- BPIF “VTB – American Companies Share Fund”. Invests through the purchase of shares of a foreign ETF. The management commission is 0.9%. Quote as of September 30, 2020 – 902.8 rubles.
All of the funds listed can be purchased on an IIS and take advantage of tax benefits: or return up to 52,000 rubles. in the form of a refund of previously paid personal income tax, or be exempt from tax on profits received from transactions with securities.
Mutual funds
If you don’t have a brokerage account, you can buy shares of one of the mutual funds, which includes securities of American companies.
For example, “Global Shares Fund” from Sber Asset Management. Invests in the SPDR S&P 500 ETF TRUST investment fund, ordinary and preferred shares of American companies and depositary receipts.
One share costs 2,558.73 rubles. (as of September 28, 2020). Commissions charged:
- for management – 1% per year;
- when purchasing and redeeming a share (the amount depends on the amount and location of the transaction);
- others - no more than 0.65% per year.
When choosing between an ETF and a mutual fund, I prefer the first. Firstly, there are no problems with opening a brokerage account, everything is done online in 5 minutes. Secondly, the commissions are much lower. Thirdly, your profitability does not depend on the competence of the manager, the ETF simply follows the S&P 500 and repeats its changes.
Independent index formation
When we talked to you about the RTS index, which includes only 38 shares, we considered the issue of independently purchasing securities from the list. Even so, the process requires significant capital and time to constantly monitor quotes and rebalance the portfolio. Imagine how this will happen when there are not 38 shares, but 505.
The advantages of buying shares yourself are receiving dividends (in the funds they are immediately reinvested by the management company) and the absence of management fees. But you can easily cover all the advantages with your time spent and brokerage commissions on the purchase and sale of assets during rebalancing. I think this investment option is difficult and impractical.
Volatility
Intraday trading also has its own characteristics that are different from the Forex market. This is due to the work schedule of American exchanges, which are open from 9:30 to 16:30 EST (+7 Moscow time), but S&P500 futures are traded throughout the day.
According to Moscow time, the US stock exchange is open in the summer from 16:30 to 23:00, in the winter - from 17:30 to 00:00 Moscow time.
Despite the 24-hour schedule of derivatives transactions, until 16-30 Moscow time, trading occurs at reduced volatility, which is associated with a sharp increase in the collateral for futures contracts. Leverage drops sharply during the main trades, plus at that time US statistics are often released.
The standard picture of volatility distribution is shown in the picture below. The intensity of transactions increases throughout the day until the end of the session at 23-00 Moscow time.
The departure of European traders from the market at 18-00 causes a dip in volatility after the opening of trading. The correction formed by this outflow of liquidity becomes the reason for a wave of new transactions, whose pressure leads to renewed volatility maximums around 22:00.
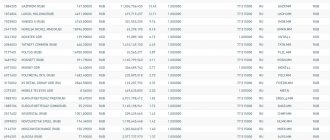
Our online Volatility Indicator confirms the above:
As for the days of the week, Friday stands out for its reduced volatility.