Anyone who has ever dealt with trading in financial markets knows what a moving average is. This classic technical indicator is so widespread that it is found in almost every trading system. Even if a strategy doesn't use moving averages directly, you'll likely find other indicators that use moving averages in their calculations. Today we will talk about the direct use of moving averages in trading systems, conduct tests of the most common strategies on the “machine”, and draw a conclusion - is it worth looking towards this indicator in today's markets or looking for the grail elsewhere)
You can get acquainted with the indicator itself in this article. It will introduce you to the main options for its calculation and the basics of application in practice. Also in this article you can get acquainted with all the variety of types of moving averages that appeared with the development of technology and, in particular, with the advent of home computers.
Basically, moving averages are used to reduce unwanted noise in a time series so that the market behavior underlying the pricing process becomes more understandable and visible, more clearly expressed. They provide data smoothing. As a smoothing method, moving average is a specific low-pass filter, allowing low-frequency activity to pass through and suppressing high-frequency activity. On a price chart, high-frequency processes look like fast vertical fluctuations, that is, like noise, and low-frequency processes look like smoother trends or waves.
In addition to their ability to reduce noise in time series, moving averages have the advantages of simplicity, clarity, and functionality. However, like any powerful method of filtering or smoothing real-time data, they have the disadvantage of latency. Although smoothed data is cleaner and therefore more suitable for analysis, there is a lag between the data in the original series and the smoothed data sequence. This lag can be a serious problem when you need to react quickly to events, as is often important for traders.
In some cases, lag is not a problem, for example, in systems where the price line crosses the moving average - in fact, the price must overtake the average for such a system to work. Lag is more problematic in models that use the turning points of a moving average chart or its slope to make decisions. In such cases, lag means delayed response, which is likely to result in unprofitable trades.
All moving averages smooth out time series using some kind of averaging process. The only differences are in what specific weight is assigned to each of the summation points and how well the formula adapts to changing conditions. The differences between types of moving averages are explained by different approaches to the problem of reducing lag and increasing sensitivity.
Types of trading systems based on moving averages
Moving average trading system models generate buy or sell signals based on the relationship between a moving average and price, or between two (or more) moving averages. There are trend-following and counter-trend models.
The most popular models follow the trend and lag behind the market. On the other hand, counter-trend patterns predict reversals. This does not mean that market-following models perform worse than counter-trend ones. Reliable entries into a trend, even with a delay, are considered more reliable and profitable than attempts to predict reversals, which only occasionally occur at the expected moment - there is usually only one global extreme, while there will be many local ones.
Trend-following methods for generating trading signals based on moving averages can be done in a variety of ways. One of the simplest models is based on moving average crossovers—a trader buys when prices rise above the moving average and sells when prices fall below it.
Instead of waiting for the intersection of the average line and prices, you can use the fast average and its intersection with the slower one. A buy signal occurs when the fast average rises above the slow one, a sell signal occurs when the fast average falls below the slow one. Smoothing the original data series through the use of moving averages reduces the number of false crossovers and therefore reduces the frequency of losing signals.
Another way to use moving averages is to use the intersection of a moving average and a forward-shifted moving average with the same parameters. In this case, a buy signal occurs when the fast original average rises above the offset one, a sell signal occurs when the original average falls below the offset one. By choosing the magnitude of the shifts, you can reduce the number of false crossings, reducing the frequency of unprofitable signals. Sometimes several shifted moving averages with different shifts and different periods are used simultaneously, as, for example, in the B. Williams alligator or in the Ichimoku indicator.
Moving averages can also be used to provide entry signals in counter-trend systems. Prices often react to a moving average in much the same way as they do to support and resistance levels, which is the basis of the entry rule, which is to buy when prices fall to or cross below the moving average, and sell when they rise to or cross below it. -up. It is assumed that prices bounce off the moving average level, changing the direction of movement.
Moving Average: indicator features
At each point, the MA value is the average price indicator for a certain time period. Sometimes this is an arithmetic average, sometimes more complex formulas are used. The period is the main parameter of the indicator; it determines how many time stamps will be taken into account when determining the moving average parameter.
There are 4 main types of MA:
- Simple – Its values are a simple arithmetic average of price changes.
- Exponential - In this case, the last values have predominant weight. The weight is calculated as an arithmetic progression.
- Linear Weighted – Recent values have higher priority, but the weight is calculated geometrically.
- Smoothed – The latest values have higher priority, while price values outside the period are also taken into account (their influence is negligible).
What are we testing today?
So, I plan to test several classic approaches to using moving averages in trading systems:
- price crossing the moving average;
- intersection of two moving averages;
- using moving average crossovers with a shift (Alligator and Ichimoku);
- intersection of price and shifted moving average;
- working with several moving averages (three, four).
In addition to experimenting with the systems themselves, we will also discuss various filters and techniques that are designed to improve the performance of systems. And, in addition to this information, I selected more than a dozen modern TS based on moving averages, which I found on various sites and forums on the network and would like to check as part of this article.
So, today we are faced with several questions to which we will try to find an answer:
- Is it worth trying to create trading systems based on moving averages or is this tool hopelessly outdated?
- what are the best ways to generate trading signals based on moving averages?
- What methods of filtering generated signals can be applied and in what cases?
- Is it worth paying attention to modern trading systems that are based on moving averages?
- What types of moving averages are most effective and in what cases?
As you can see, many questions have been raised and a very extensive study awaits us. However, I believe that the answers to them are of interest to many traders and will be useful for both new and experienced traders. It is worth considering that this study is being conducted for the Forex market - for commodity markets, commodity markets, and stock markets, the answers to them may differ radically.
And, in order not to stretch this already quite extensive study, I chose only a few currency pairs for research, trying to select them in such a way that the nature of their behavior was as different from each other as possible. Moreover, these pairs must be from the group of the most popular. I chose GBPUSD, EURUSD, USDJPY, USDCAD and AUDUSD. I did not include USDCHF as it is correlated with EURUSD and NZDUSD due to correlation with the Aussie. Thus, in our portfolio of currency pairs you can find traditionally trending and flat pairs, with relatively high and low volatility, with sharp and smooth movements within the day.
Add Moving Average to Meta Trader 4
Adding this indicator to the chart of the Meta Trader 4 trading platform is quite simple. This can be done by selecting the commands “Indicators” - “Trend” - “Moving Average” in the “Insert” tab of the top menu, or similarly through the corresponding icon on the toolbar.
To configure the indicator, you need to right-click on the indicator and select “Properties”
In the next window there are indicator settings, where you can select:
- Period
- Shift
- MA method (MA type, for example Simple, Smoothed)
- Apply to (calculate indicator based on closing price\opening price, etc.)
- MA style is also selected (color, thickness)
You can also select display on certain timeframes in the properties. For example, within the framework of a trading strategy, only 14 MA is needed on the H4 and H1 chart, then you need to specify the corresponding data in the settings:
The vast majority of strategies use a simple moving average. As a rule, it is set by default, unless otherwise stated in the terms of the trading system. Let's take a closer look at the types of MA and examples of strategies.
The intersection of price and moving average
The simplest moving average trading strategy is based on the intersection of price and a moving average. This trading system is based on a simple trading idea: the moving average in a trending market lags behind the price (due to the very principle of calculating the moving average). Therefore, it is believed that if the price is greater than its moving average, then the trend is upward, and if the price is less than the moving average, then the trend is downward. Accordingly, if the price crosses its moving average, then we can assume that the direction of the trend has changed.
The use of this simple principle forms the basis of the simplest trading system based on a moving average. Visually, looking at the chart, we can assume that this approach to trading has the potential to bring us profit. Theoretically, we can make huge profits from each trade, taking profit from most of the trend movements. There is only one question left - will false signals, of which there can be a huge number in flat areas, take away all this profit? Let's check this by testing.
The trading system will generate entry signals when a daily bar opens on one side of the moving average and closes on the opposite side. The output signal will be generated together with the opposite input signal. This type of system is called reverse - transactions will be opened constantly, when a new signal is received, the current transaction will be closed and a new one will be opened in the opposite direction.
No position controls such as trailing stops will be used. Take profit and stop loss orders will also not be used. When executed automatically, such a system is dangerous - if the server on which the system is installed crashes, you can suffer unlimited losses. Therefore, setting limiting orders (at least stop loss) during real trading is mandatory. Well, for testing we can neglect this rule.
In our basic trading system, there is only one optimized parameter - the moving average period. Here are the results of one of the optimizations:
Such a result, when most of the passes show a profit, indicates that the system is quite stable and the results are not random. The strategy is indeed profitable for most values of the optimization parameter, the model is efficient, and the profit is not the result of a random combination of circumstances.
Of course, the number of transactions decreases as the period of the moving average increases, but even with a high period (from 200 and above) it remains large enough (150-200 transactions) to trust the test results. Now let's take a closer look at the optimal results:
This strategy works best on the GBPUSD and AUDUSD currency pairs, regardless of the type of moving average used. The smoothed and exponential option works better on the USDCAD pair, while the simple one works better on EURUSD. The USDJPY pair showed low efficiency of this strategy, however, exponential and smoothed moving averages work better.
Summary statistics for the simple moving average:
Now let's try to select suitable filters, for which we will use only a simple moving average. The most frequently mentioned filters in the literature are the following:
– entry after 1-3 candles, if the signal has not disappeared:
In all cases, this filter significantly reduced the number of false signals and increased the final profit of the system;
– entry after breaking through the average and the price passing a certain distance, depending on the current volatility (based on ATR). This distance should appear between the price and the moving average within a certain time, not exceeding the one specified in the settings:
This filter turned out to be less effective than the previous one, and it also filters out too many transactions;
– entry after breaking through the moving average built at High/Low prices:
This filter showed even less efficiency than the previous one.
Some input filters actually improve system performance, and combinations of them can also produce more optimal results. However, the system is a classic trend-based trading system, in which the number of profitable trades is much less than 50%, and the size of a profitable trade exceeds the size of a losing one by five or more times. It is very difficult to trade with such a system psychologically and for private traders who are accustomed to more comfortable trading, such a system is not suitable. A typical balance chart has the shape of a “ladder”:
Long periods of drawdowns combined with a small number of transactions will cause very noticeable discomfort when trading. However, trends will always exist in the market, and, as history shows, they appear quite regularly. This means that such a system will work and earn money for as long as desired, never losing its relevance. Another thing is that not every trader can withstand a drawdown that lasts, say, a decade.
And finally, in the picture above you see the general statistics of the trading system using the most successful entry filter. As you can see, it is far from perfect. In fact, the account was in drawdown from 2011 to 2015, which not every currency speculator can withstand.
50 day moving average: trading strategy
As we already know, there is no best moving average. However, in a normal trend, the 50 day moving average is one of the best indicators.
How to use the 50 day moving average to find trading opportunities?
Most traders are familiar with the strategy of entering the market at support and resistance levels. This strategy works successfully when the market is in a range or weak trend.
But what if the market is in a similar trend?
As you can see, the market does not test the support level for a long time, and you may remain out of the market for a long time, looking for the right trading opportunity. What to do? This is where the 50 day moving average comes into play.
Let's look at the same chart again, but this time with a 50-day moving average overlaid on it:
Do you see the difference? Once price retests the 50 day moving average, you can use price action patterns to find an entry point into the market.
How to sit out long-term trends using the 50 MA?
When it comes to trend trading, many traders take profits at the slightest pullback. At the same time, they tighten their trailing stop too much!
It's like chasing a girl. If you get too close to her, she will run away. But if you give her freedom, you will have a better chance of winning her.
Therefore, you must learn to let the price breathe. One approach for this is to use the 50-day moving average to move your stop loss.
This means that you should hold your position as long as the price remains above the 50 day moving average. And exit the market only when it closes below it (and vice versa for a short position).
How to use the 50 day moving average for reversal trading?
When you are trading a trend reversal, the timing of your entry is critical. If you enter the market too early, you risk being stopped out. If you are late, you miss the opportunity to catch a big price move.
How can you accurately find the time to enter the market not too early or too late? You can use the 50-day moving average, which can act as a trend filter.
If you want to go short against an uptrend, wait for the price to close below the 50-day moving average (and vice versa for a long position).
But what if the price does not close below the 50-day moving average, can I go short? No! You must stay out of the market. Let the 50-day moving average act as a trend filter and tell you when it is safest to go short.
To increase the profitability of your trades, make sure the price is based on the higher time frame market structure. For example, if you are looking to short, check that the price is at a resistance level on a higher time frame.
How to enter the market on time?
Do you enter your trades too late, only to realize later that you bought at the highs? At the same time, your stop loss is knocked out on the first pullback? The market continues to grow, but without you? Why is this happening? The reason is that you may be entering the market too far from a significant area. Therefore, learn to look for entry points near a significant area.
For example, in a healthy trend, the significant area is near the 50 day moving average.
But here you should not open trades:
In a strong trend, the significant area is near the 20 day moving average.
50 day moving average and finding the best entry points
There are two techniques you can use:
- Reversal price action patterns.
- Breakout of the trend line.
We know that the moving average acts as a significant area in a healthy trend. What to do when price retests the 50-day moving average? Here we can look for price action reversal patterns such as pin bar, engulfing pattern.
When price pulls back to the 50-day moving average, you can draw a mini trend line to help you find your entry point.
Trading strategy for 50 MA
The idea behind this trading strategy is to profit from one large wave in a healthy trend. Here's how it works:
- Find a healthy trend where price matches the 50 day moving average.
- Wait for price to retest the 50 day moving average.
- Look for an entry trigger (for example, a price action pattern on a breakout of a trend line).
- Enter the market only at the opening of the next candle.
- Set your stop loss below 1 ATR of the previous low.
- If the price moves in your favor, exit at the nearest reversal.
Here are some examples:
Crossover of two moving averages
In the previous example, we used the simplest principle of using a trading system based on a moving average, taken in its pure form and with some filters for input signals. Yes, in principle it works, like most indicator methods of technical analysis, but the problems, as always, lie in the details and nuances. And one of the nuances of the considered example is the fact that this kind of strategy does not work well in markets where there is no clear trend. They open many counter trades on “noisy” price movements, while losing profits accumulated in trending areas of the market.
This drawback can be partially eliminated by using the intersection of two moving averages, one of which, faster with a shorter period, is a smoothed equivalent of the price chart, and the second, slower, is used to determine the direction of the trend. By choosing the ratio between MA periods, you can reduce the number of “false” alarms of the system due to noise components of price movement, as well as reduce the number of transactions in market areas with a sideways trend.
The trading idea for this case is also very simple: if the fast moving average is located above the slow MA, then the trend is upward, and if below, the trend is downward. Accordingly, the intersection points of the fast and slow MAs are considered to be points of change in trend direction and are used as trading signals for the system:
Now let's look at the results:
As in the previous system, the GBPUSD pair shows the best results. EURUSD also performed well. The remaining currency pairs showed approximately the same results, significantly better than when the price crossed the MA.
In general, most of the optimization results are above zero profitability, which indicates satisfactory stability of the trading system. The most profitable results for the GBPUSD pair, for example, are obtained by using a fast moving average with a period of 50 to 100 and a slow moving average with a period of 110 to 180.
Many negative values during optimization correspond to sets of parameters where the period of the fast moving average turned out to be higher than the period of the slow one, that is, the rules of the system were inverse. In fact, with the right set of settings, there will be significantly fewer unsuccessful passes.
Modifying the system rules will help to avoid such a situation. Instead of directly setting the period of the fast moving average, we will set a certain coefficient ranging from 0.01 to 0.99. Then MA_fast_period = MA_coeff * MA_slow_period.
Thus, the period of the fast moving average will never exceed the period of the slow one.
We got a very similar picture of the distribution of results, but this time there were much fewer unsuccessful passes. A total of 1,715 results were received, about 30% negative.
This trading system involves more comfortable trading; drawdown periods are shorter here. The average profitable trade generally exceeds the average losing one by two to three times, and the number of profitable trades remains in the region of 40-60%, depending on the currency pair. Such statistics are already more acceptable for a retail trader:
At the same time, if you assemble a portfolio of at least the currency pairs I tested, the characteristics of such a system may turn out to be quite interesting from the point of view of long-term investing:
Of course, the drawdown periods are still quite long, but, in general, the results of the system look much better than in the previous case. However, here too we observe a very long period of drawdown from 2012 to 2014, as well as from mid-2022 to today and from 2001 to 2003.
Types of Moving Average
Simple moving average
A simple moving average is a line built on points whose coordinates are calculated as a simple arithmetic average of previous price values. The longer the period (the number of values taken into account in the calculation), the more smooth and distant from the price chart the moving average turns out to be.
For example, if on a daily chart the five-day price close was 1.2, 1.3, 1.2, 1.5, and 1.6, then the simple moving average at the next level would be 1.36. To calculate the next value of the 5-period MA, you need to discard 1.2 and add to the formula the closing price at the level next to 1.6.
In order to plot a simple moving average on a chart, you need to select the Moving Average tool in the general list of platform indicators. After this, a settings window will open in which you need to select “Simple” in the “MA Method” field. The remaining settings are set depending on the conditions of the trading strategy (hereinafter referred to as TS).
The simple moving average is the most popular of all MA categories; many strategies are built on its basis. Despite the fact that SMA is rarely used without additional indicators, there are TS designed for sliding solo trading. One of the most reliable trading strategies using SMA is the Chariot Technique.
The Chariot technique is designed for medium and long-term trading, the optimal time frame is D1 or W1. Trading on hourly and four-hour charts is also acceptable, however, the larger the time frame, the more clearly the trend can be read, and trading in the trend is the main key to the success of the Chariot. A simple moving average with a period of 40 is used as a signal indicator.
Trading is conducted according to the following rules:
- If the price crosses the MA from bottom to top and the candle closes above the moving average, you need to buy at the opening of the next bar.
- If the price crosses the moving average from top to bottom and the candle closes below the line, you need to enter the market to sell.
Stop loss is set below the minimum (or above the maximum) of the breakout candle. Profit can be recorded either by take profit (for example, by setting its distance to be three or more times the stop loss value) or by using a trailing stop.
The Chariot technique is a fairly old strategy, and although in its classical form it is used without the use of oscillators, some traders complement it with tools like ADX. The Chariot shows excellent results in a trend, but in order to minimize market entries during a flat period, it is quite logical to use an additional filter indicator.
Exponential moving average
The exponential MA differs from the simple one in that when calculating its value at each specific point, the latest price values have predominant weight over the earlier ones. The formula for calculating EMA is quite complex, but essentially it means that in a 10-period exponential moving average, the previous price value will have the greatest weight, and the closing price of the 10th candle in reverse order will be practically not taken into account.
This moving average was designed to provide a smoother transition from one time frame to another. Reducing the weight of price indicators as they are removed solves the problem of simple MA, in which discarding the last value can have a greater impact on the indicator than adding a new one. As a result, a line with the same period turns out to be smoother and closer to the graph, and its signals are less dependent on large, but already outdated values.
An exponential moving average is set on the same principle as a simple one, only in the indicator settings window you need to specify “Exponential” in the “MA Method” field.
Many Forex trading strategies using SMA are also relevant for EMA. Sometimes professional traders, improving classic trading systems, change not only the period, but also the type of MA, using an exponential moving average instead of a simple one. After testing and adjustment, such a modification may turn out to be more profitable and effective than the classic system with a simple MA.
As an example, let's look at a trading strategy based on a combination of EMA+ Awesome Oscillator indicators. This is a classic combination of a trend indicator, which determines the direction of opening a transaction, and an oscillator, which helps to choose the optimal moment to enter the market.
The TS works on any timeframe, but it is recommended to use it for short-term trading on M15-H1 charts.
Buy trades are opened when the indicators give the following signals:
- The price chart crosses the EMA from bottom to top.
- The histogram of the AO indicator crosses the zero line from bottom to top.
Entry into sell positions is carried out in mirror conditions.
The system is simple and does not impose strict conditions for exiting a transaction, so traders have some freedom in this regard. You can keep the position open until an opposite signal arrives, or you can set strict stop loss and take profit. In the latter case, the ratio should be at least 1:3 in favor of profit
Linear weighted moving average
In a weighted moving average, as in an exponential moving average, the weight of recent price values prevails over the weight of earlier ones. However, for WMA, the weight changes in an arithmetic rather than a geometric progression. For example, for a 5-period moving average, the weight of the last price value will be 5, the penultimate one will be 4, and so on until 1.
A linear-weighted moving average is installed on the chart according to the same principle as the previous ones, only in the “MA Method” field you need to select “Linear Weighted”.
There are not very many trading strategies using linear weighted moving averages. As a rule, these are advanced vehicles created as a result of experiments and modifications of simpler systems.
For example, consider a strategy with WMA, RSI and MACD. This TS is designed for medium-term trading on the daily chart; the optimal asset is the EUR/USD pair.
First you need to install indicators on the chart with the following parameters:
- 5 weighted moving averages with periods of 5, 15, 30, 60, 90.
- RSI oscillator with a period of 5 and levels of 40 and 60.
- MACD with periods of 5 and 13 for fast and slow EMA respectively (SMA remains default). Additionally, levels of 0.005 and -0.005 are set.
Sell trades are opened based on the following indicator signals:
- The fastest WMA (with a period of 5) crosses the moving average with a period of 15, and they are both below the other MAs.
- The RSI line is in the overbought zone (above level 60) and crosses this level from top to bottom.
- The MACD histogram rises above the 0.005 level and then crosses it in the opposite direction.
Buy trades are opened under mirror conditions.
This strategy was developed by Western traders several years ago, and received a lot of positive feedback on the forums. However, some experts believe that 3 WMAs with periods of 30, 60 and 90 are unnecessary in this vehicle, and if they are removed from the system, the quality of the signals will not change.
Exiting a transaction is at the discretion of the trader, however, setting a stop loss is mandatory according to all the rules of risk management. A protective order can be placed both at the minimum/maximum of the signal candle and at the nearest support/resistance level.
Smoothed moving average
A smoothed moving average differs in that when constructing it, not only price values within a given period are taken into account, but also the nth number of previous values. And although the weight of price values outside the period is much less than the weight of the latest indicators, they also have an impact on the final result. If exponential and linearly weighted moving averages move more smoothly and are closer to the price chart than a simple MA with the same period, then a smoothed moving average, on the contrary, will be more distant.
Installing and configuring the indicator on the chart is similar to the previous moving averages: the period, shift and style are assigned at the discretion of the trader, and in the “MA Method” field you must select “Smoothed”.
The smoothed moving average is the least popular compared to other types of moving averages. It is rarely used in trading strategies. Basically, the smoothed MA is used in complex automatic trading systems, and is also part of custom indicators.
Using Shifted Moving Averages
Another way to use moving averages is based on the use of the intersection of the MA and a moving average shifted forward (backward) with the same parameters.
In this case, a buy signal occurs when the original MA rises above the offset moving average, and a sell signal occurs when the original average falls below the offset one. By choosing the shift value, you can reduce the number of false crossings, reducing the frequency of unprofitable signals.
A variant of this method is the method that uses the intersection of a price chart with a shifted MA, or a price chart with a price chart shifted forward. It should be noted that the last option (used, by the way, in the popular Ichimoku indicator) is nothing more than another entry for the momentum indicator. The price chart, in combination with forward-shifted moving averages, is also used in the trading system of B. Williams. We will consider the option of crossing two moving averages with and without a shift:
The graph below shows that whatever the magnitude of the shift, the optimal period is from 90 to 150:
Negative results are again within 30%, which is quite acceptable and serves as a signal that the system is quite stable. As for the results of the system, they are not much worse than the work of two moving averages:
If we combine all the tested currency pairs into one portfolio, we get the following picture:
The picture is very similar to the result of the system of crossing two different moving averages, but the number of profitable trades is lower, and the average profitable trade is more than three times larger than the average losing trade. At the same time, periods of drawdown are more protracted. Overall, you should prefer the previous trading system.
Quick Menu
1. A moving average is... 2. Methods for constructing moving averages
- a) Simple moving average
- b) Exponential moving average
- c) Smoothed moving average
- d) Linear weighted moving average
3. Trading using moving averages 4. How to choose a moving average period 5. Moving averages in the stock market
Let's start with the theory.
Moving average (from English “Moving Average”) is an indicator for trend trading that calculates the average price value for a selected period of time. We conducted VERY detailed tests of this indicator and made a separate article with the results, many of which were surprising!
What does the average price mean:
- — exclusion of “noise” and periods of high volatility from the chart;
- — identifying the true direction of the price (trend);
- — simplifying the interpretation of the graph.
In practice, working with this indicator looks like this:
Such a calculation can be made using different formulas depending on the type of moving average, which is discussed in more detail below.
The intersection of price and shifted moving average
We will consider this version of the trading strategy because it is used as an entry signal in a number of trading systems.
The trading idea differs slightly from the previous case. The only difference is that instead of the intersection of two moving averages, the intersection of price and a shifted moving average is used.
For this system, a lot of negative results were obtained, up to 50%, which may indicate the instability of the model. Nevertheless:
As you can see, they are comparable to the price crossing model of one MA without a shift. Here are the summary statistics:
The system parameters are very similar to the first vehicle we examined. By the way, if you visually compare all the summary tests, you will see that the yield curves are similar to them - the same periods of growth and the same places of serious drawdowns. All this suggests that moving average systems generate very similar signals. In some places they turn out to be more effective, in others less so, but the final result largely depends not on specific settings, but on the behavior of the market itself.
Also, all this indirectly speaks of the fairly high stability of trading systems based on moving averages - if on a particular currency pair most of the settings during optimization give a profit, then it is not so important which of them to use. If the market does not change (trends do not disappear, which is unlikely), then the system, with a high degree of probability, will bring profit to its owner over a long period of time. How acceptable the potential profit is for a trader is another question, but judging by the test results, it has a good chance of satisfying many.
200 day moving average: trading strategy
The 200 day moving average (200 MA) is one of the most popular technical indicators.
In news reports and analytical reviews you will often find:
The S&P 500 has fallen below the 200 day moving average - the market is bearish.
Enter into purchases when the price exceeds the 200 day moving average.
Apple shares just closed below the 200 MA - it's time to sell.
However, more often than not, these tips will be completely useless, since they will push you to open positions on emotions and enter the market at the most inopportune time. In today's article we will analyze all the nuances and features of trading using the 200 day moving average.
What is the 200 day moving average?
A moving average is a technical indicator that averages recent price values and appears as a line on a chart.
Let's assume that in the last 5 days the Apple stock price was 100, 90, 95, 105 and 100. So the 5 day moving average is:
100 + 90 + 95+ 105 + 100 / 5 = 98
All 5-period MA values can be displayed as a smooth line on the chart. The same is true for the 200 day moving average. The only difference is that you are looking at the last 200 days of data, which shows a longer-term moving average.
There are also different types of moving averages: simple, exponential, weighted. The concept is the same in each of them, but they differ slightly in the calculation methods.
How can you use the 200 day moving average?
The 200 day moving average is a long-term indicator that you can use to identify and trade a long-term trend.
- If the price is above the 200-day moving average, we consider buying.
- If the price is within the 200-day moving average, we look for selling opportunities.
If you trade stocks, you can look at an index to get an overall picture of the direction of the market. For example, if the S&P 500 is above its 200 day moving average, look for opportunities to buy US stocks. This simple technique will increase your chances of making a profit and also reduce possible drawdowns.
What is the best way to enter the market?
Now you're probably thinking, “Now I know how to identify the prevailing trend in the market. But how can you find a suitable entry point?
Here are a few methods you can use:
- Support and resistance levels.
- Rebound from 200 MA.
- Triangle figure.
- Flag figure.
Let's look at each of these methods in more detail.
Support and resistance levels
Support is an area on the chart with potential buying pressure. Resistance is an area on the chart with potential selling pressure.
Thus, if the price is above the 200 day moving average, we look for buying opportunities at the support level. If the price is lower, we look for opportunities to sell at the resistance level.
Rebound from 200 MA
During a trend, the 200 day moving average can act as a significant area from which the price continually bounces. This gives us the opportunity to enter the market.
The setup gains greater strength when the 200 MA line crosses the nearest support or resistance levels.
Triangle
An ascending triangle is a sign of strength and tells us that buyers are willing to buy at higher prices. Thus, in an uptrend, when the price is above the 200MA, you can find an ascending triangle and open a position to break it. Accordingly, in a downward trend we are looking for a descending triangle.
The longer the triangle forms, the stronger its breakdown will be.
Multiple timeframe system based on MA
This trading strategy is the equivalent of a random intersection of price and moving average, but only for several time frames at once, differing in the time scale of data presentation. The essence of the trading idea for this case is as follows: we consider that the trend is upward if the price is greater than all three moving averages, i.e. that three trends of different durations on three multiple time frames of data presentation are classified as ascending. To do this, we will take time frames H4, D1 and W1 and plot moving averages with different periods on them.
The system turned out to be very stable; negative results turned out to be less than 10% of the total mass. However, the results themselves are not very impressive. Here they are:
And here are the results of summary statistics for all tested pairs:
As you can see, the results are not much better than the results of the very first TS we examined.
Task (problem) No. 1, solving which you will understand Moving Averages better than all the Forex classics
It looked good on paper, but they stumbled over ravines - this is how one can characterize the feelings of those losing traders who opened trades using “moving averages” taken from books, and the Forex market turned out to be completely different. For example,
- look at the picture, how, supposedly freely and easily, you can make a profit when 2 moving averages cross. This chart is found throughout all Forex textbooks, taken from John J. Murphy's book, Technical Analysis of Futures Markets, Chapter 9.
- Below, an example from the TS MF shows the real Forex market as completely opposite: 11 times in a few days, moving averages crossed each other in opposite directions, bringing the trader nothing but losses for each trade he opened.
How simple everything is in textbooks and how difficult everything is in life. However, this is everywhere, not only in Forex. The point is not in the euro/dollar currency pair, nor in the time frame, nor in the additional hints of the RSI, parabolic sar or MACD indicators - they will not help, because are also based on the same moving averages.
Let's consider the solution to this problem from the classics of trading : John Murphy, John Bollinger, Bill M. Williams, Tom DeMark, Lewis J. Borsellino wrote on the topic of moving averages ), Larry Williams, etc.
Trading systems based on the Alligator indicator by B. Williams
Opinions about the books by B. Williams “Trading Chaos” and “New Dimensions in Stock Trading” among traders range from complete rejection to enthusiastic veneration. What is not there is indifference, and since they are talking about books and the method, then there is something in them, at least one should pay tribute to the popularizing talent of B. Williams.
Bill Williams' trading strategy is not a mechanical trading system, but a kind of trading and analytical complex from a large set of rules and techniques for analyzing the market and performing trading operations, guided by which everyone can create their own trading strategy.
We will consider only one of the elements included in the trading and analytical complex of B. Williams and based on the use of a set of shifted moving averages, the so-called “Alligator” by Bill Williams, and the simplest trading strategies that can be built on the basis of this indicator.
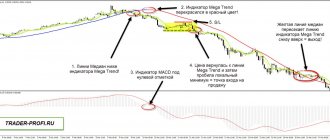
The Alligator indicator represents three shifted moving averages of different periods with different shifts, considered together as one object. An alligator is nothing more than a set of three shifted moving averages with periods of 9 (shift 3), 15 (shift 5) and 25 (shift 8), calculated at the median price of the chart. Various combinations of the relative position of the price chart and indicator elements serve as a guide to certain actions in the market. Alligator is very popular, especially among novice traders. Let's look at the tests to see what using the Alligator as an element of a trading strategy gives.
Bill Williams, a psychologist by training, writes figuratively and vividly, taking into account the psychology of the reader’s perception of the text. Therefore, his books are memorable, especially if they were read at the stage of initial acquaintance with the market. The alligator, according to Williams, hunts for prey, which is price. When the Alligator's lines are intertwined with the price chart line, the prey is caught, the alligator is fed and passive. The trader is also in standby mode at this moment.
Taking advantage of the Alligator's passivity, the prey - the price begins to slowly escape from the zone of the indicator lines, the Alligator begins to feel hungry, wakes up and opens its mouth, trying to catch the elusive prey. First, the Alligator's lips open - a green line, then its teeth - a red line, and finally its jaws open - a blue line.
The indicator lines are lined up in the green-red-blue order and follow the price as long as the trend continues. Since a trend cannot last indefinitely, sooner or later the alligator overtakes its prey and the price again falls into the zone of the indicator lines. The process, with certain differences, is repeated cyclically as new trends emerge and develop.
The first trading idea that arises when considering the Williams Alligator indicator is to use it as a trend indicator. If the indicator lines are arranged in the order of green-red-blue, then it is obvious that the trend is upward; if the order of the lines is blue-red-green, then the trend is downward. Let's try to test a trading strategy based on the order of the alligator lines.
For purchases, we highlighted the simultaneous fulfillment of the conditions that the green line is greater than the red line, and the red line is greater than the blue one. For sales – the simultaneous fulfillment of the conditions that the green line is less than the red line, and the red line is less than the blue one. We will supplement the condition for opening positions by checking the relative position of the closing price and the Alligator red line, so that there is no conflict between the rules for opening and closing positions. We will not use optimization; we will check the Alligator in its original form.
This system did not give a single positive result:
We looked at several typical options for building trading systems based on moving averages, and also looked at several filters for entry signals. We found out several interesting features, such as the strong “similarity” of the balance graphs of the tested systems.
In addition, we have found the answer to most of the questions posed. For example, we can say for sure that the moving average is still a fairly effective tool for technical analysis and that systems based on it can be quite effective. The system performed best at the intersection of two moving averages , with the most effective type of moving average differing for each currency pair.
The typical examples we have considered do not exhaust all the possible variety of options for using moving averages as elements of trading systems, but they provide the basis for the formalization and study of almost any trading strategies based on moving averages.
In addition, we still have one last question we posed about the feasibility of researching modern trading systems based on moving averages and freely distributed on the Internet.
Why are moving averages (MA) the main indicator of financial instruments?
This conclusion about moving averages, that they SHOULD become the main market indicator, was made in the first book of Masterforex-V in the winter of 2004/2005. and caused sharp criticism on the Internet from
- other Forex traders who used other indicators;
- large investors, both stock exchanges (especially NYSE and Moscow Exchange - then MICEX and RTS), and commodity exchanges (Chicago CME and CBOT, and London LME). What do you want: the guys have “direct access”, “trading real futures” using “levels” (as Alexander Gerchik now does) and “volumes”, and they were offered “antediluvian” moving averages. What a reason to demonstrate your wit and your own “coolness”);
- developers of new indicators (it’s vital here... how can you compare MA with that “unique” product that a talented developer created and sells?).
Isn't that logical? As well as the fact that none of these opponents of mine from 2003-2006 are no longer on the Internet. I know that many of them left the market, disappointed in “direct access”, “levels”, “volumes” and much more. I’ll give you one of the tips on how when “trading from levels” the loss of your trading deposit is guaranteed 100% - What are the roots of the drain of all 1.5 thousand deposits from 2015-2018 on Alexander Gerchik’s trading system and its danger for Forex traders?
Conclusion Masterforex-V 2004 was about how Moving Averages SHOULD become the “main” and “most popular” indicator” once you UNDERSTAND its secrets. Base:
- personal results on the Masterforex-V trading system (until 2006 - Masterforex, see the reasons for the change in the official TM of the Academy);
- publication of statistics on the results of an independent verification of all indicators in the book by C. Lebo and D. Lucas “Computer Analysis of Futures Markets” (1998), which Fr.
Currently, the Internet is replete with messages that MA has already BECOME the “main” and “most popular” indicator of the Forex and stock market . I was surprised to discover how the TOP 20 search queries in Yandex and Google are filled with these conclusions of various analysts - copywriters, who thoughtlessly plagiarized this material from the MF, and did not understand the essence.
Eric Nyman acted even more anecdotally , making after 2005, giving a de facto “fan of average MFs” 21, 55, 89, 144, 233 (without reference to Masterforex-V), replacing in it for “ decency” the heaviest MA from 233 to 200 (what about Fibonacci numbers, Eric Leontyevich? Ay, ay, ay).
I repeat, the main secrets are not in numbers.
Masterforex-V conclusion: do you want to learn how to make money and not lose money in the market? Then SOLVE for yourself (on your own or with our help) the unsolved problems of moving averages, 20% of which I will show how successfully solved through the Masterforex-V TS right here in the public domain (the rest with professional training).
Remember the main thing: you CAN earn more money through moving averages than through all other indicators (there are more than 500 of them in MT-4 and MT-5 alone, not counting hundreds of paid ones on the Internet) combined.
Modern trading systems based on moving averages
Regardless of what time frame the strategy is designed for, we will use H1. We will also apply our own rules for exiting and maintaining positions. This will unify the strategies - in fact, only the rules for entering a position will differ. This way we will be able to compare exactly the effectiveness of entering trades.
Is it possible to use the “MF moving average fan” on binary options?
It is possible, but completely different from other markets . Binary options are an open form of casino, in which even brokers do not hide the “cunning” of this type of Forex service they provide, because technologies for transferring these transactions to a liquidity provider via NDD, STP or ECN do not work here even in theory.
If you want to “play” roulette with “your” binary options broker , you can only earn money in the same way as in other casinos. Read more: Masterforex-V signals for binary options.
MA window
After breaking through the price of EMA8, it is proposed to expect a rollback and touching the price of EMA8 within 5-15 candles. If this happens, a new position is opened in the direction of the initial breakout. It is proposed to set fixed stop loss and take profit levels; position tracking is not provided.
The strategy is designed for the M15 timeframe, but we will use it for H1. We also use various rules for exiting and maintaining positions. We also slightly modify the entry rules - the candle that touches the MA must be directed towards the position being opened - this is a small candle filter that is designed to improve the results of the TS.
In essence, this strategy is a more complex modification of the classic TS breakout of one MA price with a filter by the number of candles.
The strategy has proven to be quite stable and its results are quite suitable for real trading. However, drawdowns are still quite long and last up to one year. In addition, several years were closed at zero: 2002, 2004, 2007, 2012, 2022. Nevertheless, the result can be considered quite acceptable.
Trend Analysis
Moving Average (MA) indicators can help us determine the beginning and end of a trend. The trading method includes several signals that tell us when to be ready to enter and exit the market. Let's talk about them some more...
- The price crosses the MA line
- The most basic signal is when the price crosses the Moving Average itself.
- When the price breaks the MA upward, we get a bullish signal.
- And if on the contrary, when the price breaks the Moving Average downwards, we get a bearish signal.
This is a 4-hour chart of USD/JPY from January to February 2016, we have a 20-period SMA on the chart. The figure shows four signals caused by price action and the interaction of the moving average line.
In the first case, the price breaks the 20-period SMA in a bullish direction. This creates a long signal. And subsequently the price rises. The second signal on the chart is bearish. However, the signal is a false breakout and the price quickly returns above the SMA. Price then breaks the 20-period SMA in a bearish direction, creating a short signal. The next drop is quite strong and sustainable.
If you are trading this strategy, you should remember that in general, the more periods included in the Moving Average, the more reliable the signal. And many traders who follow the simple moving average system watch the 50-day moving average and the 200-day moving average line very closely. However, when using a higher moving average, the lag of the moving average line to the current price action will also be greater. This means that each signal will arrive later than when we use a Moving Average with fewer periods.
This is the same USD/JPY chart, but this time we have a 30-period SMA placed on the chart along with the original 20-period SMA. Note that the blue 30-period SMA isolates the fake signal. However, the signal for a strong bearish trend comes later than the 20-period SMA (red). The long signal at the end of the trend also comes later. Keep in mind that there is no optimal moving average line that can be used in all markets or even just one.
Battle of the bands
The next strategy is called Battle of the bands. The TS is designed for hourly charts and uses a channel of two MAs built at high and low prices. To filter transactions, moving averages with a period of 100 and 200 are used - for sales the price should be below them, for purchases - above them. A trade is entered when the price breaks through the channel from the MA and the Parabolic SAR indicator confirms the intended trend. The original assumes setting a stop loss on the opposite side of the channel from the MA and a trailing stop of approximately 15 points, but, as usual, we use our own exit rules.
As you can see, the strategy is almost entirely tied to the MA and its rules are quite simple. Let's look at the test results:
The effectiveness of the strategy decreased significantly after 2014, almost to zero. However, it worked for a long time and was profitable. It is likely that with additional modifications the vehicle may well be profitable.
How to choose a period for trading using a moving average
This is a very popular question among new traders. Understanding a simple fact helped me: the average period is the number of candles on the timeframe on which the formula will be calculated (which I wrote about in the theoretical part at the beginning of the article). Examples:
MA (12) on a 5-minute interval - average values for 60 minutes, i.e. 1 hour, it is equal to MA (4) at 15 minutes, MA (2) at 30 minutes, etc.
MA (288) on 5-minute intervals is the average value for 1 day, which is equal to MA (24) on an hourly interval and MA (6) on a 4-hour interval.
Essentially, the period of the average depends on how long you are willing to hold the deal. Let’s say you plan to hold a trade for 1 hour, then MA (12) on a 5-minute chart will suit us, because these are average prices for 60 minutes. Otherwise, we want to hold the position for 1-2 weeks, EMA (7) and EMA (14) on D1 are suitable for this, but in fact it is more correct to use periods of 5 and 10, because there are only 5 trading days in a week, and weekends are usually missed on graphs.
It’s even easier to choose popular round numbers for the MA period: 10, 20, 50, 100, 150, 200, etc. The most well-known values are 100 and 200; they are used by many technical analysts in professional sources abroad (for example, Bloomberg and others).
EMA + Stochastic
The next system is EMA + Stochastic. This is another fairly simple strategy using three moving averages and the Stochastic oscillator.
The rules are simple and banal. Here is an example for buying: two fast MAs cross the slow one upward, and the stochastic is above a certain level. The picture below is an example for sales:
Now let's look at the results:
The system has generated enough trades to evaluate its effectiveness. The average profit is slightly higher than the average loss, and the number of profitable trades is slightly higher than 50%. Judging by the balance curve, trading is fairly stable, although 2006, 2011 and 2014 closed at about zero. This TS can be used on a real account.
How to trade using moving averages?
Moving Average is a universal tool. It is suitable for trading on any timeframes and assets.
There are many methods and trading strategies with moving averages. Let's look at the most basic ones.
Trading with one MA
The simplest and most universal method. Since only one indicator is used for analysis, signals to open positions will be the price crossing the moving average:
- If the price crosses the moving average from bottom to top, a buy deal is opened.
- If the intersection occurs from top to bottom, the optimal solution would be to sell.
The disadvantage of this method is a large number of false signals. One moving average can help catch a big trend, but before that, several losing trades will be opened. Therefore, it is necessary to set a hard stop loss in each transaction, and allow profits to grow, compensating for previous losses.
Trading with two moving averages
This method is similar to the previous one, only instead of one MA, two moving averages with different parameters are installed on the chart. Signals will be the intersection of moving averages with each other:
- If the fast MA crosses the slow MA from bottom to top, a buy trade is opened.
- If the intersection occurs from top to bottom, it is recommended to sell.
As can be seen from the example, using the second moving average allows you to filter out many false signals. However, the problem of lag becomes more pressing - often the MAs intersect when half of the trend has already passed.
Moving Average + MACD
MACD is an oscillator built on the indicators of two moving averages and their interaction. In conjunction with MA, it acts as a filter.
The algorithm for the MA + MACD strategy is as follows:
- It is recommended to open buy trades when the price crosses the MA from bottom to top and the MACD bars cross the line from bottom to top.
- Selling is optimal when the price crosses the moving average from top to bottom and the MACD bars in the same direction.
If the signal from one of the indicators is late and they do not arrive synchronously, it is better to refuse to enter the trade.
Hi-Lo
This strategy uses the moving average channel. A signal to buy is the crossing of the channel border by a faster moving average. An additional filter is the readings of the ADX indicator and the closure of the candle outside the channel boundaries:
Let's take a look at the results:
The system has generated enough trades to evaluate its effectiveness. The average profit is slightly higher than the average loss, and the number of profitable trades is slightly higher than 50%. Judging by the balance curve, trading is quite stable, although profitability has been almost zero since 2015. With some modification and the addition of other tools, the system could be used on a real account.
Fan Moving Averages Masterforex-V on the crypto market
The MF moving average fan works on all financial markets , incl. and on cryptocurrencies. Below is a graph of 2-week growth of Bitcoin against the US dollar (BTCUSD) from the end of June to the end of July 2022. Pay attention to the same nuances that we suggested online at the closed forum of the Masterforex-V Academy
- divergence of Zotika JSC on June 28 with the impossibility of consolidating under the level of accumulation of orders 5816;
- breaking through NK n8, as an element of preparation for an upward reversal of wave n8. The top of wave A is under 233 MA;
- divergence on wave B (flat, irregular MA fan);
- trend reversal, wave C h8 up, correct fan of moving averages MF;
- inability to gain a foothold ABOVE the resistance level of 8288, divergence, preparation for a move down into a bearish market (note how the price was consolidated BELOW the 8288 level indicated by MF).
The result of the Masterforex-V closed forum for just one buy BTCUSD transaction: almost + 2000 points (or $2 thousand for 0.1 lot). The main thing is that you consciously take profit, understanding every market movement.
Important levels
Even if a Forex trader does not base his trading strategy on moving averages, he should still study Price Action on critical moving average levels on the chart. The reason for this is that, in many cases, price action corresponds to critical Moving Average levels. Some of the most important levels are the 50-period SMA, 100-period SMA, 150-period SMA and 200-period SMA. As you can see, these moving averages are relatively large in terms of periods. These periods are of interest and it is advisable to monitor them. These levels are considered important in terms of support and resistance. The image below in action will show you the importance of using moving averages over the longer term.
This is a monthly chart of the EUR/USD pair from 2007 to 2016. The blue line on the chart represents the 150-period SMA. Note that on a couple of occasions the EUR/USD price tested the 150-period SMA as support. The two tests occurred in mid-2010 and mid-2012. In mid-2014, the price dropped to the 150-period SMA for a new test. However, the SMA was sharply broken in a bearish direction, causing the EUR/USD price to fall to a 12-year low.
Here's another example:
This is another example of a Moving Average on the USD/JPY daily chart. The image shows the 200 day moving average line on the chart. The price breaks the 200-day SMA and then tests it as resistance. This indicates the importance of the 200-period SMA on the daily timeframe.
2) EMA
Here, the weighting of the sequence members is used, decreasing exponentially as it approaches its end. We are interested in the fact that current price fluctuations are less significant than the value of the moving average at the current moment. That is, relatively old events have a greater impact on its meaning now than those happening right now.