Hello, dear subscribers. Today we will talk about Japanese candles for beginners. In simple terms, this stock exchange term should be understood as the most convenient schedule option, allowing you to predict the price without indicators.
IBM stock . Knowing the figures of Japanese candlesticks and their signs, already at the end of March 2022 you could determine that in April 2022 you should prioritize downside transactions.
After reading the article you will learn:
- what is the advantage of Japanese candlesticks;
- How does graphical analysis of financial markets occur using the method of candlestick combinations;
- how to conduct technical analysis in order to respond to incoming candlestick signals in a timely manner.
In addition, an indicator trading strategy will be analyzed as an example, the files of which you can download for free and test on your own terminal.
What are Japanese candlesticks?
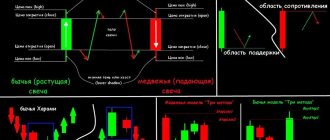
Each candle tells us four facts about itself: the opening price, the high of the price movement, the closing price and the low of the price movement.
- A bullish candle is formed when the price rises. In financial markets, the term bullish means going long or buying.
- A bearish candle is formed when the price falls. In financial markets, the term is bearish towards shorting or selling.
The body of the candle is the space between the opening and closing of the candle. If the body is white, it means that the closing price of the candle is higher than the opening price. If the color is black, it means the closing price is lower than the opening price of the candle.
For example, you are looking at the EUR/USD chart. The candle opens at 1.4200 and rises 100 points to close at 1.4300. The color of the candle will be white. If the price falls 100 pips to close at 1.4100, the candle color will be black.
The shadows of a candle represent the highest or lowest points that the candle has reached.
Each candle represents our chosen time frame or time period during which it opens and closes. For example, on a 4-hour chart, candles open and close every 4 hours.
If we line up several candles, we can compare them with a line chart. Candlestick shadows also show price fluctuations. Thus, we immediately receive the maximum information that we need for effective market analysis. This is why candlesticks are mostly used for technical analysis these days.
A trader who knows how to analyze and interpret candlestick patterns or patterns already understands the actions of financial market players a little better.
Brief excursion
The roots of Japanese candlesticks, as you might guess, come from Japan. Japanese traders began using technical analysis back in the 17th century, almost from the very beginning of stock trading. The rice traders of that time were able to see the high potential in the newly invented way of depicting price dynamics. At the same time, a significant contribution to the popularization of Japanese candlesticks was made by Homma Munehisa, who is considered the first inventor of the candlestick chart as such.
Indeed, the candlestick chart has some obvious advantages over the traditional line and bar charts used by Western traders at the time. This continued until the nineties of the last century, when Steve Nison’s materials on the method of graphical analysis of financial markets based on Japanese candlesticks were published. He also revealed to the Western world dozens of ready-made candlestick formations, which in themselves are a signal for action. These include the patterns “Evening Star”, “Morning Star”, “Triple Strike”, “Three Crows” and many others.
This topic was covered in most detail in the book “Japanese Candlesticks” by Gregory Morris, where a significant part of the material is devoted to the practical application of candlestick charts.
Unlike a traditional line chart, in one element - a candle, we get as many as four indicators instead of one. The visibility of the candle, in turn, allows you to almost instantly identify complex graphic patterns on the chart. This significantly increases the information content of the chart and allows for comprehensive market analysis.
The nature of the candle helps in understanding the psychology of traders, which is an important aspect of candlestick analysis. The candlestick chart made it possible to identify standard patterns of traders’ behavior and, accordingly, predict their subsequent decisions. As a result, a seemingly primitive analysis allowed its creator to significantly increase his capital.
All Japanese candlesticks look neutral at the very beginning
The line is a new candle that looks neutral at the very beginning. She has yet to move up or down. Traders cannot know for sure what the candle will be.
After the birth of the candle, the battle between bulls and bears begins. If the buyers are stronger, you will see the candle move upward and a bullish candle form. If the sellers are stronger, you will see the candle move down and become bearish.
Each of the candles is an indicator of who is winning the battle between the bulls and bears.
Bullish candles
A bullish candle means there is currently buying pressure in the market. As long as there are more buyers, the candles will be bullish. If the buying pressure decreases and the selling pressure increases, we will see the bullish candlesticks become smaller. This indicates the weakening power of buyers.
If the body of the candle is large, it is a strong bullish candle. If the body is small, it is a weak bullish candle. The candlestick not only shows us the current price - it tells us that at the moment the bulls are in control of the situation and there are more buyers in the market than sellers. This is important information.
If your trading strategy gives you a signal to go short but the candle is clearly bullish, it may be a good idea to not take any trades for now. Or wait a while until more sellers appear on the market.
Signal amplification
Several factors influence the accuracy and strength of the listed patterns.
- If there is a pronounced long-term tendency (trend), the signals will be more powerful.
- You should pay attention to reversal patterns only when they are located close to support/resistance levels.
- The older the time frame, the greater the likelihood of the signal being processed.
Japanese candlestick patterns are one of the most powerful techniques in technical analysis.
Combine them with trends and levels and you are unlikely to need any indicators.
Discuss on the Traders Forum
Share or save:
- Telegram
Candle shadows
In addition to showing the highs and lows of a candle, candle shadows provide us with a lot of useful information.
Small lower shadow, small bearish body and larger upper shadow. This candle tells us that at some point the bulls were trying to push the price up. The long upper shadow tells us this. However, before the candle closed, the bears took over and pushed the price back down. Therefore, the body of the candle is bearish.
Large lower shadow, small bullish body and small upper shadow. This candle tells us that at some point the bears were trying to push the price down. The long lower shadow tells us this. However, before the candle closed, the bulls took over and pushed the price back up.
Content
- Bullish Japanese Candlestick Patterns
- Abandoned baby - bull model (abandoned baby)
- Morning doji star
- Three inside up
- Three outside up
- Three white soldiers
- Breakaway candle
- Doji star
- Dragonfly doji
- Engulfing
- Three stars in the south
- Hammer
- Ladder bottom
- Morning star
- Piercing line
- Three stars
- Belt hold
- Gravestone doji
- Inverted hammer
- Tweezers bottom
- Abandoned baby – bear model (abandoned baby)
- Dark cloud cover
- Evening doji star
- Evening star
- Three inside down
- Three outside down
- Advance block
- Breakaway candlestick
- Deliberation
- Downside tasuki gap
- Dragonfly doji
- Engulfing
- Meeting lines
- Three stars
- Gravestone doji
- hanging man
- Belt hold
- Harami
- Shooting star
- Harami cross
- Tweezers top
How to understand Japanese candlesticks?
We can think of price movements in financial markets as a battle between buyers and sellers.
- If there are more buyers than sellers, or buying interest is higher, the price continues to rise. The price rises until it is so high that sellers find it attractive again.
- If there are more sellers than buyers, prices will fall until balance is restored and more buyers enter the market.
- The greater the imbalance between these two market players, the faster the market will move in one direction.
- When the interests of buyers and sellers are in balance, there is no reason for the price to change. Both parties are satisfied with the current price and balance appears in the market.
Any price analysis is aimed at comparing the strengths of both sides and assessing who currently controls the market situation and in which direction the price is most likely to move.
The color of the candle will tell us who is in control of the situation - bulls or bears.
The length of the tail shows us the strength of the price rebound from a certain level.
Body size shows us the strength of buyers or sellers. For example, a large candle without shadows tells us that the bulls are in complete control of the price and the buying pressure is minimal.
The long shadow of the candle tells us about a strong price rebound and selling pressure. Even though the candle itself is bullish, overall the sellers are much stronger.
By combining these three factors, we can fully interpret Japanese candlesticks on a chart.
It is not necessary to memorize all candlestick patterns. The main thing is to understand the structure of the candle. Namely:
- Body size.
- Length of the shadow.
- The ratio of the size of the candle body to its shadow.
- Body position.
Body size
The size of the candle body shows the difference between the opening and closing prices and tells us about the strength of buyers or sellers.
- A long candle body that causes prices to rise quickly indicates a rapid increase in buying interest and strong price movement.
- If the size of the candle bodies increases, then the price movement along the trend accelerates.
- When body sizes decrease, it may mean that the prevailing trend is coming to an end due to a more balanced balance of buyers and sellers.
- Candlestick bodies that remain constant confirm the prevailing trend.
- If the market suddenly moves from long rising candles to long falling candles, it indicates a sudden change in trend and highlights a strong bearish trend. At the same time, the opposite situation is also true.
Left: long bearish and bullish candles in downtrend and uptrend phases. Lateral phases are usually characterized by smaller bodies.
Right: Long bullish and bearish candles are stronger in uptrends and downtrends. At the peak of the balance between bulls and bears, the price is characterized by smaller candle sizes.
Shadow length
The length of the shadows helps determine volatility, that is, the range of price fluctuations.
- Long shadows can be a sign of uncertainty because it means that buyers and sellers are competing strongly, but neither side has yet been able to gain an advantage.
- Short shadows indicate a stable market with little volatility.
- The length of candlestick shadows often increases after an uptrend phase. This indicates that the struggle between buyers and sellers is intensifying.
- Healthy trends that move quickly in one direction usually show candles with small shadows as one side of the market players consistently dominates the market.
Ratio of the size of the candle body to its shadow
- During a strong trend, the bodies of the candles are often significantly longer than the shadows. The stronger the trend, the faster the price moves in the direction of the trend. During a strong uptrend, the candles usually close near the high of the body and thus leave no shadow or only a small shadow.
- When a trend slows down, the ratio of buyers and sellers changes and the shadows of the candles become longer compared to the bodies.
- Consolidation phases and price reversals are typically characterized by candles that have long shadows and short bodies. This means that there is a relative balance between buyers and sellers, as well as uncertainty about the direction of future market movement.
There are almost no shadows in the ascending phase, which confirms a strong trend. Long shadows are visible during the consolidation phase, indicating uncertainty and increased competition between buyers and sellers. When the shadows of the candles increase, it can herald the end of a trend.
Body position
- If you see only one dominant shadow on one side and the body of the candle is on the opposite side, then this scenario is called a pin bar. The shadow indicates that although the price was trying to move in a certain direction, however, the opposite side of the market pushed the price strongly in the opposite direction.
- Another typical scenario shows a candlestick with two equally long shadows on both sides and a relatively small body, which is called a doji. On the one hand, this pattern can indicate uncertainty, but it can also indicate balance between market players. Buyers tried to push the price up, and sellers tried to push it down. However, the price eventually returned to its original point.
Counterattack
These are two contrasting candles, whose closing points are at the same price level, called the “ balance line ”.
Model features
- Two oppositely colored candles with approximately the same body sizes were formed;
- The trailing candle always opens with a price gap that matches the main trend;
- The bodies of the candles participating in the combination do not overlap each other and always close at the same level point.
Factors that enhance the formation
- On the path of the price movement, a round level with a double or triple zero (1.1000, 1.2500) was formed;
- After the appearance of a new candle, the “ Counterattack ” pattern moved into the “ Tweezers ” formation;
- The next candle that occurred after the " Bearish Counterattack " closed below the " balance line ". For a Bullish Counterattack , the new candle must settle above the Balance Line .
Japanese candlesticks and market analysis
Now that we've covered the individual elements, we can put everything together and see how we can use our knowledge of candlesticks to analyze price charts.
- During a downtrend, the candles are only bearish and long with very small shadows or no shadows at all - this indicates the strength of sellers.
- Below we see a price rebound. This is not enough to cause a reversal, but then we start to see strong bullish candles.
- The trend moves with strong bearish candles and no bullish candles at all.
- Then the bodies become smaller and the shadows longer, indicating that the momentum is fading.
- The price returns to the previous support level, which now becomes resistance, and we see a small rebound candle.
- At the support, we see that the candles become smaller and have more shadows, which confirms the indecision in the market. This also makes a breakout of the support level unlikely.
- Just before the support level is broken, price is just starting to form bearish candles and we can see momentum emerging.
- During an uptrend, the candles are very long and have only very small shadows.
- Then we see two long shadows at the bottom. This shows that the price was trying to move lower, but it did not have enough selling pressure.
- The candles get even smaller after a failed sell-off, which indicates the trend is ending
- Then suddenly we see a strong bearish candle that confirms a new downtrend.
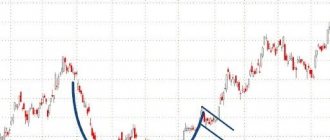
Ricochet
These are very unusual reversal patterns that occur quite rarely and usually cause major players to intervene or publish unexpected economic forecasts.
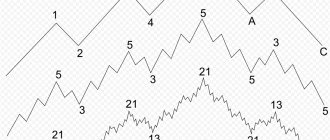
Model features
- In an uptrend, three sequentially rising candles are formed, the bodies of which do not intersect with each other. During a downward trend, this rule is worked out in a mirror manner;
- The fourth candle opens with a gap and does not intersect with the body of the third candle;
- In a downtrend, the fourth candle must meet two conditions: open above the close of the second candle and close above the open of the second candle;
- In an uptrend, the fourth candle must meet two conditions: open below the close of the second candle and close below the open of the second candle.
For this model, there is no need to look for additional factors that enhance its significance. If you see a similar combination on the daily or weekly chart, I recommend immediately entering the trade at the market price. In most cases, the Ricochet is followed a strong price impulse , from which you can make good money.
Reversal patterns
Candlestick patterns indicate a particular price trend. But this does not mean that you need to immediately open a trade when you see a suitable pattern. It would be best to combine candlestick patterns with other structural factors of price movement in the market.
All candles and models that we will analyze are mirrored in relation to each other.
A pin bar is a candle that bounces from its maximum or minimum value.
The pin bar candle should not have a shadow, or it may be very small. The price should close within the range of 1/4 of the candle body. The shadow of the candle is two or three times longer than the body.
A pin bar means that at first the initiative was on the side of the sellers, and then it suddenly passed to the buyers. At a given period of time, the pin bar shows the reluctance of the price to move below a certain level and a sharp rollback from it.
When you encounter a pin bar on a chart, you should not expect that after its appearance the trend will immediately reverse in the opposite direction. It would be best to wait for additional confirming factor.
The absorption pattern is a reversal pattern, which also tells us about a sharp rejection of the price from a certain level. In fact, it is a pin bar only on two smaller time frames.
The first candle should be small in size. The second candle is opposite in direction to the first and completely absorbs it with its body.
Absorption means that at first the price was moved by sellers, and then the initiative suddenly passed to buyers. Buyers completely defeat sellers.
A gap in the clouds is a formation that resembles an absorption, but indicates an even sharper price reversal.
Sellers confidently moved the price down, but suddenly some important event or news occurs, and the price suddenly turns upward.
The tweezer formation tells us that there is a certain strong level below which the price cannot fall.
This is a reversal formation in which two candles beat their shadows one on one against some level. On the first candle, sellers move the price down, but are faced with buyers who completely buy out the asset. On the second candle, sellers make a second attempt to move the price down, but at the same level, buyers appear again and decisively move the price up. Most likely, the price will go even higher further.
The morning star consists of three candles and tells us that buyers have won over sellers.
The first bullish candle is full and large. The second candle is very small. The third candle is large, full-bodied, but already bullish.
On the first candle, sellers controlled the price. At the second small candlestick, uncertainty arose in the market when the forces of sellers and buyers are balanced. But the third candle shows us the unconditional victory of buyers.
It is worth noting that it is not necessary that there should be only one small candle between two large candles. There may be several small candles. The market may remain in a state of uncertainty for some period of time.
Tweezers
These are two or more candles that formed equal price highs or lows within the same market period.
Model features
- The tweezers must consist of at least two candles;
- The group of candles participating in the combination must follow one after another;
- Each candle must exactly repeat the minimum/maximum of the previous one.
Factors that enhance the formation
Tweezers pattern becomes more significant if it is part of another reversal candlestick combination. Below you can see some examples of how this can happen.
My observations
Tweezers is an excellent pattern that tells traders the location of a significant horizontal level . I check this combination with indicator readings, and if the value is confirmed, I place pending limit orders at the minimum/maximum.
Doji
Candlesticks that indicate an uncertain market state are Dojis. This candle has large shadows and a small body.
The higher the shadows of the doji candle, the more buyers and sellers fight for control of price. At first buyers and then sellers might dominate, but eventually the market temporarily reached equilibrium.
When the candle has no body at all, and the shadows are very short, such a candle indicates complete uncertainty in the market and the balance between sellers and buyers.
Harami
This is an easily recognizable combination that resembles a pregnant woman in appearance. Harami is considered an early signal that warns of imminent market instability . After this pattern appears, it is advisable to take profits and wait for new conditions to arise using indicators.
Model features
- Always consists of at least two candles;
- A large candle completely dissolves the second and all subsequent candles in its body;
- The trailing candle has a small body and short shadows. The color of this candle itself is not important and is not taken into account during the analysis.
Factors that enhance the formation
- The closing candle looks like a “ Dodge ”. This formation is called a “ Harami Cross ” and usually occurs in an area of strong price levels;
- More than 5 trailing candles have dissolved in the body of the mother candle;
- After the Harami , a control candle appeared. During a downward movement it should be white, and during an uptrend it should be black.
Continuation models
Continuation patterns show that the price is likely to continue moving in the same direction. If you like to trade trends, then these formations will be useful to you as an opportunity to enter a moving trend.
Model three candles.
The first candle is large and full-bodied. Then three small candles appear that move in the opposite direction. A large and full-bodied candle changes the direction of the market and moves towards the first large candle.
Three small candles tell us that some buyers are closing their positions, but this is only a small part, since the fifth candle tells us that the bulls remain strong. Soon the price will continue its upward path.
The most popular continuation pattern is the inside bar.
When an inside bar appears in a trend, this indicates that there is a pause in the market, after which the price is more likely to continue moving in the same direction.
How to search for trading formations based on continuation patterns? To do this, we need a support or resistance level or moving averages.
For example, if the price breaks through a resistance level and tests it on the other side, we can expect three candles or an inside bar to appear.
Marathon of trader Dmitry Baranovsky.
An interesting and informative story of the famous trader Dmitry Baranovsky “How I earned and lost $250,000 on the stock exchange.” The article is primarily interesting because it tells the story of the rise and fall of a living trader, our contemporary. Dmitry's notes are a generalized personal experience. He does not force anyone to follow his example and share his views on trading, emphasizing that everyone only goes their own way. The article is written easily, reads with interest, what is called “in one breath.” The last paragraph of the material provides a link to the forum , where the thoughts expressed by Dmitry are discussed, and where you can ask him or his colleagues almost any question.
(27 KB.)
Trading examples
Now that we have studied forex reversal candles and their patterns, we can find potential trades on the chart. However, candlestick patterns are not traded separately. We must take into account the current context of the entire graph. Candles should always rest on something. These can be support or resistance levels in sideways markets or moving averages in trending ones.
Pin bar
Absorption
morning Star
There is no need to think that candlesticks in Forex are the holy grail, and these formations will always work. This is wrong. Therefore, never forget to limit your losses and control your risks.
Absorption
This is a powerful reversal signal that is formed by a combination of two contrasting candles. For a long time, this model could be used as an independent trading strategy.
Model features
- Several candles are always involved in the formation of a figure;
- The bodies of the candles of a given combination always have a different color;
- The first candle should completely dissolve in the body of the second.
Factors that enhance the formation
- The second body is 4 times larger than the first;
- The pattern was formed after a sharp impulse movement in the direction of growth or decline;
- Several bodies dissolved in the second candle.
My observations
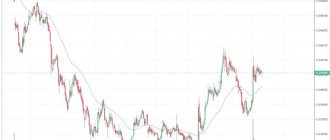
Unfortunately, in 2022 the situation changed and the formation was no longer considered reliable . Here's why this happened:
- In the history of the chart, “ Absorption ” is worked out in about 70% of cases;
- Due to its high accuracy, most beginners adopt this formation;
- Large players have tracked this activity and now, with every obvious “ Takeover ,” they try to work against the crowd.
Daily chart of the dollar/canadian dollar . Absorption models that did not work : after their appearance, the market practically did not react or went against the expected forecast.
To avoid falling victim to market maker manipulation, I recommend using this combination only in conjunction with strong horizontal levels .
Compare Japanese candlesticks and make predictions
Let’s take a practical look at how you can learn to measure candles relative to each other and understand where the price will potentially move.
The conditions of the problem are quite simple, you just need to name the further direction in which the market is likely to move. Your chance of success is approximately 50%. But let's try to analyze the situation in detail and understand what the market really wants to tell us.
So, there is a large bullish candle on the chart. A large bullish candle means that there are a huge number of bulls in the market that are aggressively pushing the price up. Everything seems clear here, there shouldn’t be any problems. Let's look at the following condition: the price encounters a resistance level.
And in this case, a law begins to apply in the market, which says this: from resistance we expect a rebound downwards, from support we expect a rise in price. All this happens because the bearish forces are at the resistance level. So, when the price crashes into this level, the battle begins.
When we have a small inside bar with an opposing body forming on our chart, this can lead us to one simple question.
And really, where could the opposite forces have disappeared so suddenly, especially since the next bar shows the appearance of bears in the market, although it is uncertain due to the fact that it is an Inside bar.
As you understand, any strong movement tends to continue, so the bulls could not evaporate so easily. There is a high probability that there will be another attack, but what do we get in the end?
Our situation is as follows: on the one hand, we have a strong movement into the level, which obviously wants to break through it. On the other hand, we have a sharp disappearance of attacking forces, which signals either the incredible strength of the bears or a coffee break on the part of the bulls. But in this case, we still have a resistance level that can push the market down.
In general, everything here is incredibly simple if you know Price Action well enough. So, since all the action takes place at the resistance level, from which we MUST open sell trades, we are prohibited from placing a pending buy order using the Inside Bar pattern, as we could run into big problems.
On the other hand, we cannot place a pending order to sell, since the growing candle shows that there is a huge force of bulls in the market who are ready to rush up, so our order can touch and then turn around and knock it out at the stop-loss level.
As you can see, the second method is not the best. So, what can show us is that the bulls are already exhausted, and the bears are ready to rush down from the resistance level. A couple of seconds to think...
It’s simple, the inside bar can become a fake for sale, because its upper spike will show an attempt by the bulls to attack the bears, but if the attempt is unsuccessful, then the spike will indicate to us both the weakness of buyers and the strength of sellers.
Accordingly, our plan is this: if the next bar is Ffyki, then we will certainly enter sales according to all the rules of rebound from resistance, because the current forces in the market will change.
But, if we have a breakout, then we will wait for a correction to the broken level and enter a buy position, it is advisable to confirm this action with a candlestick signal in the direction of the bulls.
Klaus J. Joel "Money is love, or something worth believing in." Volume 1 - 2.
Life observations show that sometimes a person, as they say, “struggles” from dawn to dusk at various jobs, devotes himself entirely to labors and worries,
is by no means a quitter, but he can’t get out of a state of financial trouble.
The other, it seemed, without much effort, was only increasing his own capital, walking effortlessly through life. Is it only in the hard work and business qualities of each of them that the success of financial freedom lies? Not always. Often, a person’s attitude towards money, or rather, on the contrary, the attitude of money towards an individual, is hidden in the area of psychological aspects. First of all, the desire to become rich is broken by the barrier of fear of failure. Tips Kl. Joel will help you get rid of the strongest limiting beliefs and fears, such as: “I will never be rich”, “money is evil”, “there is never enough money”, because a person will never be able to get what he is afraid of. We can say that his book “Money is Love, or Something Worth Believing in” is an instructional guide to getting your first million. Read, implement what you have written and accept changes in your life, and the financial result will not be long in coming.