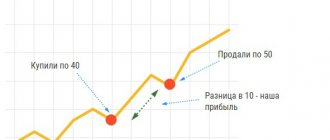
As you know, profit in stock trading is achieved due to the fact that assets are bought and then sold (or vice versa) on more favorable terms. To make a profit, you need, in fact, only one thing - to guess where the market will go in the near future, or at least be able to break even until the market moves in the right direction.
There is only one thing: for the first (if we assume a complete lack of skills and knowledge) luck, for the second - a lot of capital.
However, the buy and hold strategy remains very popular among many novice traders, particularly those with large capital, and some still manage to make good profits from it. The fact is that its meaning is clear even to a very stupid person, and the risk seems minimal or completely absent: buy, for example, Bitcoin or the dollar. In relation to what, that’s the next thing, i.e. it’s clear that the risks are different, but that’s not what we’re talking about now. Well, let’s say, buy a dollar or bitcoin for rubles. And hold it until the dollar or bitcoin rises in price relative to the ruble so that you can resell it for rubles with a profit in rubles.
It's clear? Yes, even a child will understand. Therefore - see above - many are trying to increase capital in this way, which in a sense is comparable to bank deposits with interest, only if the interest there is still not too high, then everything here is not very stable: you can wait a long time for profit, but if As a matter of principle, do not sell the dollar for less than its former price; theoretically, profit is guaranteed.
But in reality, no, it’s not like that. More precisely, if dollars or bitcoins were bought without the participation of the Forex exchange, then yes, no one would forbid holding them forever. But there is also such a thing as a swap, that is, payment for maintaining an open position on the market for a long time. Thus, a trader who does not close a deal for a long time (if the dollar becomes cheaper) constantly incurs losses.
But even taking into account swaps, spreads, commissions and other obstacles, there are still enough “holders”...
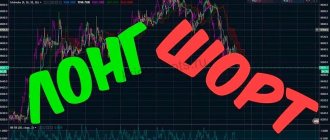
“Holders” can not only buy, but also sell the dollar (bitcoin) for the same reason, only in the opposite direction - counting on its fall. Then this is called a “short” position - short, and a purchase - long, that is, long. The difference, by the way, is very conditional: in both cases, one thing is still bought for another, the first asset is simply taken “as a basis”, and we talk about short if we sell it for something else, but about long - when we buy.
But there are a lot of situations that can hinder the “holders”, and one of them is short squeezes (or, accordingly, long squeezes). We will talk about short squeezes later in this article.
Reasons and algorithm for level retest
I believe that with the technical side of the issue everything is extremely clear, since the figure considered is essentially elementary. Much more interesting here are the true reasons for the formation of a rollback and the motives of traders.
As a rule, the algorithm for generating a level retest can be divided into several stages. In particular, at the first stage after the breakdown of strong resistance (I will consider only levels of this type, since with supports the logic of work is diametrically opposite), the movement accelerates due to triggered pending orders and stop losses of the opposite side. We see the result on the chart - these are powerful impulse candles.
Then, when sellers see local overbought, they begin to take a short position in the expectation that the breakout will be false. Let me remind you that a retest of a milestone is possible only if the given quote or price area is “strong”, i.e. market players seriously believe that objective reasons for its breakthrough are simply not enough and are betting on the market returning to its usual range.
In addition, as the price rises, some buyers decide to fix part of the position, i.e. they sell previously purchased volume while the market provides a profitable opportunity for this. Coupled with the actions of sellers, such sales lead to the price “sliding” to the broken line.
At the last stage, a new struggle unfolds between buyers and sellers, as a result of which the price will either break away from the previously broken border (this will be a retest), or return to the previous range (in the second case, we are dealing with a false breakout, which can be seen with the naked eye on large timeframes, for example, on D1).
The Nature of the Short Squeeze
Short squeeze is translated as “short squeeze”. A short is a pure selling operation when a player bets on a market decline and sells shares (or other assets). The sale occurs through a loan of shares from a broker, who in return requires collateral. These may be securities or cash equivalents that will be sufficient to cover the short position. Then the trader sells these securities at the desired price and, after waiting for a decline, buys back his position, thereby making money on the fall. It is extremely important to predict this moment in order to be able to play short (Fig. 1).
Rice. 1. An example of a short operation on MMK shares
We also recommend reading about MMK shares and dividends on our website
However, if the stock you are short rises in price, the broker may force you to close the position (margin call). This means that there are not enough funds to cover the required amount of collateral, and the trader may suffer serious losses. In order to prevent such a situation, players tend to close unprofitable positions in advance. As a result, when the closure becomes widespread, the value of the asset rises even more due to high demand and higher prices in the market book.
We also recommend reading about position averaging in trading on our website
What is a market squeeze?
A market squeeze can refer to either a short squeeze or a long squeeze. A short squeeze affects sellers who are effectively “pushed out” of the market in light of rapidly rising prices. They will try to get out of their short positions as quickly as possible to cut their losses.
A long squeeze is when buyers are forced out of the market due to suddenly falling prices. Again, they will try to close their positions quickly to prevent large losses.
Know your levels
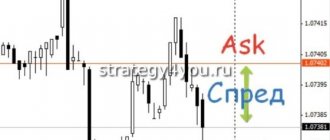
Before considering buying or selling a currency pair, it is necessary to identify key support and resistance levels. This will help determine a plan of action for future price movements. In other words, all you have to do when you already have these levels on the chart is sit and look for buying or selling opportunities.
The practice of constructing support and resistance levels not only helps to free yourself from emotions in trading, but also allows you to get a second or even third chance at entry.
Take, for example, the daily chart of the AUDUSD currency pair. As you can see, the flag was formed after a long upward movement.
Note that the pair never tested the flag support line again as new resistance after the confirmed breakout. Perhaps, if you were following a lower time frame at that moment, you were able to successfully enter the trade.
But what if you haven't traded this way? Perhaps you were not around when it happened, or the pair fell sharply without activating your limit order. I think we have all experienced this feeling when, after opening the terminal, it turned out that the market missed our order by just a few points.
In such cases, you may want to look for a second chance to enter. In the example above, the trade could have been opened after a bearish pin bar.
Slippage
Now about slippage.
Slippage is often a small (although sometimes very significant) deviation of the price executed on the market from the one at which you planned to complete your transaction. It may differ for the better or for the worse.
Depends on several factors. First of all, from the action itself, because... There are wild and there are calm stocks. So it depends on the specific situation at a specific point in time.
Simple example:
Imagine that you decide to buy shares of AAPL at a price of $128 per share. However, at the time of the transaction, besides you, there are a lot of people who also want to buy it at $128.
In this case, everything will depend on how quickly you sent your buy order. If you are ahead of others, you will receive a price of exactly $128. If someone is ahead of you, then you will receive a higher price, for example, 128.05 cents.
It is also important at what point you buy shares. After all, it often happens that news comes out about companies. Often important news.
For this reason, the public that wants to easily make money is many times larger than on ordinary days when there is no news. In this case, the slippage may be greater and you may be opened not at 128.00, but at 128.10, for example.
However, neither squeezes nor slippages should be feared at all. These are small things that you won't notice at all if you have a trading system. Your trading methodology, which already takes these factors into account.
That's all for now.
Alexey Solin was with you, my website is www.AlexeySolin.com
Have a great mood, my friends!”
Personal request. Dear colleague, if my article was useful to you, then leave your comment about it just below:
Short squeeze mechanics
Well, we’ve sorted out short selling, now let’s move directly to what in stock trading is usually called a short squeeze. Imagine a situation where, at a certain point in time, most of the positions open on any financial instrument turn out to be nothing more than the same short positions that we discussed in detail above. In such cases, the financial instrument is said to be “shorted” (for example: shares are “shorted”).
Let us further assume that the price of such a shorted instrument will be given a short-term positive impulse upward (for example, relatively minor positive news regarding the company issuing the shares or a series of large purchase transactions).
As a result of this initial, slight increase in the stop-out price, the first short positions will begin to be closed, the size of the paper loss for which was already in what is called the “red” zone (the margin was almost exhausted). After all, it may well turn out that not all short sellers will be able or willing to provide additional security.
This “collective” closing of shorts will add additional impetus to price growth, because we know that such closing is nothing more than a purchase (redemption) of previously shorted securities. And an increase in the volume of purchases (read: growth in demand) leads to an inevitable price increase (see the law of supply and demand).
When the price rises even more, another “batch” of open short positions will be in a margin call state and some of them will again be closed by stop-out, leading to an even greater increase in the price. Thus, gradually, this process can take on an avalanche-like character - short positions will be closed en masse, giving a powerful impetus to further price growth.
Usually, scalpers and short-term speculative traders add fuel to the fire. Trying to catch a local top and profit from a further pullback, they also go short, and then, like most others, fly out of the position due to a stop-out.
In the end, the fuel that generated this explosive growth (one might even say a chain reaction) runs out - most short positions are closed. The price may fly by inertia for some time, but in the end, this growth, not supported by any fundamental factors, is choked and the securities that were soaring naturally roll back down. This pullback, as a rule, occurs as unexpectedly and almost as quickly as the rise that preceded it.
It often happens that a short squeeze has a purely manipulative nature, when short sellers are literally driven into a corner by starting to aggressively buy securities in large volumes. Short sellers have no choice but to exit their positions. This kind of tactic is simply called a “corner” (from the English corner).
Therefore, large players are not inclined to advertise their positions, so as not to become a victim of a corner (having learned about the large volume of short positions, other fairly large market participants may try to “squeeze” them out of their positions by artificially organizing a short squeeze).
Although this kind of tactic is illegal, like any other attempt to manipulate the market, in practice it is quite difficult (if not impossible) to prove the guilt of those involved.
What are shorts (short selling)
There are longs, and there are shorts, and in trading these are not pants of different lengths, but the names of positions on financial instruments depending on the direction in which they are open. In simple terms, long is a buy position, and short is a sell position.
However, shorting is not a simple sale, but, so to speak, the sale of something that you actually do not have. Confused you? Nothing, read on and everything will become clear.
That is, for example, if you buy one share of Apple, this will be opening a long position. If you then sell this share, you will simply close your position (there were 1 shares, but now there are 0). Well, what if you didn’t initially buy a share, but after seeing its price chart and analyzing fundamental factors, you came to the conclusion that its price should soon decrease, and decided to sell it?
Is that really possible? Yes! In the stock market, this is quite possible and this is what is called short selling, short selling or simply shorting. And this will be precisely the opening of a new position (in this case it was 0, but became -1).
So, if you decide to make money on the decline in the price of the same Apple, you can simply open a short position (in other words, take and sell the number of shares that you do not own). How to sell something that doesn't actually belong to you? The answer is simple: you need to borrow shares from a broker.
How to do this, and most importantly, why does a broker need this? This is quite simple to do, literally with one click of the “SELL” button in the trading terminal window. Well, the broker needs this in order to receive his commissions from the next transaction. Do not think that by lending you shares for short sale, he is risking something, because at the same time he is deducting a certain amount of money from your trading account in the form of collateral or, as they also say, margin.
How does the short selling mechanism work?
Essentially, when selling short, something like this happens:
- You borrow the number of shares you need from the broker and sell them at a price of P1;
- Then, when the price reaches a given level (TAKE PROFIT - in case of profit or STOP LOSS - in case of loss), you buy back the shares at price P2 and return them back to the broker, and take the difference received in the price in the form of profit (or loss);
- If the price has decreased during this time (P2
Don’t be alarmed, you won’t have to do all the manipulations described above. In fact, as mentioned above, you only need to click the “SELL” button, the broker will do the rest for you. At the same time, he will vigilantly monitor that the current (paper) loss on the open position does not exceed the size of the margin you contributed and, in order to prevent this extremely undesirable event for himself, he will first issue a MARGIN CALL requirement, and then, if the latter is not met, he will forcibly close the position by STOP OUT.
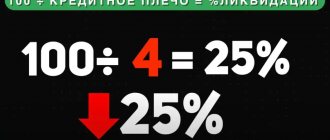
Let's look at this with a simple example. Let's assume that you decided to profit from a decline and opened a short position - selling 100 Tesla shares at a price of $575 per share. At the same time, the broker not only borrowed shares for you to sell, but also provided you with a leverage of 1 to 10. This means that to open this position you will need not $57,500 ($575×100=$57,500), but an amount ten times less - $5,750 .
Further, if your forecast is correct and the price actually decreases (let's say to $550), you will make a profit in the amount of: ($575-$550)x100=$2500. Well, if the price does not live up to your hopes for it and continues to grow (let’s say up to $600), then you will receive a loss in the amount of: ($575-$600)x100=-$2500. The broker will simply deduct this amount from the security deposit you paid.
Well, what if the stock price rises not to $600, but, say, to $630? In this case, the size of the loss will be: ($575-$630)x100=-$5500 and all that will be left of your warranty coverage is: $5750-$5500=$250. Another two or three points of price increase and it will be completely exhausted. Then the broker will have nowhere to write off your current loss and he will ask you to replenish the margin (set a MARGIN CALL requirement), and if you refuse or cannot do this, then your position will be forcibly closed by STOP OUT. In this case, the resulting loss will be fully compensated to the broker by the margin you previously contributed.
STOP OUT - forced closure of a transaction by a broker if the client refuses to replenish the margin (guarantee) on a position that has gone into the red.
What levels can you use?
Level retest in trading is one of the techniques that can be implemented in various trading systems. For example, if you trade using breakout strategies and open trades immediately after breaking through the minimum or maximum of a candle that closed below or above a level, respectively, a level retest can be used as an additional filter when selecting quality signals.
Repeated testing of broken levels works in 8 cases out of 10. Sometimes the price does not retest at all. In this case, the trader simply misses a signal, which can be either profitable or unprofitable. In some cases, after a retest, the price does not continue to move in the direction of the breakout. This situation is shown in the example below (screen of the Roboforex broker platform).
The resistance level at the top is based on points 1 - 3. At point 4 the line is broken, and at point 5 there is a retest of the level. Then the price begins to rise, but cannot break through the last local maximum and consolidate its position. At point 6, the price again breaks through the line, which now acts as support, falls a little, and retests at point 7.
In the example above, the price retested the level twice (at points 5 and 7), but one signal turned out to be false.
To enter the market after retesting the broken level, you can use the following tools:
- Fibonacci levels;
- round levels (1.2000; 1.1500; 159.00, etc.);
- Murray levels;
- inclined levels;
- triangles and other graphic shapes;
- Pivot levels.
Using a level retest in trading allows us to minimize the number of market entries, however, it is worth noting that along with false signals, we also miss those that could bring profit. You should not wait for a retest if the breakout occurred on a strong impulse, and after it the price moved significantly away from the broken level.
You can use absolutely any indicators and types of levels, since a retest is just a technique that can be used in different situations and with different instruments. It is important to remain consistent in trading breakout levels. If you prefer to wait for the price to retest to open a position, always do this. If you enter the market immediately after the level is broken, stick to this algorithm in every trade.
Before you start trading, be sure to check if you have chosen the right broker. We recommend working with reliable companies: Instaforex, Roboforex, Grand Capital.
Types of false breakouts
There are three types of false breakouts, each of which differs in its structure and strength.
A false breakout with the tail is the simplest, but at the same time, the weakest of the possible variants of false breakouts. One candle crosses the expected level of support or resistance, after which it rolls back and buries itself within the original position. Thus, the candle appears with a long tail, which crosses the level. The strength of such false breakouts grows taking into account the time frame and, as a rule, such LPs are relevant for charts starting from the hourly one. If you are trading this particular TF, then after the candle closes, you can enter the market or with a pending order from the expected level. On short time periods, such a candle may be followed by similar ones, and if you enter hastily, your position may become unprofitable.
A false breakout by two bars is much more common and can already be applied on lower time frames, such as 5-minutes or 15-minutes. The formation consists of two candles, the first of which goes beyond the level and closes beyond it, after which the second candle immediately begins to move in the opposite direction and closes within the previous position in relation to the level. The fact is that most market players who work by levels will enter the position after the first candle closes, since for many this is a strong confirmation. This is precisely the calculation that large players assume when forming such a false pattern.
A false breakout by a group of bars is the strongest and most effective false breakout pattern. This formation is presented as follows. One or more bars cross the level, after which they begin to move slightly in the direction of the breakout. Then the price stops and begins to slowly or, conversely, impulsively return to the level and crosses support or resistance in the opposite direction without stopping.
This formation is the most sophisticated method of deceiving small players and often, after such a false breakout, the strongest movement in the opposite direction begins, since adherents of breakouts, retests and all variations of these methods of entering a level breakout fell for this false call. If you entered in the direction of the breakout and see that the price returned below the expected level and consolidated on the return almost without stopping, in this case it is better to close the position and take a closer look at the entry in the opposite direction.
False breakouts are confirmed by volumes. In case of a false breakout by one candle, this candle should be accompanied by increased volume. If we consider the LP as two or a group of bars, then the volume should be higher and the return candles than the first ones that crossed the level.
Trading during a short squeeze
More than one short squeeze is expected in the near future, as the cryptocurrency market is characterized by high volatility. Professional investors recommend during this period to wait for the restoration of healthy buying trends, when the artificial pump evaporates, the exchange rate value of the asset is adjusted, and transactions in the bull market are resumed.
Inexperienced short traders find themselves at a loss due to the short squeeze, as it is difficult to predict. A high rate of short positions in itself does not mean that further growth or depreciation will follow. It is worth paying attention to a serious increase in volume on the chart, periods of strong bullish movement, closing of short positions, and the appearance of fakes to drive bears into traps.
The following recommendations will help you gain experience in trading during short squeeze periods:
- apply intraday and short-term strategies;
- prepare a list of assets to enter the market in a moment of panic, use squeezing as a way to enter a trend;
- always follow the rules of risk management;
- make decisions based on live charts, such as TradingView.
You can predict the squeeze out of shorts based on intraday figures or setups with constructed breakouts. The trader must monitor the formation of the flag, use the triangle, stochastic oscillator and other figures.
For short cryptocurrency, platforms such as Bitfinex, BitMEX, LedgerX, HitBTC are suitable.
- How to use the Moving Average Convergence/Divergence indicator?
- Short Float coefficient
As mentioned above, the main factor for the occurrence of a short squeeze is a clear “excess” of short positions. To identify this kind of advantage, traders use the Short Float coefficient.
An excess of short positions is indicated by a value of this ratio of more than 30%. Where and how can I watch it? For these purposes, I use the stock screener on the Finviz.com website located at: https://finviz.com/screener.ashx?v=111
In order to select stocks with a Short Float indicator above 30%, in the filter settings, look for the Float Short item and select the “Over 30%” value.
Examples of retesting a broken level
A fresh example of GBPUSD, which happened on March 4, 2016. From this example it is clear that after holding the 1.4090 level for quite a long time, the price was still able to break through the zone and go higher.
The next day, you could take a retest (pullback) of the broken level and open a Buy position.
USDJPY pair, daily. I repeat once again, consider the day’s work and see how accurate it is. After the 120.78 mark has been held for 6 trading days, the price is broken through and a day later a retest (pullback) is made almost point by point.
And again a fresh example. AUDUSD dated March 03, 2016, 5 minutes. For several hours, the level of 0.7320 is held, but it is still broken through. After some time, a return to the broken area (retest) occurs and the price flies up.
The above examples show that a retest works on any timeframe and any instrument; the main thing here is to recognize and correctly mark the currently important zone in time and not to rush, but wait for the retest, and then enter the game.
Examples
Let's look at the most recent case of short squeeze in Russia.
Shares of the well-known airline company soared by 13% in the spring of 2022 and fell by almost 10% a few hours later. During the crisis and against the backdrop of the announcement of the absence of many air services, it is unlikely that anyone would want to buy them.
Another example of early 2022. Tesla shares rose in price by 20% in just one day and fell just as rapidly the next day. The only good news is the report for the 4th quarter of last year. Plus the forecasts of well-known analysts, and the short squeeze process has begun.
Level retest assessment
The behavior of the Forex market cannot be predicted 100% and not all level breakouts are processed. Sometimes, after abandoning the chart for support or resistance, it is not necessary to test the level on the reverse side, but to cancel the breakout signal.
Example of a false breakout
If in this situation you enter directly at the moment when the retest occurs, without confirmation, there is a high probability of a stop being triggered. The moment of touching the level on the opposite side after the breakout is not in itself a basis for concluding a deal.
Reliability is important in trading, so we recommend filtering all retests. Any RA reversal pattern or simply analysis of the configuration of the candle where the broken support or resistance was touched will be suitable for this.
Situation without a reversal pattern at retest, but a good signal was received
This retest is confirmed by the pin bar, which gives priority to long positions. You could buy at the close of the pin bar
Here we are dealing with bearish engulfing. The chart hovered around the broken support, and it was after absorption that the downward movement continued
It is enough to have basic candlestick analysis skills and know typical RA patterns in order to filter false breakouts.
We also recommend taking into account the nature of the chart movement before the level is broken, at the time of its break and during the retest. Ideally, events develop like this:
- there is a confident movement;
- the breakdown occurs during a strong movement; at this time we observe growth on the volume indicator;
- then the breakout impulse subsides and a small rollback begins. As part of the correction, there are no sharp movements; an attempt is made to return to the area before the breakdown of support or resistance;
- when this attempt fails, the retest is considered to have been generated. This scheme is valid not only for Forex, but also for other markets.
If after the breakout sudden movements begin, jerks in both directions, it is better to refrain from trading
Such movements are normal
In trading, all of the listed techniques are taken into account to assess the quality of a retest. To the methods already mentioned, you can add Fibonacci levels, indicators and other analytical tools.
Wrong expectation of retest
According to statistics collected by traders, a retest happens in 80% of cases. But, if everything were so simple, of course, there would be many more millionaires in the world. What is there to invent here, I saw a significant zone, waited for the breakdown, and at the retest, go in and get your profit.
Behind all this simplicity lies danger. Here are a few points that I want to focus your attention on.
- Traders mistakenly select important price zones and wait for a retest where it cannot happen in principle.
- Statistics suggest that in 80% of cases, the retest will work, but 20% remain, which means there is a possibility of a negative outcome. Traders forget about this and work without stops or, due to their overconfidence, set stops that are too far.
- Don’t forget about false breakouts, I talked about them here. The price zone must be broken through and consolidate below/above it, otherwise there is a high probability of running into a false breakout, as shown in the figure below.
How to trade short squeeze
How to use short squeeze to your advantage and what is it for a trader? This is a great opportunity to make money, the main thing is to identify it in time. Study and analyze the market, assess the risks. Keep track of company news. There are two options:
- Trade bullishly at a reversal of a downtrend. Once you understand that there are a lot of short positions and they will be closed, buy and sell at the peak. This is the fastest way to make a profit
- Trade down against common sense. If you are sure that this is a short squeeze and there will be a rollback.
It is more profitable and faster to trade short squeeze on an increase, because quotes grow at high speeds in a short time.
Short briefcase
Despite the unique risks of short selling, there are good reasons to maintain a short portfolio:
- You can sleep better. Owning some short positions combined with your long portfolio can be a good hedge. Your “short portfolio” can act as a hedge against market turns.
- Holding a short portfolio may allow you to take on more risk in your long portfolio.
- Shorting stocks is fun and exciting. You can get great satisfaction from taking a position contrary to other investors and being rewarded for seeing the truth when most investors were blind.
- Shorting stocks can help you with your overall investment approach. As a result of your research into short positions, you may begin to view your long positions with a healthier, skeptical eye.
- Last but not least, if you work hard at it and have discipline, shorting stocks can be a very profitable endeavor.
How to make trades on a level retest
It is preferable to work with pending orders. The options are as follows:
- place a pending stop order at the broken level in the expectation that the chart will touch it and continue moving in the direction of the breakout. The most risky option is that the trader does not know how the chart will behave when the level is touched; he can get an unreasonable losing trade. In trading we rely on reliability; it is better not to use this method;
The Sell Limit order was placed immediately after the support was broken. The retest took place, the order was triggered, but the downward movement did not continue
- a safer option is to place a Sell Stop or Buy Stop order when testing broken support and resistance, respectively. Orders are placed for the Low or High of the candle on which the retest took place. Situations when the chart reverses instead of retesting and continuing the movement are automatically filtered. On the other hand, if you do not reach the broken level, you will not receive an entry point;
The Buy Stop was placed behind the High candle, which confirmed the retest. Place a stop order with a small margin (for Forex – spread + a couple of points for insurance)
- After completing the retest, you can wait for confirmation - that is, the next candle must correspond to the expected direction of movement. The entry point is reliable, but the stop to take profit ratio is deteriorating. If you take a retest using this scheme, be sure to calculate the ratio of the stop to the potential profit. We work with stop orders, as in the previous case.
Example of an entry with a confirmation candle after a retest
As for take profit, it is determined by the nearest levels. The stop can be placed beyond the opposite extreme of the candle where the broken level was tested, or beyond the nearest local extreme on the chart. If you enter on a sharp movement, you can focus on Fibo levels.
What is the reason for the strong price increase when short sellers close their positions?
The fact is that to close a short you need to buy (buy back) your position. As a result, when shorts are closed, a huge number of purchases are obtained, and the market reacts to this process instantly. There is a sharp jump, followed by an equally sharp decrease, and the final price, depending on the situation, may even be lower than the opening level of the trading session. The reason for this is the lack of a real buyer and the throwing out of the “crowd” of short sellers from the market. This is exactly how a market reversal can occur before a sharp collapse in quotes. This process is called short squeeze.
The reason for the occurrence of a short squeeze is usually unclear - a sharp increase can occur either due to a major positive news event or in its absence. Short players are not very welcome among the big players. There are situations when players, one might say, are driven into a corner. Large market participants are actively buying securities, thus forcing short sellers to close their positions. By and large, such actions are prohibited, but nevertheless they occur quite often - it is extremely difficult to prove such manipulation. Thus, a short squeeze gives large players the opportunity to sell shares at the peak of value and make a big profit. It’s not for nothing that short sellers are called “fuel for the market.”
A very recent example of short squeeze was observed in MMK shares on November 30. On this day, large index funds rebalanced their portfolios after changes in the structure of the MSCI Russia index came into force. As you know, MMK shares were excluded from the index and funds are required to sell them on the day of rebalancing. However, this news was so obvious and understandable that traders massively shorted MMK shares in advance. But that was not the case: those who wanted to earn “easy money” were “kicked out” of the market and the shares went to their peak without them (Fig. 2).
Rice. 2. Short squeeze in MMK shares
Bitcoin short squeeze 04/02/2019
On April 2, Bitcoin broke through an important resistance level – $4,200. A short squeeze occurred on the main trading floors, which intensified the upward movement of the main cryptocurrency to $4,849. Technical indicators changed. Following BTC, Ethereum and XRP rose in price by 6%. Trading volumes increased by 50% and increased to 48 billion.
Within a few hours, the price of Bitcoin increased by 15%, then it rolled back to $4,652.
The April short squeeze on the yearly BTC chart looks like this:
So, the breakout of $4,200 ended a downward trend that lasted 16 months. Short squeeze on exchanges fueled a further increase in BTC prices. Experts cited various reasons for the jump, including:
- positive news that stimulated investors;
- large injections from Asian funds near a significant price level, purchases stimulated exit from short positions.