- Robert Prechter
- Fractals or impulse waves
- Wave 1
- Wave 2
- Wave 3
- Wave 4
- Wave 5
- Extended Pulse Waves
- Corrective waves
- Types of correction waves
- Zig Zag
- Outset
- Triangles
- Fractal structure
- Elliott wave labeling
- 3 main rules of Elliott waves
- 3 practical tips
- Elliott waves on a live chart
- The sea is agitated once
- The sea is worried two
- These complex Elliott waves
The market always moves in waves, which is obvious. It is not surprising that for decades traders have been trying to find special market patterns that would help predict the development of wave structures. Various systems were created where a theoretical and practical basis was provided for the waves. And perhaps the most popular theory in this regard is called “Elliott Waves”.
Ralph Nelson Elliott was, in fact, a professional accountant. He clearly had a lot of time to analyze graphs over several decades, so he outlined all his observations in a tiny book, “The Wave Principle,” which was published back in 1938. According to Elliott, everything in human civilization is in a certain rhythmic order, so this rhythm, these wave amplitudes can be “extended” into the future, which allows us to predict financial markets.
It must be said that Elliott’s theory seemed interesting to few people during his lifetime. Just think, another crazy idea in a cheap little page book. Elliott passed away in 1948 and was immediately forgotten. His theory was used by literally several stock market specialists. It was only thanks to Charles Collins that these waves were even remembered on Wall Street. They were then popularized by Hamilton Bolton in 1950-1960, publishing a book with detailed descriptions and practice of use.
Bolton introduced Alfred John Frost to the waves, who actively commented on them in the 1980s. Frost worked hard to popularize this theory. All these years, no one really needed her. So... a niche instrument, one of thousands.
Robert Prechter
Of course, Robert Prechter did the most work here. It was thanks to him, when he took up the banner from Frost, that Elliott waves gained widespread popularity, almost 50 years after the accountant Elliott wrote a book on them.
Many technical systems have a similar fate. They are forgotten, not appreciated during their lifetime, and then suddenly they become popular when they are promoted by a fanatical follower. To this day, Prechter is considered the leading expert on Elliott waves, and his website elliottwave.com is the world's premier resource on this topic. There are a lot of cool forecasts, for example, experts from Prechter’s website predicted the 2008 crisis without any problems several years before it appeared. In fact, the modern Elliott is Prechter and his school.
It is the books of Robert Prechter (including those co-authored with Frost) that need to be read to understand this topic.
Elliott waves, at their core, have a fractal basis and the task of their practitioner is to decompose the waves into understandable elements. We will look at them now.
What is Wave Analysis in simple words
Wave Analysis Theory
developed by American accountant and financier
Ralph
Nelson Elliott
in the 1930s. He outlined the main points in a book that was published in 1938. The main idea is that the behavior of market participants can be described by a simple, easily recognizable model. Graphically, it is depicted as a wave - first there is a price impulse, followed by an opposite movement (correction).
Very expensive advertising - Continue reading below
Based on this, we can give a definition: wave market analysis is a method of predicting the price movements of different assets (currency, shares and others) based on the same models.
In simple words, wave analysis is a way to determine the current market situation (which stage the wave is going through). After determining the location, the trader makes more accurate predictions of the upcoming chart movement, which significantly increases the likelihood of making a profit.
Fractals or impulse waves
According to Elliott, the market is moving in a wave pattern called 5-3.
- Impulse wave pattern - first 5 waves.
- Corrective waves - the last 3 waves.
At the same time, waves 1, 3 and 5 are the main ones; they follow the trend. And waves 2 and 4 are corrective.
This is what a typical 5 wave impulse pattern looks like:
It’s not very clear, let’s color it:
This way you can see each wave much better. Now a brief description of them. Elliott himself saw in the waves, first of all, the emotional and psychological state of traders.
Wave 1
The first impulse is upward. As a rule, this is the first emotional message of people who have decided that the time has come to buy an asset. The price starts to rise.
Wave 2
Here the people decided that wave 1 was over and were exiting the deal. As a result, the price goes down, because buyers all flocked to celebrate. However, the price does not update the lower lows and turns around before reaching them.
Wave 3
Usually the strongest and “longest lasting” wave. Here the main crowd of traders paid attention to the price. Well, you understand: Vasya told Petya, Petya told Kolya, and now everyone rushes to buy, and the wave runs up.
Wave 4
Those who purchased earlier are coming out again, however, the wave is not particularly receding, since a lot of people are waiting for further growth.
Wave 5
And this is already the peak of the trend. All the smart ones have already left, and the price is controlled purely by emotions and the belief that the trend will last forever. In fact, he only has a short time to live.
Extended Pulse Waves
Strictly speaking, all three impulse waves are always “extended”, since one such wave is always longer than the others, regardless of their angle of inclination. Elliott argued that the extended wave is always the 5th. However, over time, the 3rd began to be considered as such. In general, this is a useless debate, the main thing is how to use it all.
Understanding Price Action
Before we get into the mechanics of Elliott Wave Theory, we need to review some basic price action. There are three main types of Price Action phases on every Forex chart. This:
Impulse Wave (trend movement)
This is a movement in the direction of the trend. Typically, trend movements are larger in terms of price change and take less time. This makes trend analysis very attractive for trading.
Movement in the direction of the general trend is called Impulse Waves.
Corrective wave (correction)
A corrective movement involves price behavior that is contrary to impulse movements. Corrective moves are smaller in terms of price change and generally take longer to develop. This is why they are not so attractive for trading as an impulse movement.
If the trend is bullish, then the trend correction will be in a bearish direction. If the trend is bearish, then its corresponding correction will be bullish.
Price consolidation
This is the price phase when there are no visible trends. In most cases, consolidation is associated with fluctuations or sideways movement of the price. However, sometimes corrections can take different forms that illustrate specific chart patterns. These models can sometimes help us predict future price changes.
Corrective waves
Then the fun begins. After the 5-wave impulse structure there is a 3-wave pullback. To avoid confusion, letters are used to designate these waves - a, b, c, etc.
And here is the opposite example, for a downward trend:
Trading strategy with Fibo levels
Fibonacci levels are often used to confirm entry points or to set stop losses and take profits. For example, let's consider a trading strategy with Fibo levels, as well as a moving average and MACD.
First, you need to plot the trend indicator and oscillator on the chart. MA period is 10, MACD settings are standard.
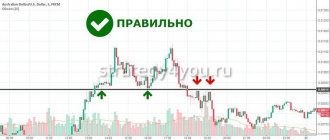
Further trading is carried out according to the following algorithm (using the example of opening a sell position):
- The price crosses the moving average from top to bottom.
- The MACD histogram crosses the line in the same direction.
- According to the last obvious trend wave, the Fibonacci grid is stretched. If the moment the price crosses the moving average coincides with a rebound from the level or its breakdown in the desired direction, a sell trade is opened.
- Take profit can be set at one of the following Fibo levels. Stop loss – at the previous one, or several points from the local study.
This strategy is suitable for trading all liquid Forex pairs. Optimal timeframes – H1-D1.
Types of correction waves
Elliott described 21 ABC type correction patterns. Before you grab your head, let us reassure you that you don’t need to memorize them at all, since they are all extremely primitive and consist of only three models.
- Zig Zag.
- Outset.
- Triangle.
Zig Zag
As you can see, this is a very inclined price drop against the main trend. In this case, wave b is usually the shortest. Such waves occur 2-3 times during correction. Like all other waves, each wave in a zig-zag can be decomposed, in turn, into a 5-wave structure.
Outset
These are correctional waves that go in the side channel. In this case, the wavelengths are usually identical, although wave B will sometimes be longer than A.
Triangles
A very familiar situation, because figures in technical analysis
we have already studied.
A triangle is a corrective pattern between trend lines, consisting of 5 waves that go against the trend in a sloping sideways channel.
Trading using Fibonacci levels
Fibonacci levels (lines) are used for trading both as part of strategies and as self-sufficient tools. One of the easiest ways to open a trade at Fibo levels is to place a pending order for a breakout of level 100 after the correction.
To do this, you need to stretch the Fibonacci grid after the formation of a trend wave from the extremum-end point to the extremum-beginning of the impulse.
After this, a breakout order is placed below/above the level of 100. Take profit can be set in advance a little closer to the level of 161.8. Stop loss can be set either at the same distance from the 100 level as the pending order (cautious option), or around the 61.8 level (aggressive tactics).
When setting a stop loss at 61.8, the risk/reward ratio turns out to be approximately 1:1.5, with a more cautious stop loss - approximately 1:5.
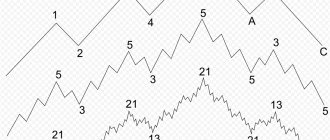
Fractal structure
All Elliott waves are fractals; inside each wave there are other waves hidden. And you yourself know this from the lesson Multiframe Analysis . Once you switch to lower timeframes, any trend immediately breaks down into many microtrends.
As we can see, waves 1, 3 and 5 consist of small 5-wave structures, just as waves 2 and 4 include 3-wave corrective structures.
Any older wave includes younger ones, this is the main essence of the theory. How to understand this unrealistic number of waves?
Just divide them by type:
- main cycle (secular);
- supercycle (40-70 years);
- cycle (several years);
- primary level (several months - years);
- intermediate level (several weeks - months);
- secondary level (weeks);
- minute level (days);
- small level (clock);
- ultra-low level (minutes).
All these waves are nested one within the other. The main cycle includes supercycles, those are cycles, those are primary levels, those are intermediate levels, and so on, down to the ultra-small level.
Elliott wave labeling
In order not to get confused in this number of different waves, they are marked with different numbers. There are several options for these markings, followed by Prechter’s option as one of the most popular.
- Main: [I] [II] [III] [IV] [V], against the trend [A] [B] [C].
- Supercycle: (I) (II) (III) (IV) (V), against the trend (A) (B) (C).
- Cycle: I II III IV V, against the trend AB C.
- Primary: I II III IV V, against the trend AB C.
- Intermediate: [1] [2] [3] [4] [5], against the trend [c].
- Secondary: (1) (2) (3) (4) (5), against the trend (a) (b).
- Minute: 1 2 3 4 5, against trend ab c.
- Small: 1 2 3 4 5, against the trend abc.
This is what all this disgrace looks like if the main waves are plotted on a chart.
For an uptrend:
For a downtrend:
The fractal structure and which waves each wave is located in are immediately visible. Any impulse large wave is divided into 5 small waves, and a corrective wave is divided into three small corrective waves. Eternal matryoshka.
Setting and configuring Fibonacci levels
On the Meta Trader 4 trading platform, Fibo levels can be set on the chart in two ways:
In the main menu of the terminal, select the “Insert” tab, and in it – “Fibonacci”. There will be 5 out of 6 Fibo tools in this category, the Fibonacci channel is in the “Channels” category.
You can also select the desired tool directly from the quick access panel at the top of the terminal. By default, only Fibonacci lines are available in this panel; other tools can be added by right-clicking on it and selecting “Customize”. In the window that opens, you can select all the tools, which will then be added to quick access.
You can make additional settings to each of the instruments after plotting it on the chart. In addition to changing the color, you can adjust the parameters of the source points, as well as add additional levels.
Basic provisions
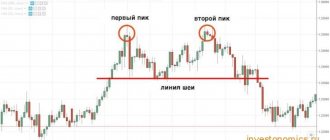
Indexes (prices) take everything into account. According to the Dow theory, any factor that can, in one way or another, affect supply or demand will invariably be reflected in the dynamics of the index (price). There are three types of trends in the market. The Dow's definition of trends is as follows: In an uptrend (called a bull trend), each subsequent peak and each subsequent decline is higher than the previous one. In other words, a bullish trend should have an outline of a curve with successively increasing peaks and troughs. Accordingly, with a downward trend (the so-called bearish), each subsequent peak and decline will be lower than the previous one. The third type of trends includes the so-called horizontal position - Range, when subsequent peaks and declines are at the same levels. This definition of trend is fundamental and serves as the starting point for trend analysis. Dow identified three categories of trends: primary, secondary and minor.
He attached the greatest importance to the primary, or main trend, which lasts more than a year, and sometimes several years. The secondary, or intermediate, trend is corrective to the primary trend and usually lasts from three weeks to three months. Such intermediate adjustments amount to 1/3 to 2/3 (very often half or 50%) of the distance prices traveled during the previous trend. Minor or short-term trends last no more than three weeks and represent short-term fluctuations within an intermediate trend.
Typically, the development of a major trend can be divided into three phases. Phase one, or accumulation phase, when the most far-sighted and informed investors begin to buy, since all unfavorable economic information has already been taken into account by the market. The second phase occurs when those who use technical methods of following trends come into play. Prices are already rising rapidly and economic information is becoming increasingly optimistic. The trend enters its third or final phase when the general public gets involved and the market begins to frenzy, fueled by the media.
The indexes must confirm each other. Dow believed that any important signal for an increase or decrease in the market rate must pass through the values of several indexes. The trading volume should confirm the nature of the trend. Dow considered trading volume to be an extremely important factor in confirming signals received from price charts, that is, volume should increase in the direction of the main trend.
A trend continues until it gives clear signals that it has changed. This means that the trend that started the movement will tend to continue it. Identifying trend reversal signals is not easy. But analyzing support and resistance levels, price patterns, trend lines, moving averages - all of this, among other technical tools, will help you understand that there is a turning point in the dynamics of the existing trend. For those who use the Dow Theory, or indeed any other trend-following method, the most difficult task is to distinguish the usual intermediate correction to an existing trend from the first leg of a new trend in the opposite direction.
Dow theory
The first mention of the possibility of predicting future price movements based on the results of previous trading appeared at the end of the 19th century in the Wall Street Journal. This was a note by the already well-known Charles Dow, the creator of the now popular Dow Jones index. The theory created by Dow still exists today and is called the “Dow Theory.” The method developed and improved until the 70s of the 20th century. With the advent of computers, it became easier not only to count, but also to display calculations graphically. Stemming directly and indirectly from the Dow theory, technical analysis has incorporated such principles and concepts of this theory as “directional nature of price movements”, “prices take into account all known information”, “confirmation” and “divergence”, “volume as a mirror of price changes " and "support/resistance". And the widely used Dow Jones Industrial Average is a direct descendant of the Dow Theory.
Price forecasting in technical analysis is based on the performance of previous trades. Of these trading indicators, two are of greatest interest.
- The first is asset prices. The prices are clear, their values are easy to find for a private trader. This makes the price indicator the most important to work with.
- The second is trading volume, that is, the total number of transactions carried out during the time period of interest, expressed in any currency. These values are more difficult to find, but possible.
The theory of technical analysis is based on these whales - price, trading volume. Like any theory, it has its postulates.
The three main ones are as follows:
- Asset price movements take into account all factors. This means that the price is sensitive to all external factors, be it a statement by the American president, information about the inflation rate in Mexico or a hurricane in California. According to the Dow Theory, any factor that can affect supply or demand will invariably be reflected in the dynamics of the index (price). Of course, earthquakes and tsunamis are unpredictable, but they are also instantly taken into account by the market and are reflected in price dynamics.
- Prices move directionally. This means that price movements are not chaotic, but follow a certain direction. This direction is called a trend. There are three types of trends: bullish (upward movement), bearish (downward movement) and sideways (there is no decrease or increase in the exchange rate).
- History repeats itself. “The key to understanding the future lies in studying the past.” The fact that certain configurations on price charts tend to appear consistently and repeatedly, in different markets and on different time scales, is a consequence of the action of certain behavioral stereotypes inherent in the human psyche.
There are three different approaches to analyzing graphs.
The first is superficial, subjective. It is based mainly on intuition. This is the usual “poke method”. It requires neither strict analysis nor justification, so most traders work at this simplest level. Unfortunately, for the sake of simplicity and convenience, they sacrifice logic.
The second approach involves creating market indicators that help determine oversold and overbought conditions in the market. Although many traders use at least some of this type of analysis, they tend to limit themselves to only the most well-known indicators and adhere to generally accepted ways of interpreting them. There is no creativity in this type of work. Such traders do not try to create their own indicators or improve existing ones. In addition, they often associate exaggerated expectations with fashionable indicators and do not notice their shortcomings.
The most effective and valuable is the third approach - the development of trading systems capable of generating buy and sell signals. However, not all analysts have a sufficient level of education, experience and desire to constantly hone their skills.
Time Zone Modifications
In addition to the classic Fibo Time Zones, there are also modifications that radically change the principle of calculating the position of zone boundaries. They are based on classic Fibo ratios - 0.382, 0.500, 0.618 and others. The Zigzag indicator is also used in the constructions; it is used to identify movements, according to which modified zones are constructed.
TradingView has indicators for constructing such Time Zones. The calculation principle is as follows:
- Using a modified zigzag, the last 2 waves are determined; they indicate significant movements.
- The length in candles of the first wave is measured.
- Next, a distance equal to the length of the first wave is laid off from the end of the second wave, this is point 1. A vertical line is constructed through the resulting point, the end of the second wave is point 0. We obtain a segment 0-1.
- Taking into account the classic Fibo ratios, the rest of the marking is built. Due to this, we obtain a family of vertical levels.
The grid is denser compared to standard Fibo Time Zones. As for efficiency, there are no significant improvements - a significant part of the formations still does not work out.
The only clear advantage of this approach is the absence of a subjective factor. The constructions will look the same for everyone, the recommendations for use in trading are the same as for classic Fibo Time Zones.