The importance of classic continuation and trend reversal patterns cannot be overestimated. For a real trader trading on the Forex market, it is huge, since it is these figures that make it possible to predict the general further movement of quotes.
If one of the trend continuation figures , this means that a normal correction (rollback) is occurring. After its completion, it becomes possible to profitably enter the market at the existing rate.
A trend reversal pattern means that a currency pair (or any other financial instrument) is already at its peak, which is sure to be followed by a reversal. In the future, the price will move in the opposite direction, in which transactions should be made.
Thus, when a trend continuation figure appears, it is necessary to open orders in the direction of the old trend, and when a reversal figure appears, orders must be opened against it along the new trend.
Complexities of simple analysis
At first glance, everything is very simple. It seems that a trader just needs to remember what the patterns look like, then carefully monitor the charts so that when these patterns or models (also called technical analysis patterns) appear, he can make purchases or sales.
However, there is no need to rush to conclusions. Let's open any H4 chart and look at it carefully. We will certainly notice on it:
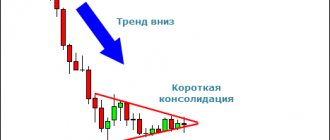
- Trend continuation figure. Here it would be worth waiting for the end of the correction and opening a deal in the old direction of price movement in order to earn, say, a hundred or two points.
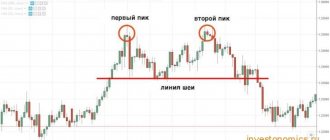
- A trend reversal pattern that forms at an upper or lower peak. Again, we know what to do - open an order against the old trend and earn several hundred points.
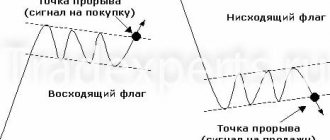
- In a new trend, corrections are sure to form, which look like course continuation patterns. We do the same as in point 1.
And all these actions can be performed ad infinitum, steadily increasing your capital. Isn't it too simple? If the analysis came down to just knowing what a particular figure looks like, it is unlikely that 19 out of 20 traders would lose their deposits. The MasterForex-V Academy names three reasons why, in order to create its own trading system, MF had to argue with the statements of the classics of technical analysis:
- The classics of technical analysis describe ALL trend continuation and reversal patterns so UNCLEARLY that a trader can see them only AFTER the end of the movement, and not at the beginning, as he needs.
For example, Eric Nyman, at the end of his description of a dozen patterns, makes a rather cynical conclusion:“Don’t look for trendy figures where they don’t exist. Don't make things up. No one doubts the abilities of your imagination.”
This is how it is necessary to set out the CRITERIA of these patterns so that the trader (the person interested) does not see them where these figures exist and, on the contrary, “invents” them where there is no trace of them. Imagine that in geometry, a triangle and a square were described in such a way that they could not be distinguished from each other. In Forex theory as it exists now, this is commonplace.
- All classics, except A. Elder, consider figures on ONE graph, in one dimension.
But there are many time frames - from minute to monthly. More precise periods are always components of larger ones. And everywhere you can see DIFFERENT patterns. The question arises: what position should a trader open, short or long, if he sees a reversal figure on M15, a trend continuation on H1, and a triangle on D1? And how long will it take a trader to find the correct answer, then confirmation points, points for opening and closing transactions, setting a stop or lock? The average bidder has to deal with such situations all the time. - None of the Forex classics tries to synthesize trend continuation and trend reversal patterns with other technical analysis tools:
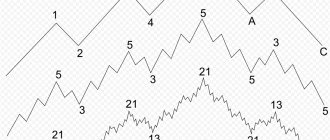
- Elliott waves (a trend reversal pattern is the end of wave 5, a trend continuation pattern is one of the corrective waves, etc.);
- inclined channels;
- levels of resistance and support;
- movement of allied currency pairs;
- Fibonacci levels, etc.
It is logical that the CORRECT methods of market analysis should give the same results. The creators of the MasterForex-V trading system proceeded from this.
However, all the classic continuation and reversal patterns outlined by John J. Murphy, Alexander Elder, Schwager, E. Nyman and others migrate from one textbook on Forex technical analysis to another.
Classic trend reversal patterns:
- Head and shoulders.
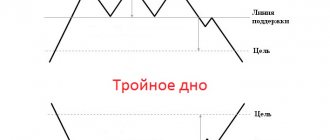
- Triple tops and bottoms.
- Double tops and bottoms.
- V-shaped top and base (sometimes also called a “spike”).
- Rounded pattern or saucer.
- Diamond is a diamond.
Classic trend continuation patterns:
- triangle;
- flag;
- pennant;
- wedge;
- rectangle.
Let's try to look at the well-known trend reversal patterns from a different angle. We will try to find internal contradictions in them (causing traders’ mistakes), by resolving which we can learn to determine:
- the end of the movement along the OLD trend;
- the beginning of a NEW trend.
Level breakdown
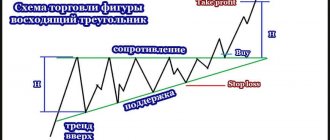
The obvious and most primitive way to determine a change in trend direction is a breakdown of the support or resistance level. As a trend develops, local extrema are formed, along which trend lines can be drawn, which are resistance and support. A breakdown of the support line in a bullish trend is a strong signal of a change in direction; in a bearish trend, the resistance level should similarly be broken.
The breakdown cannot be completely trusted due to its probable falsity. In such situations, the trend line is corrected, and it is still better to close open positions, because the subsequent strength of the trend is unknown: it can be very significant, which can lead to losses.
Head and shoulders reversal pattern
As an example, you can bring the drawings of John J. Murphy from the book “Technical Analysis of Futures Markets: Theory and Practice” (see Library of the MasterForex-V Trading Academy - https://dma.masterforex-v.org).
Rice. 1. Head and shoulders reversal pattern
John J. Murphy describes the head and shoulders figure this way:
“An example of a head and shoulders pattern for a market top. The left and right shoulders (A and E) are approximately at the same height. The head (C) is higher than each of the shoulders. Please note that each subsequent peak is accompanied by a decrease in trading volume. The pattern is considered complete when the closing price is fixed below the neck line (line 2). The minimum price target is equal to the vertical distance from the head to the neckline, laid down from the breakout point of the neckline. With a subsequent rise, a return to the neckline is possible, but prices fail to cross it.”
The inverted head and shoulders pattern is a mirror image of the one shown above. It indicates a change from a bearish trend to a bullish one.
A. Elder in his book “How to Play and Win on the Stock Exchange” (see Library of the MasterForex-V Trading Academy https://dma.masterforex-v.org) defines the following rules for working with this pattern:
- Sell when you see a head or right shoulder when volume drops, trend line crosses, and divergence between technical indicators and prices.
- The decline after the “head” forms the “neck” line. If you are still holding the position, place the guards below the throat line.
- A rise in the right shoulder is usually characterized by low volume and indicators of market weakness on technical indicators. It provides the last real opportunity to exit an uptrend with a profit. In the right shoulder, technical indicators often reach higher values than in the head, but they never exceed the maximum values reached in the left shoulder. If you are selling in the right shoulder, then place a stop at the top of the head. Make this order a "Stop-and-Reverse" order. If the order is executed, the position is closed and reopened in the opposite direction (see the Hound of the Baskervilles signal).
- Once the throat line is crossed, a low volume pullback provides an excellent opportunity to sell with precautions just above the throat line.
We can find the disadvantages of such a description of the head and shoulders reversal pattern in Eric Nyman (Nyman E.-L. Small Encyclopedia of the Trader: see Library of the MasterForex-V Trading Academy https://dma.masterforex-v.org). Nyman states:
- “Unfortunately, by the time you finally become convinced that the price movement you saw does fit into the classic head-and-shoulders pattern, the significant price movement in that price has already completed.”
Naiman reassures traders who missed the moment to enter the market in a rather original way:
“However, in doing so, you received a very valuable conclusion regarding the direction of the new trend. Let the price dynamics now be much calmer, but you know the direction of the trend and are more or less confident in your position.”
- “For a given figure, there is a danger of wanting to see it much more often than it actually exists. To prevent this from happening, be sure to check your conclusion on the figure using volume indicators,”
- continues E. Naiman.E. Naiman.
So, the losses of Forex traders on the head and shoulders reversal pattern in most cases are due to the fault of the classics of technical analysis, who described it as follows:
- You can open a trade only when a significant part of the movement in the new (reverse) direction of the trend has already been completed.
- There is NO volume indicator on the Forex bookmaker market. Therefore, there is no main filter, which, according to the logic of Murphy, Elder, Schwager and Nyman, separates the TRUE reversal (“head and shoulders”) from the FALSE unconfirmed reversal.
- Eric Nyman’s “reassurance” that, having missed a significant movement in the opposite direction, the trader will finally see a NEW trend, is also very controversial and often erroneous, since:
- a head and shoulders reversal could be the end of the 5th wave of the trend (then Eric Nyman is right);
- A head and shoulders reversal can be the end of the 1st and 3rd waves of a trend, after which traders - readers of Nyman's books - will have a stop loss triggered or the entire deposit will be lost. And Eric Nyman will soothe his conscience with a phrase that fully characterizes his lack of understanding of these things: Don’t look for trendy figures where they don’t exist...
- Alexander Elder introduced a new trend CONTINUATION figure - the “Hound of the Baskervilles” as a failed “head and shoulders” pattern in the case when the currency, with all the signs of pattern formation, breaks through the top of the “head”, and thereby the “head and shoulders” pattern is canceled, and the previous trend continues.
Oscillator signals
Many traders widely use oscillators to identify overbought and oversold zones in order to open or close a position. Oscillators provide additional confirmation to signals received from other sources.
Another interesting property is the determination of a possible trend reversal. To do this, you will need to compare the price chart and the oscillator, connecting local extremes. The resulting discrepancy between the direction of price movement and the indicator movements is a signal for a trend reversal.
The situation when the resulting lines diverge is called divergence, and when they converge, it is called convergence. This leads, as a rule, to price adjustments and the market entering a flat state or generally changing the trend in the direction of the indicator movement. Like any other technical analysis signals, divergence and convergence should be confirmed using other tools to ensure greater reliability.
Is the Head and Shoulders trend reversal pattern obsolete? Examples of Masterforex-V.
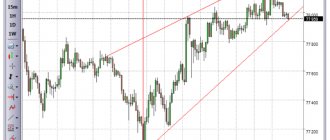
I can give hundreds of examples where very strong trend reversals occurred without Head and Shoulders. For example, look at chart d1 EURNZD. Are you seeing Head and Shoulders or Diamond/Diamond? No and again no, although the previous peak was broken and “should have” (I wonder who they “should”?) according to Alexander Elder, Eric Nayman and others, be one of these figures of the Forex and stock market.
Rice. 2. Chart d1 EURNZD
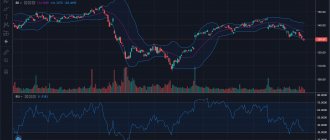
Or on chart h4 AUDUSD changes the trend from bearish to bullish. Have you seen Inverted Head and Shoulders? Yes, she’s not there...
Rice. 3. Chart n4 AUDUSD
Another example is the change from a bearish trend to a bullish one for USDJPY. Do you see the upside down Head and Shoulders? Me not. The divergence of AO Zotik indicating a reversal is there, but “Head and Shoulders” is not and did not exist at that moment.
Rice. 4. Example of a change from a bearish trend to a bullish one for USDJPY
I repeat, on the closed forum of the MF Academy you can count hundreds (!!) of examples when trend reversals occurred without “Head and Shoulders” and I think in the future there will be more and more such reversals.
How are trend reversals detected in the Masterforex-V TS? Look closely at the graphs. Eat
- strong levels of accumulation of MF orders;
- JSC Zotika;
- NK MF, USS and other 30 proprietary instruments, the intersection of 5 of which shows a buy or sell signal. Accordingly, we don’t care whether “Head and Shoulders” appears as a result or not. It’s just that the “market” has already “taken into account” this “trading” trend reversal figure, which is why it makes STRONG reversals without it.
By the way, Alexander Elder also intuitively understood this, who introduced a new trend CONTINUATION figure - the “Hound of the Baskervilles” as a failed “head and shoulders” pattern in the case when the currency, with all the signs of pattern formation, breaks through the top of the “head”, and thereby the pattern “head and shoulders” is canceled, and the previous trend continues.
Candlestick pattern indicators
Special indicators have been developed to automatically search for candlestick patterns on the chart. Such tools greatly facilitate the trader’s work, especially at first, when the user has not yet had time to study all the basic patterns of candlestick analysis.
The best indicator of candlestick patterns CandleStick Patterns
This tool is one of the most popular and is capable of identifying more than thirty different candlestick formations. The list of patterns it can find includes Doji, Bullish and Bearish Engulfing, Shooting Star, Triangle and many others.
The CandleStick patterns indicator will be especially useful for novice traders. In order not to get confused in all the variety of shapes, in the tool settings you can activate the display of only those patterns that you need.
The tool is equipped with an alert function, so it sounds a sound signal immediately when the desired figure is detected on the chart. In this case, the indicator signs the pattern, points to it with an arrow and informs the trader which trade should be opened - sell or buy. This is a very convenient and easy to use tool.
"Pattern Options" indicator
The “Pattern Options” tool is designed to search and highlight candlestick patterns on the working chart. Its peculiarity is that you can initially configure the algorithm so that it will show only strong or weak reversal or trend continuation patterns. Classification can also be disabled. In this case, the tool will show the shapes that you specify in the input parameters settings.
Just like the previous tool, Pattern Options is equipped with an alert. Next to the found pattern, the tool draws an arrow in the form of a pointer. The direction of the arrow corresponds to the type of trade that should be opened:
- Down arrow is a sell signal.
- Up arrow is a buy signal.
In addition, the tool signs each formation found.
Candlestick patterns and their signals are the basis of candlestick market analysis. Every trader should know and be able to find basic trend reversal and trend continuation patterns on a chart. This will greatly facilitate further work with the foreign exchange market, because candlestick patterns, unlike various technical indicators, never lag behind the market and always give leading signals. Knowing how to use them in your trading strategies will allow you to always be one step ahead of those who do not take candlestick formations into account in their trading.
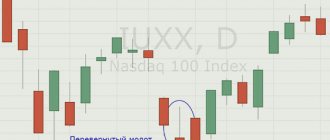
Model “Hound of the Baskervilles” - o
Alexander Elder wrote in the book “Basics of Stock Trading”:
“The signal is named after the Arthur Conan Doyle story in which Sherlock Holmes found a clue when he noticed that the family's dog was not barking at the time of the murder. This meant that the dog knew the killer, and therefore it was a family matter. The signal was the lack of action - the absence of the expected bark! When the market refuses to bark after a completely benign signal, it gives you the Hound of the Baskervilles. If the market refuses to turn and continues to strive upward, then this gives the “Hound of the Baskervilles” signal.
Rice. 5. Model “Hound of the Baskervilles”
Head and shoulders model in the MasterForex-V trading system
A detailed study of the head and shoulders reversal pattern (“inverted head and shoulders”) is offered by the MasterForex-V Trading Academy.
For those who cannot complete online training at the Academy, we offer tips that will help them independently find answers to the most important questions:
- The head and shoulders reversal pattern is a synthesis of the horizontal and inclined channels described in detail in the previous chapters of the book.
- If you add 2 lines to the drawings of Murphy and Naiman, you will understand the essence of this figure and will be able to open a trade at the beginning of the reversal trend, and not at the end.
- Confirmation of the correctness of your decision will not be the trading volume, but other Forex analysis tools: Elliott waves, support and resistance levels, Fibonacci, inclined channels, etc.
Test task 1 of the MasterForex-V Trading Academy . Carefully study the drawing from Naiman’s book and try to understand what is marked correctly in the drawing and what is not.
Rice. 6. The first task for a trader from the MasterForex-V Academy
This is an excellent test for those studying technical analysis. Until a trader learns to spot errors in E. Nyman's head and shoulders figure, he will confuse a TRUE reversal with a regular CORRECTION. And this will only lead to one thing - loss of the deposit.
John J. Murphy's "head and shoulders" and inverted "head and shoulders" drawings contain a similar error. It is not for nothing that he depicts patterns schematically, and not using the example of a real trading chart.
Test task 2 of the MasterForex-V Trading Academy.
The real chart, posted in Naiman’s book “Small Encyclopedia of a Trader” (see Library of the MasterForex-V Trading Academy https://dma.masterforex-v.org), is drawn due to THESE errors as follows:
Rice. 7. Analysis of the trading schedule from the book by E. Naiman
In this case, we suggest that the trader also understand Nyman’s mistake in defining the “head and shoulders” pattern.
Definition
Forex reversal patterns are a model or pattern formed by Japanese candlesticks on the price curve, indicating the state of the market. Formations consist of more than 20 bars, are repeated over time, and allow you to predict the further behavior of the quote.
Reversal patterns appear on charts after a strong trend. The impulse exhausts its potential, reaches a local extremum, and goes flat. Afterwards, a new trend is emerging. If you seize the moment and open a deal, you can collect maximum profit points.
Triple and double top or bottom
Triple and double tops or bottoms are the second well-known trend reversal pattern. Schematic drawings of these patterns can be found in the books:
- John J. Murphy “Technical analysis of futures markets: theory and practice” (see MasterForex-V Trading Academy Library - https://dma.masterforex-v.org).
- Naiman E.L. “Small Encyclopedia of the Trader” (see Library of the MasterForex-V Trading Academy - https://dma.masterforex-v.org).
Rice. 8. Triple top pattern
Rice. 9. Triple bottom pattern
Rice. 10. Triple top and triple bottom patterns become the beginning of bearish and bullish trends, respectively.
Detecting a triple and double top or bottom pattern
This is what they write about double or triple tops (bottoms) in the classics of technical analysis.
John J. Murphy:
“The triple top is very similar to the head and shoulders pattern, except that all three peaks are at the same level. Each subsequent peak must be accompanied by a decrease in trading volume. The pattern is complete when prices overcome both declines with a concomitant increase in volume. To obtain price targets, the height of the model is measured, then the resulting value is plotted down from the breakout point. As a rule, after a breakout, prices move back to the lower line.
A triple bottom is similar to an inverted head and shoulders pattern, except that all three bottoms are at the same level. A mirror image of the triple top pattern, with the only difference being that volume as a confirming factor is more important on a breakout to the upside.”
A. Elder : “A Double Top is formed when prices rise again to the previous maximum value. Double Bottom - when prices fall to the previous minimum value. The second maximum or minimum may be slightly lower or higher than the previous one. This often confuses new analysts.
Players identify double heads and double bottoms using technical indicators. They are often accompanied by bullish or bearish divergence. Buying double bottom and selling double head offers the player one of the best opportunities."
Fig. 11. Double top and double bottom patterns
The disadvantages of these reversal patterns were pointed out by Eric Nyman:
“Among triple and especially double tops and bottoms there are many false signals. You can sift them out using parallel analysis of convergence/divergence using the example of the RSI oscillator.”
Test task 3 of the MasterForex-V Trading Academy.
- Nyman characterizes it as:
- strong head and shoulders and triple top (bottom) signals;
signals of medium strength “double top”.
- Is it possible to weed out false signals of a TREND change using:
- volume indicator (which is not available on the Forex bookmaker market)?
- RSI oscillator (a flat indicator, not a trend one)?
- How does a head and shoulders pattern differ from a double or triple top (bottom) if, according to Elder, “the second high or low may be slightly (?!) lower or higher than the previous one. This often confuses new analysts."
What is the difference between double and triple tops in terms of various Forex analysis tools (sloping channels, moving averages, etc.)?
What does "a little" mean? When the top is broken, stay out of the market, open in the direction of breaking the top (along the trend) or against it (considering this break to be false)?
Try to answer these questions yourself, including finding an error in Elder’s logic, which will lead to a whole chain of your mistakes in trading, since without the correct answer to these questions you will not be able to consistently earn a profit on Forex.
Tips from the MasterForex-V trading system for self-study
Very strong signals are the “head and shoulders”, “thorn”, “diamond” (“diamond”) patterns.
Strong signals are “triple top” (“bottom”) and “double top” (“bottom”).
Try to understand the commonalities and differences between the figures of the 2 named categories:
- the general is the ESSENCE of the reversal, common to all figures;
- the difference is the FORM of the reversal.
If you understand the essence of the reversal , you will begin to see the end of the movement in this direction. Understanding the shape of the reversal will help you accurately identify 1-2-3 (a-b-c) waves of a new trend or a strong correction in the opposite direction.
The concept of “a little”, like Elder’s, does not exist in the MasterForex-V trading system.
Currencies:
- or do NOT break through the technical support/resistance level;
- or pierce it to a strictly defined distance.
Cancellation of the trend reversal pattern (“head and shoulders”, “spike”, “diamond”, “triple top”, etc.) is the “Hound of the Baskervilles” model by A. Elder.
Please note that A. Elder did not place the “Hound of the Baskervilles” model in his books “Basics of Stock Trading” and “How to Play and Win on the Stock Exchange”. But a correctly depicted “Hound of the Baskervilles” figure gives the correct answer to the question: is this a trend reversal or a correction?
Look at the fig above. models “Hound of the Baskervilles” from Forex -V Trading Academy and try to understand the difference between:
- trend reversal figure;
- a normal correction, followed by a new wave of the trend.
Difficult? Let me help.
Candle combinations
Skilled traders use Japanese candlesticks to determine reversals. They have become widespread among all investors as the most visual representation of price fluctuations, and using them to detect when a reversal occurs is the next level of skill in their use.
Throughout the history of trading, many combinations of candlesticks have been discovered, as well as single visualizations, which clearly signal the end of the current trend and the beginning of a new one in the opposite direction.
“Elder’s Hound of the Baskervilles / Masterforex-V” is a new trend continuation figure.
Alexander Elder gave the name to the PHENOMENON (“failed Head and Shoulders”) without exploring either the reasons for the failure of Head and Shoulders or the new figure that automatically comes in its place. Therefore, after a dash, modestly stands MF, in whose TS the explanation was first given, and thousands of traders of the MF Academy online use this model, opening buy when the “Head and Shoulders” graphic figure breaks down.
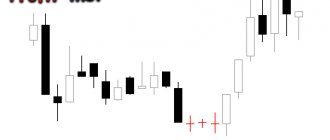
“Elder’s Hound of the Baskervilles / Masterforex-V” looks like this.
Fig. 12. "Elder's Hound of the Baskervilles / Masterforex-V"
An example from real trading on the closed forum of the Masterforex-V Academy on GBPCHF: at first glance, the market was forming an “Inverted Head and Shoulders”, but...
- made it TOO obvious even for novice traders;
- a serious level of accumulation of orders was ABOVE the figure, and not below it;
- JSC Zotik spoke about a reversal downwards, not upwards;
- Franc futures began to rapidly grow (and not fall), moreover, supported by huge volumes of the exchange market;
As a result, GBPCHF collapsed to a cluster of orders 1.2922, and then 1.2694
Fig. 13. GBPCHF
Distinctive features of “Elder’s Hounds of the Baskervilles / Masterforex-V”
- Forms near a strong level of order accumulation, from which a
- or traditional “Head and Shoulders” (under this level);
- or “Elder’s Hound of the Baskervilles / Masterforex-V” (above a given resistance or support level);
- From the point of view of wave analysis, a bearish wave at
- “Head and Shoulders” is wave A downward of a senior TF;
- with “Elder’s Hound of the Baskervilles / Masterforex-V” (failed “Head and Shoulders”) - this is wave B of the senior TF
- Bearish movement in the market with
- Head and Shoulders is supported by Allies and Indexes;
- with “Elder’s Hound of the Baskervilles / Masterforex-V” allies and indices do not change their trend, waiting out the fall of this financial instrument;
- JSC Zotik at
- “Head and Shoulders” confirms a trend reversal;
- with “Elder’s Hound of the Baskervilles / Masterforex-V” shows the divergence of this financial instrument;
- Futures volumes at
- “Head and Shoulders” support the decline and trend reversal;
- with “Elder’s Hound of the Baskervilles / Masterforex-V” the volume of purchases of this futures increases;
- The targets of wave C of the senior TF are determined by the targets of the correction / Fibonacci impulse, the following large accumulations of market orders at
- "Head and Shoulders" below;
- with “Elder’s Hound of the Baskervilles / Masterforex-V” at the top of the chart;
- Tips from senior comrades - professional traders on the closed forum of the MF Academy, because I remind you that BOTH models go down the same way at the beginning.