- home
- Investments
Evgeny Smirnov
0
Article navigation
- What is ROI
- Return on investment ratio ROI: calculation and analysis of the indicator
- How to calculate ROI: formula and examples
- Universal ROI formula
- PI Return on Investment Index Formula
- What indicator is considered good?
- Calculation of return on investment ratio in accounting
- Formula for calculating return on investment in accounting
- ROI Effectiveness in Accounting and Disadvantages
- ROI in Marketing (ROMI)
- ROI Analysis
- What could be the return on investment?
- Problematic points
- How to predict profitability
Investments are a type of passive income that allows you to receive dividends only through investment. To optimize risks and generate more income, the return on investment indicator is used. This value determines the risk-to-reward ratio and makes it clear whether one or another investment option is worth considering.
What is ROI
The main goal of investing is to make a profit. Beginning investors may mistakenly believe that the larger the capital invested, the higher the income. Despite the fact that investing is considered a passive form of income, it requires careful calculations. This means that you cannot invest in any proposed project. Before deciding to invest in a project, it is necessary to determine the profitability. The investor must understand whether the business is (or will be in the future, if it is a startup) profitable.
This does not mean that you can invest in a project where the income will exceed the investment. Even if this is the case, the indicator may be minimal, and the payback period for the investment may be delayed, which will greatly increase the risks.
So, return on investment is an indicator of the effectiveness of the use of capital (own or borrowed) invested in the activities of an enterprise for the long term. This ratio is equal to the ratio of book profit to the average annual cost or equity (borrowed) capital.
Most often in professional circles, to define this concept, they use the abbreviation ROI - return on investment or ROR - rate of return, meaning return on investment. Therefore, when encountering ROI in financial securities, an investor must clearly understand that this is an important indicator of return on invested capital.
ROI is a coefficient that does not show a clear level of profitability, but only approximate figures, a forecast of potential profit. Despite this, its assessment will help determine whether it is worth investing in this project, or whether the return on capital investment in another will be higher.
Return on investment ratio ROI: calculation and analysis of the indicator
Profitability characterizes the use of a material resource (capital), which covers current costs and generates profit. That is, initially implying the return on investment, we should talk about the profitability of each company or enterprise taken. Profitability is calculated in two ways:
- The relative indicator indicates profitability and is measured in ratio format or as a percentage.
- The absolute value shows profit in a specific monetary equivalent (that is, the amount of net profit that was received over a certain period of time from investment activities).
These two methods of ROI analysis are not mutually exclusive, but complementary. It is important for an investor to calculate profitability using both relative and absolute methods when making a decision.
Both values will be strongly influenced by the level of inflation, but not by the amount of income. When making decisions, it is also important to compare the final calculation indicators with the planned values of previous periods and data from other enterprises (if possible). Only this approach will make it possible to make an objective assessment of financial investments in business.
To determine profitability, it is important to specify the income from financial investments. To do this, an analysis of the enterprise and financial resources is carried out in several stages:
- Financial analysis of the company.
- Calculation of the amount of investment required for the full functioning of the company and obtaining net profit.
- Determining the effectiveness of the solution and calculating the rate of return index on invested capital.
- Taking into account additional factors when calculating. Most often, fundamental aspects: inflation, changes in market conditions.
It is important to compare the results obtained from the calculation of the return on investment method with the planned figures.
The payback rate in human capital does not show the average annual value, but the value of the total investment period. That is, return on investment is an indicator of the effectiveness of investments over the entire investment period.
If the investment project is not a startup, then a mandatory factor in the calculation will be the return on investment for past periods. This will make it possible to make a more accurate forecast and identify existing problems both in the operation of the enterprise and in the investment process.
Return on capital investment has a broader meaning and is calculated not only when investing in each organization and enterprise. It is used when working with all financial instruments for the long term.
The return on invested capital is also calculated for alternative investments:
- deposit in a bank or other financial institutions;
- investing in PAMM accounts and other types of trust management;
- contributions to various investment portfolios;
- investments in stock exchange instruments for the long term.
Investment returns require control. This is the ability to manage not only the level of profitability, but also investment activity. If the segment for cash injections seems attractive, but during the calculation the investor did not receive the expected return on investment, then other actions can be taken through investments. For example, increasing the profitability of sales, turnover and transfer of real assets.
INFORMATION BASE FOR CALCULATING PROFITABILITY INDICATORS
Two financial reports serve as the information base for calculating profitability indicators:
• Accounting (managerial) balance sheet (hereinafter referred to as form No. 1, f. 1);
• Statement of financial results (profit and loss statement) (hereinafter referred to as form No. 2, f. 2).
Let's consider the indicators of these reports necessary to calculate profitability indicators.
The structure of the Accounting ( Management ) Balance Sheet , that is, the composition and relationship of its various parts, can be presented in the form of a diagram:
Explanations for the diagram:
NWO - net working capital (current assets minus short-term liabilities);
SK - equity capital (total of section 3 “Capital and reserves” of form No. 1);
IC - investment capital (invested capital) (equity plus long-term liabilities);
ZK - borrowed capital (liabilities) (long-term liabilities plus short-term liabilities).
EXAMPLE 1
Let's consider the consolidated balance sheet of the group (Table 1) and calculate the indicators characterizing the capital structure. We also use the consolidated Statement of Financial Results of this group of companies (Table 2).
| Table 1. Balance sheet, thousand rubles. | ||||
| Balance sheet item | Line code | As of 12/31/2020 | As of 12/31/2019 | As of 12/31/2018 |
| Assets | ||||
| Fixed assets | 1100 | 174 | 424 | 664 |
| Fixed assets | 1150 | 174 | 424 | 664 |
| Current assets | 1200 | 57 934 | 168 376 | 185 706 |
| Reserves | 1210 | 15 206 | 79 226 | 93 906 |
| Accounts receivable | 1230 | 26 502 | 88 118 | 89 898 |
| Cash | 1250 | 16 226 | 1032 | 1902 |
| Balance | 1600 | 58 108 | 168 800 | 186 370 |
| Liabilities | ||||
| Capital and reserves | 1300 | 46 019 | 20 376 | 5262 |
| Authorized capital | 1310 | 300 | 300 | 300 |
| Retained earnings (uncovered loss) | 1370 | 45 719 | 20 076 | 4962 |
| long term duties | 1400 | 10 000 | 10 000 | 0 |
| Borrowed funds | 1410 | 10 000 | 10 000 | 0 |
| Short-term liabilities | 1500 | 2089 | 138 424 | 181 108 |
| Borrowed funds | 1510 | 0 | 7000 | 10 000 |
| Accounts payable | 1520 | 2089 | 131 424 | 171 108 |
| Balance | 1700 | 58 108 | 168 800 | 186 370 |
| Capital structure indicators | ||||
| Net working capital (page 1200 – page 1500) | CHOC | 55 845 | 29 952 | 4598 |
| Equity (page 1300) | SK | 46 019 | 20 376 | 5262 |
| Investment capital (page 1300 + page 1400) | IR | 56 019 | 30 376 | 5262 |
| Borrowed capital (line 1400 + line 1500) | ZK | 12 089 | 148 424 | 181 108 |
| Table 2. Statement of financial results, thousand rubles. | |||
| Report article | Line code | 2020 | 2019 |
| Revenue from core activities | 2110 | 290 848 | 281 966 |
| Cost of sales | 2120 | –253 330 | –247 608 |
| Raw materials | –214 942 | –208 436 | |
| Remuneration of production personnel | –34 082 | –34 076 | |
| Equipment depreciation | –2104 | –3130 | |
| Shipping costs | –2202 | –1966 | |
| Gross profit (loss) | 2100 | 37 518 | 34 358 |
| Business expenses | 2210 | –9994 | –6944 |
| Administrative expenses | 2220 | –1182 | –2000 |
| Profit (loss) from sales | 2200 | 26 342 | 25 414 |
| Percentage to be paid | 2330 | –700 | –300 |
| Income from other activities | 2340 | 19 451 | 8914 |
| other expenses | 2350 | –2000 | –1996 |
| Profit (loss) before tax | 2300 | 43 093 | 32 032 |
| Single tax* | 2460 | –17 450 | –16 918 |
| Net income (loss) | 2400 | 25 643 | 15 114 |
* The group of companies is under a special taxation regime, therefore, instead of the line “Current income tax” (2411), the amount of single tax payable is indicated here.
Let's study the indicators of the Financial Results Report necessary to calculate profitability indicators:
• revenue from core activities (sales) - the amount of manufactured and sold (shipped) products (services provided, work performed) of the core activity, calculated on an accrual basis, excluding indirect taxes (VAT, excise taxes and customs duties);
• cost of sales - includes all expenses associated with obtaining revenue from core activities. Cost of sales takes into account both direct costs (material costs, labor costs and insurance premiums for production personnel) and certain indirect costs (for example, production overhead and depreciation);
• gross profit - the amount of profit from core activities excluding indirect management and commercial expenses;
• profit from sales or operating profit (operating profit or EBIT), - shows the financial result from operating activities, that is, from all ordinary business transactions;
• profit before tax (EBT) - shows the total profit from all types of activity of the enterprise (main and other), as well as from financial transactions before paying a specific tax from profit, depending on the applied taxation system;
• net profit - the main indicator characterizing the financial result of an enterprise (the difference in all income and expenses of the company for a certain period).
In addition to the considered indicators characterizing the financial results of the enterprise, others can be used, for example EBITDA.
EBITDA is earnings from operating activities before interest, taxes, depreciation and amortization. The value of this indicator can be calculated in several ways. One way is to sum up the profit from sales (p. 2200) and the amount of accrued depreciation.
Typically, EBITDA is used for financial analysis by external users (investors, banks, other lenders).
How to calculate ROI: formula and examples
ROI calculation can be done in several ways. For those who want to simplify their life and not deal with routine, you can use various programs, online calculators, and Excel spreadsheets. You just need to enter the desired profitability formula, and the calculation will take place automatically.
You can also hire a specialist who knows how to count. This could be an accountant, financier, trustee or experienced investor. But first, it’s better to learn to understand all the factors yourself and calculate the return on investment rate in order to independently manage your capital and understand how money is used.
There are 3 common methods for calculating return on investment:
- The first formula for return on investment is the ratio of income (before taxes) to the company's assets (that is, the amount spent on production facilities and their valuation, taking into account depreciation at the end of the investment).
- The second formula is the ratio of income (before taxes) to sales volume, multiplied by the ratio of sales volumes to company assets.
- The third is the profitability of sales as a percentage, multiplied by the company’s asset turnover.
It is impossible to determine how a more accurate result can be obtained. Or rather, each of these options is correct. The fact is that return on investment is a fairly broad concept and can be interpreted differently for each individual business segment, taking into account its specifics.
Universal ROI formula
In all three formulas, the main criteria for increasing ROI are an increase in the level of profitability from sales and asset turnover.
Based on this, an optimal formula is derived that can be applied in any area of business (taking into account certain nuances, of course).
Let's give a specific example of calculation. An entrepreneur decided to purchase a trading instrument, for example, let’s take the now popular cryptocurrencies. Amount – investment $100. The price of one coin is measured at $20. The investor expects the price to rise to $25 per unit after some time, after which he sells it. The profit is $25. Thus:
ROI=(125-100)/100*100%=25%
ROI (profitability) will be 25%. This figure can be considered good. But this is only a statistical method. It is impossible to calculate other important factors here - inflation, asset volatility, in general, any trading and non-trading risks. In addition, the indicator is not fixed. It may vary due to changes in the price of the asset. Therefore, it is important to do periodic recalculation.
As can be seen in the example, the formula can be used for investment strategies in speculative assets - Forex, exchange instruments, cryptocurrencies,
This method can be used if you need to quickly calculate several projects and find out which one will be the most attractive. You will need to know the following information:
- cost - the cost of producing a product, including the cost of raw materials, production capacity, and marketing;
- income – the final profit received after the sale of services and products;
- investment amount – the total amount of invested funds.
PI Return on Investment Index Formula
Profitability can also be considered using the PI index (PI index – profitability index).
It is calculated as the ratio of the sum of discounted cash flows to the initial investment. The shortened formula looks like this:
Where:
- PI – profitability index;
- NPV – the amount of discounted cash flows;
- I – initial investment.
But NPV is quite difficult to calculate, especially for beginners. Therefore, it is better to entrust this to professionals. For those who have decided to calculate everything themselves, the formula for calculating cash flows (NPV) will look like this:
Where:
- NPV – the amount of discounted cash flows;
- n, t – time periods;
- CF – flow of payments (that is, CFt – payment in t years);
- R – discount rate.
This indicator allows you to rank projects with limited investment resources and select only those that will provide greater investment efficiency. This formula is very effective when investing in highly volatile instruments, in particular cryptocurrency.
The formula is not suitable for speculators who invest in assets in the short term, within a day or week.
What indicator is considered good?
What should the ROI be? The breakeven point is twenty. This means: if the equation shows 10 when calculating, such an investment is unprofitable. If it turns out to be 20, the investor will only be able to recoup the investment, and then the net profit will follow.
ROI can be a performance indicator when choosing a project. If, according to the ROI formula, a project can be considered attractive with a return on invested capital ratio of over 20%, then the PI will have different values
If PI is defined as less than 1, this indicator is negative, and investing in this project can be considered unprofitable. The average norm is 1: in this case, you can consider the investment project in more detail - this is the standard return. If it is higher than 1, then most likely this is a promising project with high profitability (without taking into account risks). Such calculations are carried out by the analytical departments of all serious companies.
Other disadvantages of this method include the fact that the longer the deposit period, the less accurate the outcome forecast becomes. This increases the PI error.
Business valuation based on return on investment
When analyzing return on investment, you should not rely solely on ROI, since this is often not enough to obtain reliable results. In assessing the attractiveness of a company from an investment point of view, an equally important factor is the time period. It would seem that an ROI of 30% looks better than an ROI of 20%. However, this 30% could be obtained in 3 years, and 20% in a year, which means, in terms of one year, the return on investment ROI in the second case will be higher. But you need to understand that investing for a year sometimes entails great risks, and an investor may be attracted to a longer-term and less dangerous project.
The payback period is one of the key indicators for an entrepreneur if he plans to invest his own funds and chooses the most profitable one among possible projects. But the investor himself decides how exactly he will make the calculations.
Calculation of return on investment ratio in accounting
Return on invested capital is calculated differently in accounting. ROI also focuses not on the valuation of monetary contributions, but on the profit of the business.
This ratio shows the ratio of the average value of the enterprise's income according to accounting reports to the average value of cash injections. But unlike previous formulas, this indicator is calculated on the basis of earnings before interest and tax costs (EBIT - earning before interest and tax) or taking into account income after paying tax payments, but before deducting interest (that is, EBITx (1- H), H - income tax).
The second option is most often used (that is, after paying tax), since it better indicates the benefit received from the company's activities. When preparing a project or starting an investment, it is very important to discuss which analysis method will be used.
The first method is based on the definition of ROI, in which the profit for the year is related to the indicator of the financial investments used. In this case, the amount of annual income must be calculated before the year when production capacity is fully created. In order to reduce the error, ROI is also calculated for each year of the project separately.
In the case of the second method, the indicator is calculated not as the ratio of income for a certain year, but as an average annual value to the initial investment. This takes into account the annual depreciation period for production facilities.
For example, if a company purchases an installation worth 100 million rubles. for use for 5 years, and the increase in profit will be about 40 million rubles, then the ROI will be 20%.
There is a third option for profitability analytics, in which the basis is not the initial investment, but the average financial injection, that is, the average asset that will be acquired during the period of the investment project. In this case, you can use both formulas for calculating profitability.
The first is easier to use if the equipment purchased through investment will not be sold at its residual value. Then, exclusively accounting income is taken as the basis, minus depreciation charges.
The second formula is effectively applied if the production capacities that were created through investments can actually be sold at residual value, taking into account wear and tear, and then this factor will affect the level of return on investment projects.
Formula for calculating return on investment in accounting
The investment amount for which profitability is determined will be calculated as the average between the cost of the equipment at the beginning and end of the period of time taken into account. Therefore, the formula for calculating return on capital will take the following form:
Where: ROI – return on investment; E(1-H) – profit indicator minus taxes; H – as already mentioned, the rate of taxable profit; C2 – value of assets on the balance sheet (production capacity) at the end of the period; C1 – the value of all assets (production capacity) at the beginning of the period; (C2–C1))/2) – the average annual cost of the investment, which is calculated as the average between the accounting value of assets at the beginning and end of the investment period.
ROI Effectiveness in Accounting and Disadvantages
The financial indicator of return on investment projects must be compared with other accounting indicators, and the overall value will indicate the profitability of the enterprise, which will allow assessing its business attractiveness. The clarity of this method will not only stimulate employees, but also attract additional investment.
But this method also has disadvantages. The calculation does not take into account the dynamic value of finance over time (that is, it can change), and does not distinguish between investment data that arises due to the different duration of operation of the assets acquired through the initial injections.
There may also be cases in which profitability values may be equated to internal rates of return. These situations arise due to the following factors:
- When money is invested in enterprises with an unlimited period, where there is equality of financial injections per year.
- When the total amount of depreciation deductions will be equal to the amount required to completely replace a device that has been removed from the process.
- Working capital will not change for the entire period of implementation of the investment project.
Important! Such estimation methods provide approximate data. Other criteria will help in a more accurate assessment:
- integral cost efficiency;
- coefficient of financial assessments of a single project (profitability, liquidity, financial stability);
- breakeven point and so on.
Also for the financial plan it will be necessary to determine such factors as the balance of real accumulated funds, the flow of real funds, the balance of real funds.
Examples of calculating project profit in 1C
MS Excel can be used as a tool for calculating coefficient values, but the complexity of calculating the above indicators, as well as manually combining basic data to obtain them, greatly increases the possibility of error.
It is more advisable to use automated tools, for example, software products on the 1C:Enterprise platform - 1C:ERP Enterprise Management, 1C:Holding Management and 1C:ERP Holding Management. Note that these products are not the only ones that allow you to automate this process, but they are designed to automate the largest companies and holdings, where the task of investing can be described as urgent, and not as an extraordinary event.
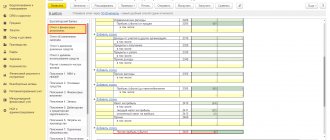
In the 1C:ERP Enterprise Management , the problem of calculating profitability ratios can be solved using the functionality of the Budgeting subsystem. It allows you to create and customize types of reports, specify the necessary indicators and configure formulas for calculating them. To take advantage of this opportunity, in the “Budgeting and Planning” section, go to “Types of Budgets” and create a new type of budget.
Fig. 1 Creating a budget type in 1C:ERP Enterprise Management
For the created budget type, fill in the “Basic” tab.
Fig.2 Filling out the “Basic” tab of the created budget type
Then, on the “Budget Structure” tab, create the structure of a new budget on the right side of the window, selecting elements on the left (report title, table, row/column).
Let's set up 1C:ERP to automatically calculate project profitability
Fig.3 Setting up the budget structure
In the created budget view, using the “Customize cells” element, we configure the rule for calculating the coefficient.
Fig.4 Setting cell filling
Next, create a new instance of the budget and fill in the coefficient value.
Fig.5 Creating and filling out a budget instance
To implement the possibility of plan-fact analysis in 1C:ERP, we create a new type of budget and fill in the “Basic” tab.
Fig.6 Creating a new type of budget for plan-factual analysis
Then, on the “Budget Structure” tab, set the structure of the new report in the right part of the window, selecting the elements on the left side (report title, table, row/column, script, group, formula by group).
Fig.7 Setting up the report structure for plan-actual analysis
Next, using the “Customize Cells” button, we will configure the filling of report cells according to scenarios. After completing the settings, the report can be generated by clicking on “View report type”.
Fig.8 Generated report for plan-actual analysis
Difficult to figure out? Order a free consultation with an expert on accounting for project profitability in 1C
In 1C: Holding Management, the problem of calculating profitability ratios can also be solved using the functionality of the “Budgeting” subsystem. To do this, we will go to the “Budgeting, reporting and analysis” section, create and configure a new type of budget.
Fig.9 Section “Budgeting, reporting and analysis”
1C: Holding Management has a separate functionality for project management, which is presented in the “Agreements and Projects” section under the “Projects and Stages” link.
Fig. 10 Section “Agreements and projects” in 1C:UH
You can create and configure a new project in the system.
Fig.11 Creating a new project
For the created project, the correspondence of the budgets used is established. In the project card on the “Key Indicators” tab, you can view project data, including indicator values, and, if necessary, update the displayed information. The “Key Indicators” tab allows you to compare planned project data with actual data and see calculated deviations.
Fig. 12 Project “Key Indicators” tab
Typical 1C:ERP functionality. Holding management provides a wide range of tools that allow you to automatically calculate most of the indicators we discussed above (which is called “one click”), based on the entered budgets according to predefined conditions.
1C:Holding management
CPM class product for automating financial accounting, calculating profitability and other indicators
Learn more
ROI in Marketing (ROMI)
As you know, investments are required not only in production. You will have to invest in marketing, which should also bring profit.
In terms of investments in marketing, we can also talk about their profitability. Ten rubles spent on advertising can yield 40 rubles as a result. Therefore, you need to know what the term ROMI is (from the English return on marketing investment, that is, return on marketing investment).
ROI and ROMI are, in principle, the same thing, only ROMI is used in a narrower segment. More precisely, it is most often used by marketers.
ROMI will also have errors due to the fact that its analysis does not take into account financial and accounting aspects. As in other cases, there are various formulas, but the basic calculation is the following:
So, if the results are less than 100%, then this means that the project will not have a return on investment in marketing. It is important to note that for startups at the initial stage of marketing, this result may be the norm.
If the results are 100% or more, this means that the marketing investment is fully profitable and profitable, and this is the rate of return on the capital invested.
This indicator is very often used in Internet marketing:
- Direct sales through mailings, products and services.
- Feedback from clients, timely response and resolution of conflict situations helps to improve your reputation and, as a result, attract more clients.
- Various loyalty programs that involve collecting information about customers for the purpose of holding events.
- Sales promotion events - promotions, bonuses, etc.
The concept of ROMI or Marketing ROI is closely associated with Internet activities. To promote a product and attract customers, entrepreneurs use advertising channels Yandex.Direct and Google AdWords (you can find out more about the Yandex.Direct affiliate program here). Therefore, it is customary to talk about return on investment in marketing in terms of the conversion received from advertising. Conversion will be the main factor determining ROMI.
However, this approach allows you to calculate ROMI only for some marketing options. For most critical initiatives, it is impossible to determine whether marketing is generating a return on investment. First of all, due to the fact that marketing campaigns are complex in nature - promotions, packaging, additional gifts. It is almost impossible to determine which process produced which conversion, and the costs for them can be completely different. In addition, marketing research can hardly be analyzed in terms of ROI.
However, with the help of ROMI, entrepreneurs have the opportunity to analyze those segments whose returns do not justify financial investments and diversify capital into more promising areas.
But marketing return on investment alone is not enough to set up a full-fledged program for maximum profit. It can only bring tangible results in conjunction with other promotion tools and the necessary data, as well as with strict control and analytics of all aspects of the business.
Return on investment is a relative indicator. You should not rely on it as an axiom. Only a general analysis of the business, constant research of all its segments and risk analytics will help bring profit. Several examples are given, and they show that with the same figures, some differences in the calculation are possible. This is why it is very important to take a holistic approach and evaluate the full picture.
Advantages and disadvantages
The ROI ratio has its advantages and disadvantages:
| Advantages | Flaws |
| Calculations are simple and quick | The method includes accounting profit, depending on different accounting methods |
| Percentage return measurement is used | ROI is a relative measure that does not take into account the volume of investment |
| Accounting profit can be calculated from financial statements | The duration of the project is not taken into account |
| Covers the entire duration of the project | Time value of money is not taken into account |
| The method is clear to investors and managers | The timing of receipt of income is not taken into account |
ROI Analysis
In this case, drawing conclusions from the resulting figure is much easier than calculating it correctly and reasonably. There are only three options:
ROI < 1 . It’s not even entirely clear what the company’s management is counting on when they promise to return less money to the investor than he invests.
ROI = 1 . The situation is also strange. However, it is quite possible that not all investment potential is revealed when generating probable income. You should go back to the calculations and double-check everything carefully.
ROI > 1 . The investment promises to be successful. However, vigilance will not hurt in this case either.
To determine the estimated amount of profit, the investor just needs to subtract one unit from the ROI and multiply the amount of his contribution by the remainder (difference).
For example, ROI = 1.27. The investment amount was 100 thousand rubles. The projected annual profit is 27 thousand rubles.
What could be the return on investment?
It should be remembered that the highest return on investment is typical for the riskiest projects. The higher the reliability of the investment, the lower the dividends the business initiators promise. At the same time, the low ROI value produces a depressing impression: the incentive to invest money in an enterprise characterized by low profitability disappears. As practice shows, the average return on investment ranges from 15 to 25%. Anything higher is most likely “golden mountains”. Or “forty barrels of prisoners”—whatever you want to call it.
In this case, the specifics of the industry to which the enterprise belongs should also be taken into account. Trading business can bring an investor about 25% per annum, but agricultural production is unlikely to be more than 12%.
Problematic points
Investing always involves risk. The danger of error lies in many probable circumstances that are difficult, and sometimes even impossible, to foresee. Here is their shortest list:
Difficulties in estimating future payments. Each enterprise in the eyes of an investor is a “black box”, the input of which is invested money, and the output is funds returned to him with a profit. However, this object is affected by too many external factors that pose a threat to financial stability. Prices for raw materials, changes in the Central Bank discount rate, the vagaries of demand, the emergence of new competitive offers on the market - and this is not a complete list. There are also natural disasters...
Difficulties in discounting investments. This forecast is based on probable values, but the value of the money invested can change dramatically for a variety of reasons. For example, if inflation is slow or at least predictable, then everything is fine. But it also happens differently.
Time factor. The longer the investment period, the greater the risks. This is clear to everyone: it is easier to foresee the events of tomorrow than what will happen in a year or five years. Short-term investments are mainly of interest to financial pyramids. Investments in enterprises operating in real market conditions are always adventurous to some extent.
Difficulties
In practice, there may be some difficulties in calculating ROI:
- Estimating future cash flows can be a major challenge. The financial system depends on many factors: fluctuations in the price of raw materials and supplies, regulator interest rates, seasonality of supply and demand, and other things;
- Estimation of discount rates, that is, determination of the time price of funds, expressing future monetary transactions in units of present time.
Why do you need information about profitability levels?
First of all, the company itself needs data on profitability indicators in order to understand whether it is performing well enough. There are no standard values here. Therefore, the calculated values are compared with the industry average. This can tell you whether a company is a leader in its field or is lagging behind its competitors and needs to urgently look for ways to improve efficiency.
Traditionally, the following types of activities are highly profitable in Russia:
- mining - according to Rosstat for 2014, the profitability of the products of these enterprises is 36%;
- fishing and fish farming - 33.2%;
- real estate transactions - 23.5%.
Low profitability of products, works, and services in 2014 was observed in the financial sector - 0.7%, in retail - 2.2%, and for utilities it is generally negative.
The dynamics of profitability indicators over a certain period will show whether the business is developing or, conversely, there is regression.
Profitability indicators also solve other problems. Thus, using factor models of profitability, it is possible to identify and assess the degree of influence of certain factors, both internal and external, on profit.
Results
Unprofitable means unprofitable. Everyone knows this. But not everyone knows what exactly profitability can mean. the profitability formulas we provide , you can easily calculate its level for the organization and find out whether your company is effective or not.
And we strongly recommend that accountants pay attention to the profitability of products and assets. What if this saves you from unnecessary attention from the tax authorities? You can find more complete information on the topic in ConsultantPlus. Free trial access to the system for 2 days.
How to calculate payback: examples
An example of calculating ROI (ROMI) in email marketing:
The company launched a mass mailing and received 70 transactions: the purchase of a product from a product category with a discount that was offered in the letter. The amount was 236,000 rubles. The margin is given at 22%.
Gross profit = 236,000 x 0.22 = 51,920 rubles.
Costs: employee salary = 30,000 rubles, mailing service costs 5,000 rubles per month. We get: 30,000 + 5,000 = 35,000 rubles we spent on mailing.
Let's calculate the return on investment - ROI formula: (51,920 - 35,000) / 35,000 x 100% = 16,920 / 35,000 x 100% = 48%.
From the data it follows that for every ruble invested we received 0.48 rubles.
It is recommended to analyze the indicators and also work on the number of mailings per month.
An example of calculating ROI for an advertising campaign in Google Ads.
We spent 20,000 rubles a month on advertising. Buyers bought goods for 60,000 rubles. The cost was 45,000 rubles.
Gross profit = 60,000 – 45,000 = 15,000 rubles.
ROI (ROAS) = (15,000 – 20,000) / 20,000 x 100 = -25%.
From the results it follows that for every ruble invested we lost 0.25 rubles.
It is recommended to reconsider the promotion channel or launch a different type of advertising.
Purpose of the coefficient
ROIC is used as an indicator to indicate a company's ability to generate added value relative to other companies. A relatively high ROIC level is seen as evidence of strong management. But at the same time, high levels of this ratio may indicate that management is focused solely on squeezing out profits, ignoring growth opportunities and destroying the company's value in the long term. Therefore, ROIC is an indirect measure of a company's value. Its positive growth rate directly affects the growth of stock prices.
Disadvantages of return on invested capital ratio
Since Return on Invested Capital is a financial statement-based measure, it has the following limitations:
1) It is impossible to calculate how the income was received. When calculating the ratio, there is no difference between constant profit from operating activities or one-time income that could arise as a result of external market circumstances. 2) Possibility of manipulation of the indicator by management. 3) Subject to influence from accounting policies, and may change with changes in them. 4) Subject to the influence of inflation and changes in exchange rates.