When it comes to trading and technical analysis, oscillator indicators are considered the cornerstone for assessing a currency pair or any other asset class. Oscillators fluctuate between two fixed values relative to the actual price of an asset and help traders measure directional movement as well as strength or momentum. Therefore, by using the oscillator indicator, you can find out whether the price of an asset is going up or down, and also how fast it is moving in that direction.
Market analysts have developed a number of popular oscillators. But not all indicators are created equally, and they all have different features to provide traders with different levels of information. Some indicators were designed to interpret trending markets, while others were designed to identify trading opportunities in range-bound market conditions. Knowing which indicator to use and under what circumstances is what separates successful Forex traders from the rest.
If you are wondering which of the best oscillator indicators available are and which one will help you achieve the best results, then read on. We have compiled a list of the 5 best indicators that you should try.
Stochastic Oscillator
The stochastic oscillator (stochastic) measures the relationship between an asset's closing price and its price range over a given period, as an asset's closing price is likely to remain at the upper end of the daily range during an uptrend.
Likewise, it will be near the low during a downtrend.
With this principle in mind, a stochastic oscillator measures whether an asset's price has been trending, losing momentum, or simply trading in a range.
Any experienced trader can determine the direction of the market simply by looking at the chart. However, the stochastic oscillator greatly simplifies the interpretation of price movements.
The stochastic oscillator oscillates between two fixed values, 0 and 100.
When it trades above the 80 level, some traders believe it indicates that the bullish trend is likely to lose momentum. However, a look at the stochastic oscillator formula confirms that a high stochastic actually indicates a likely continuation.
So, the best way to find a market entry using a stochastic oscillator is to look for long entries after a temporary bearish pullback during an uptrend and short entries after a bullish pullback during a downtrend. This may seem overwhelming at first, especially if you are new to technical analysis and have little understanding of trading divergences. But let's look at an example and you'll see that it's a pretty easy concept to understand.
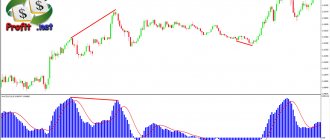
Figure 1: Stochastic Bullish Divergence
In Figure 1, we see that the EUR/USD pair remains in a stable uptrend and adheres to the trend line. But from the second week of June 2022 until the end of the month, the bullish momentum faded and the price gradually moved down towards the trend line. At the same time, the stochastic indicator was declining, and by the end of June its value dropped to 22 points. This represented a perfect bullish divergence and a buying opportunity as a pullback trade.
Overbought and oversold in Stochastic Oscillator
As you can see in the chart above, the Stochastic is used to move up and down between the 20 and 80 levels. Most traders believe that they should buy when the Stochastic oscillator changes direction and goes up from the oversold area, and vice versa when it changes direction and goes down from the outbid area. This is a big mistake because the price can continue to go down for such a long time even when the stochastic is moving up and out of the oversold zone. It can also move on too many candles, even when the stochastic moves down and leaves the overbought area.
If you want to use this system, you must forget everything you already know about this indicator and try to use it in a completely new way, which is actually the real path to profit.
The stochastic oscillator cannot be the only indicator that tells you when to buy and sell. It was created with a different task. It must be used in conjunction with price actions. If you look at the Stochastic Oscillator only to enter or exit the market, then you will lose money even if you have other indicators like RSI and MACD on your charts. Almost the same applies to all other oscillators. You should use them along with price actions. This is the stock price that should give you the signal to buy or sell in the first place. Then you should look at the indicator and find out whether it confirms the price of the asset or not.
Relative Strength Index (RSI)
Like the stochastic oscillator, the relative strength index (RSI) fluctuates between values from 0 to 100. However, overbought and oversold levels are usually set at 70 during an uptrend and 30 during a downtrend. In addition, the way the stochastic is interpreted is almost identical to the stochastic indicator.
Although the Stochastic Oscillator and RSI are considered momentum oscillators, the RSI performs best during a trending market as a reading above 50 signals an overall uptrend and vice versa.
The trick with RSI is to first find potential support and resistance levels and then look for opportunities to enter the market. To do this, instead of focusing on the 50 level, we can draw two additional lines, 40 and 60, on the RSI window.
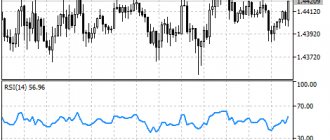
Figure 2: RSI finds support and resistance near the 40 and 60 levels
In Figure 2, we see that the GBP/USD pair found support and resistance when the RSI value reached the 40 and 60 levels respectively. If you were unsure where support and resistance levels were likely to form, observing price action when an asset's RSI values are close to these levels can help you confirm a change in existing price direction. Armed with this information, you can watch candlestick patterns or trendline breakouts to find an entry into the market.
New tools
Classic technical indicators do not always display signals clearly. Often, understanding the market requires additional time to process the results. New generation oscillators are designed to eliminate this drawback.
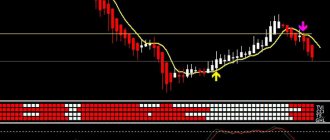
SVS
Helps determine trading intensity by the size of the histogram columns. Based on the combination of colors, you can draw conclusions about market behavior:
- Blue - the beginning of an upward trend;
- Red - warns of a downward trend;
- Brown - strengthening of the bullish trend;
- Green - strengthening bearish movement;
SVS is used to find divergences. Such signals from the indicator are more clearly visible in comparison with Stochastic; its calculation is based on a different mathematical formula.
CC Divergence
cc Divergence is designed to display divergences. Provided as arrow markers indicating the direction of entry:
- Red - entering into short positions;
- Green - placing an order to purchase.
The color change of the next marker indicates the need to close the placed order. The signals are clear, visual and unambiguous, for which many traders value the indicator.
Hdiv
An improved version of the OsMA tool. Built-in auto-detection of the strongest divergences and color secondary signals:
- Blue - for long trades;
- Orange is for short ones.
You can use indicators to confirm a change in the current trend and determine local value extremes - potential points for closing transactions. Hdiv generates a minimal number of signals, but with a high level of quality.
Commodity Channel Index (CCI)
The Commodity Channel Index (CCI) is similar to the RSI indicator. But the underlying mathematical formula, as well as the application, are completely different.
While RSI fluctuates between 0 and 100, CCI has no upper or lower limit.
Instead, the indicator fluctuates between the -100 and +100 levels under normal market conditions. When it remains within this normal range, it means the market is not in a strong trend and signals that the asset's price is likely to remain within the range.
In contrast, a reading above +100 indicates a strong uptrend, and when it falls below the -100 level, it signals a strong downtrend.
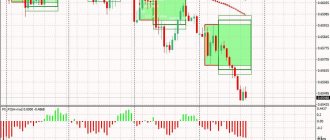
Figure 3: Identifying a trend using the CCI oscillator and entering the market with a breakout of the trend line
The easiest way to find market entry opportunities using CCI is to combine it with technical analysis based on price action, such as trendline breakouts.
In Figure 3, you can see that when the EUR/AUD CCI values moved above and below the +100 and -100 levels, it signaled strong trends. In both cases, the CCI eventually returned to the normal range of -100 to +100. However, when the trends resumed and broke the corresponding trend lines, it brought in some nice profits.
To further refine this strategy, you can also combine it with multiple timeframe analysis, which will help you identify entry opportunities much earlier.
What Forex oscillators show a trader
Forex oscillators show us the moments when the market reaches its limit in any direction and an opposite trend correction becomes very likely. When the price reaches high limits, it tells analysts that the market is overbought. This simply means that the price will remain stable or even slide down for some time because traders are willing to take profits. And during a negative correction, new traders will enter the market, pushing prices up. Accordingly, an oversold market means the opposite condition, when the price has fallen too much and a positive correction is more likely to occur. Generally, it is better to buy in the resale market and sell when the market is overbought. When the oscillator values approach the upper extremes, the asset is considered overbought, and as it approaches the lower extremes, it is considered oversold.
There is one more element in oscillator analysis that is also very important. Oscillators are used not only to detect overbuying or overselling, but to anticipate turning points in price movements. Some of them are mathematical transformations of price (first and second order derivatives) and on charts their lines tend to move in the same direction as the price. When the lines begin to diverge, it means the trend is losing momentum. Oscillators are especially useful for this.
MACD indicator
The first three oscillators we discussed all use line charts to present readings. But the MACD indicator is a completely different beast as it combines two moving average crossovers with a histogram to measure the strength of momentum.
The two MACD lines represent the 12-period EMA and the 26-period exponential moving average (EMA). When the shorter EMA crosses above the longer EMA, it signals a change in trend, just like a typical moving average crossover. But what really makes the MACD stand out is the histogram that measures the distance between these two EMAs. When the histogram is above the 0 line and increasing, it signals an uptrend that is gaining strength. On the other hand, when the histogram is below the 0 line, it means that a downward trend is gaining strength.
Unlike the stochastic oscillator, RSI or CCI, the MACD indicator does not have predetermined overbought or oversold levels. However, the trick is to compare the MACD highs and lows with price action relative to previous highs and lows. By doing this, you can easily find agreements and discrepancies.
Figure 4: Market entries with opposite MACD divergence
The best way to use the MACD indicator is to look at the opposite to find market entry opportunities. This means looking for buying opportunities when the MACD signal line is well below the 0 level and gives a buy signal. On the contrary, you should look for a sell signal when the MACD signal line is trading well above the 0 level. And if you find a divergence, it will only increase the likelihood of an unexpected event, as shown in Figure 4.
An example of an oscillator trading strategy
The strategy for trading with oscillators is as follows:
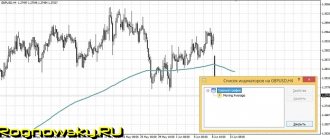
Install two oscillators MACD and Stochastic
MACD settings - 12,20,9 (usually standard)
Stochastic settings - 8,3,3
The first thing we detect during analysis is divergence on the MACD oscillator when a buy signal is detected on the Stochastic oscillator (the signal line leaves the oversold zone, the signal is confirmed by the engulfing candlestick pattern. After the formation of the engulfing candlestick pattern, upon closing the candlestick, we place a buy limit order. Stop We set the price below the minimum with a gap that is comfortable for breathing.
We close the profit under the same conditions: a candlestick pattern and an oversold signal from the oscillators. Or upon reaching a minimum of 1 in 3 risk.
Using this strategy, we get a comfortable stop and a high mathematical expectation for take profit.
We look at the strategy in the figure below:
An oscillator trading strategy by itself, without an additional signal filter, will give poor results, although some trade only on signals. How to trade is up to you to decide what to choose for profitable trading.
If you are interested in learning more strategies on oscillators , then be sure to leave a comment so that I can understand whether it is worth talking about similar strategies.
I wish you financial success!
Wonderful Oscillator (AO)
The Wonder Oscillator (AO) was created by renowned trader Bill Williams to measure the difference between the past 5 period Simple Moving Averages (SMA) and the 34 period SMA. It is displayed as a histogram like the MACD. Simply put, when the histogram is above the zero line and increasing, it signals increasing bullish momentum. When the histogram is below the 0 line and decreasing, it signals that bearish momentum is strengthening.
Most traders use a crossover of the AO zero line—when the histogram goes above or below the zero line on the other side—as a signal to change the prevailing trend. But if you use AO as a separate indicator in this way, you are likely to find many false signals. The best way to use the AO indicator is with the Double Peak strategy, a fancy term that basically describes trading divergence.
It is important to remember that bearish double peaks are above the 0 line and bullish double peaks are below it.
Figure 5. Market entry with double peak and bearish oscillator
To enter the market with a bearish double peak AO, you need to wait for two consecutive peaks to form above the zero line, where the second peak is lower than the first. As we can see in Figure 5, place a short order when the red line appears on the histogram. In contrast, to trade bullish AO double peaks, you need to wait for two consecutive peaks to occur below the 0 line. In this case, the second peak must be higher than the first. Then, when the first green bar appears on the histogram, enter the market with a long order.
Read: Short and long position on the stock exchange: what is it, which one to use?
Bollinger Bands
This is one of the most popular indicators. The so-called Bollinger Bands are an extremely simple indicator to interpret. Perhaps this is where its popularity comes from. It is mainly used to confirm that the input is correct. In an extreme situation, where the so-called Signal lines speculate with this indicator on the return of prices to average values.
Summarize
Oscillator indicators are great for determining the direction and measuring the momentum of directional movements in asset prices. But using a single oscillator to find market entries would be too aggressive for even the most experienced technical traders. Instead, we recommend that you combine one of the 5 main oscillators we discussed above with price action, either breakouts or candlestick patterns for confirmation before placing any orders.
Igor Titov
Economist, financial analyst, trader, investor. Personal interests – finance, trading, cryptocurrencies and investing.
Advantages and disadvantages of oscillators
Advantages
- Oscillators are leading indicators. The oscillator gives a signal to open or close a position before the price of a financial asset reverses.
- Ease of use. Oscillators provide clear signals that even a novice trader with no trading experience can master.
- Oscillators have standard parameters recommended for most trading strategies. Beginners are recommended to use standard oscillator parameters.
- Flexibility of settings. Oscillators make it possible to change settings depending on the trading strategies used. Professional traders, with increasing practical trading experience, change the parameters of oscillators, building complex, highly effective trading strategies.
Flaws
- False signals at the start of a new trend.
- A large number of false signals in a trending market.
- A strategy built for one financial instrument most often cannot be applied to trading other assets. With a change of trading instrument, each time the strategy will have to be tested again and changed depending on the test results.
Let's summarize
There are no universal oscillators for Forex. It all depends on the way of trading. The range includes classic indicators that have been working for decades. There are modified versions and new developments that deserve attention. Regardless of the indicator type, we recommend working with the parameters before starting trading. Advantageous settings are selected for the asset and timeframe used.
An important rule is not to trade based on the performance of just one indicator. The oscillator is only part of the TS. Use signals with multiple confirmations.
Do you have experience using oscillators? Share it in the comments. If you have any questions, ask them - we will definitely answer.
Oscillators in technical analysis
In those. In the analysis, oscillators are a reflection of the speed of price movement over a certain time period, which is displayed on the chart as an oscillogram that has its own measuring scale, which indicators do not have.
There is a constant change in price in the market. Its speed either increases, then decreases, or remains unchanged. It is generally accepted that a decrease in speed during an uptrend or downtrend is considered a signal warning of the likelihood of a change in price movement soon. These periods are the most profitable for opening a trade, since, most often, they are followed by moments at which a rapid change in speed occurs. It is at such moments that you can make big profits.
Various tech methods. analyzes that allow one to predict the dynamics of price movement are divided into graphical and analytical. Forex indicators oscillators are analytical methods.
Forex oscillator indicators – their types, purpose and settings
Most recently, we looked at various methods for determining a trend, and now let’s talk about what technical indicators exist that help recognize a flat on the charts of various currency pairs. These technical analysis tools include standard Forex oscillator indicators, which are available in every MT4 trading terminal. Translated from Latin, oscillo means “swinging,” which is the basis of oscillator indicators. With their help, you can determine new lows and highs on the chart, the price seems to swing up and down, and the oscillator indicator shows when the price changes its direction. The main concepts of the group of indicators, each of which we will consider below, are oversold and overbought zones, which form at critical points in the indicator window. If the price has entered the overbought zone (above 80%), this means that the market is saturated and we should expect the price to fall. When the price is in the oversold zone (below 20%), we should expect the price to rise. It is not recommended to use oscillators on trend movements, since it is impossible to say with 100% certainty when the trend will change. However, oscillator indicators are indispensable in a flat, as well as for determining the end of the correction and the continuation of the current trend. See also what types of STP Forex brokers there are and what they are needed for.
Stochastic Oscillator
First, let's look at the most popular indicator from the group of oscillators - the Stochastic Oscillator. It shows the market's impulsivity based on recent price values. Stochastic Oscillator is a separate indicator window located immediately below the chart, in which indicator values change in the range from 0 to 100%. To enter purchases, it is recommended to wait until the fast (solid) line crosses the slow (dashed) line from bottom to top, and the price leaves the oversold zone. To sell, the fast line must cross the slow line from top to bottom and leave the overbought zone. The Stochastic Oscillator indicator shows good results in flat conditions and is distinguished by the clarity of its signals.
In a trend, the Stochastic Oscillator is recommended to be used in combination with trend indicators as a filter. In the indicator settings you can specify:
- fast moving average period (%K);
- slow moving average period (%D);
- Slowdown – used to smooth out a slow moving average.
Many novice traders are interested in how to set up the Stochastic Oscillator. Most often, standard indicator settings are used (5, 3, 3), which work well for searching for short-term impulses, but sometimes there are long stochastics (14,3,3 or 21,3,3), which show fewer signals but identify larger ones price reversals. The higher the period, the more accurate the signals and the more important the turning points. In addition to oversold and overbought zones, using the Stochastic Oscillator indicator, you can identify divergence patterns that indicate the weakness of the current trend and show trend reversal points or consolidation.
RSI (Relative Strength Index)
The RSI indicator is used to assess the weakness or strength of the current trend. This indicator is plotted in a separate window under the chart in the form of an index curve. When the RSI curve crosses the 70 line (overbought zone) from top to bottom, it is necessary to consider selling. If the relative strength index crosses line 30 (oversold zone) from bottom to top, you should look for buy entries. The default period in the indicator settings is 14, but it is also often set to 9 or 25. The RSI indicator is very sensitive to trend variability. If you draw a trend line in the indicator window along the highs or lows, then breaking it will signal a change in trend much earlier than it will happen on the chart. In addition, more clear price patterns are formed in the indicator window than on the chart, for example, the “Double Bottom” figure. In addition, turning points can be found through the formation of divergence and convergence patterns.
MACD
This indicator is used to determine the strength and direction of a trend, as well as trend reversal points based on a combination of three moving averages. MACD is a histogram consisting of vertical bars that fluctuate around zero. Thus, MACD shows what trend is currently observed in the market - bearish or bullish. When rising bars appear above the zero mark, we can talk about the predominance of bullish sentiment in the market. If decreasing bars are drawn below the zero mark, there is a bearish trend in the market. A decrease in the positive MACD indicates a correction in the bullish trend, while an increase in the negative MACD indicates a weakness in the downward trend. As a filter before entering a trade, you can use the intersection of the signal (dashed) line with the zero mark or the histogram curve. Thanks to this, the signals will be more accurate, but they will be slightly delayed in time. It is recommended to use standard parameters as settings - 12, 26, 9. However, no one forbids you to experiment; it is possible that you will find more successful MACD settings. In addition to crossing the signal line and the zero histogram, MACD can also be used to look for divergence patterns.
Awesome Oscillator
A variation of MACD is the Awesome Oscillator (AO) indicator, developed by Bill Williams to determine the rate of price change, presented in the form of a histogram. It is based on a principle based on the difference between moving averages, the periods of which are 34 and 5. The colors of the histogram bars signal a change in sentiment. When red appears, you should sell, while green indicates buying.
Bill Williams recommends using the Awesome Oscillator with another of his developments - the Accelerator Oscillator (AC) indicator, which determines price acceleration. It is also a histogram with vertical bars colored green and red. Accelerator Oscillator is a leading indicator and serves to filter signals received using the Awesome Oscillator. The intersection of the AC indicator with the zero mark is not a signal to open positions. A buy signal is considered to be the simultaneous formation of a green bar above the zero mark for both indicators. At the same time, the Accelerator Oscillator is the most sensitive indicator that signals a change in market sentiment before the Awesome Oscillator, so you should pay special attention to it when exiting a position.
ATR (Average True Range)
Unlike the indicators described above, the average true range is not used to determine the strength and direction of a trend. Average True Range is designed to measure market volatility. The standard ATR period is 14 days. The higher the value of this indicator, the higher the likelihood of a trend change. A low ATR value indicates a flat state in the market.
CCI (Commodity Channel Index)
This indicator was originally developed to evaluate commodity prices, but now it is successfully used by many traders to identify oversold and overbought zones. The CCI indicator window is a curve with a period of 14, which fluctuates around the zero line in a certain range. The strategy is to trade at the levels of +100 and -100. If the CCI curve crosses the +100 line from top to bottom, this indicates that the price has entered the overbought zone, so you should sell. When the commodity channel index curve crosses the -100 line from bottom to top, the market is in an oversold state, so it is necessary to enter into purchases. The disadvantage of CCI is the presence of a large number of false signals. This disadvantage can be turned into an advantage if you specify additional levels +200 and -200 in the indicator settings in the “Levels” tab. It is necessary to enter the market similarly to the previous rules, but only at levels +200 and -200. These levels allow you to identify turning points on the chart, giving you the opportunity to enter trades at the very beginning of the trend. Of course, the number of signals will noticeably decrease, but the likelihood of such signals being processed, as well as the profitability of transactions, will significantly increase.
Demarker (Demark indicator)
This indicator is used to identify possible buy or sell signals. Demarker finds areas where the price is subject to changes. As a rule, price turning points correspond to peaks or troughs in the indicator window. The Demark indicator curve with a period of 14 changes between values 0 and 1. We can talk about a price decrease when the Demark curve crosses the level of 0.7 from top to bottom. Crossing the 0.3 level from bottom to top indicates a possible price increase. The DeMark indicator performed well both in the formation of global trends and during intraday trading.
Force Index
The strength indicator was developed by Alexander Elder to measure the strength of price movement relative to its direction, as well as the volume and size of Japanese candles. The indicator curve is located around the zero mark, which serves as a guide to determine the relative balance of forces moving the price up or down. It is recommended to buy when the strength of the bears begins to decline, that is, the indicator drops below the zero mark, while the price begins to move up after a long downtrend. You should keep your position open until the Force Index forms new highs. As soon as the strength of the bulls weakens, that is, a new price jump is not supported by the indicator readings, it is necessary to close positions. For sales everything is the same.
Momentum
The Momentum indicator is used to determine the direction of the trend by changing the speed of price movement. The indicator window is a curve that fluctuates around the 100 mark. To buy, you need to wait until the curve crosses from bottom to top with the 100 axis. If the price has a long upward trend, and the indicator shows maximum values, this indicates the strength of the trend. During sideways price movement, the maximum values of the indicator are turning points. When the price makes a new high and Momentum tends to fall, you should exit the purchases. For sales, the indicator curve must cross the 100 axis from top to bottom. The exit from the transaction will be the minimum Momentum values, followed by a reversal of the indicator in the opposite direction.
RVI (Relative Vigor Index)
Another interesting indicator was invented by John Eilers, which was called the “relative cheerfulness index”. It is based on the intersection of moving averages, presented in a separate window below the chart, which are aimed at determining the direction of the trend. The idea is based on the fact that the closing prices of candles are usually lower than the opening prices in a falling market and higher in a growing market. It is recommended to enter sales when the RVI curve (green) crosses the signal line (red) from top to bottom, and for purchases you need to wait until the indicator curve crosses the signal line from bottom to top.
We looked at the most common types of oscillators built into the MT4 trading terminal. Their main advantage is that they do not need to be downloaded and additionally configured. Everything is already ready and configured properly. All you have to do is find a worthy use for them in your trading system. The oscillator indicators described above should not be used as a separate tool. Due to the large number of false signals, the total number of profitable trades will be approximately equal to unprofitable ones. In combination with other trending technical analysis tools, you will be able to reduce the likelihood of false signals, which will make your trading profitable and safe.
Features of use
Key types of oscillator signals:
- The instrument line has left the oversold or overbought area. The signal shows a possible market reversal. To open a trade, you need to wait for the levels to break through closer to the center of the corridor. If an asset is oversold or overbought, it is not recommended to enter the market.
- Breaking through the center level. When moving from top to bottom, a sell order is opened. An upward movement is a buy.
The indicators are used in conjunction with technical indicators to determine the level of market maturity. In the oscillator settings, an additional level of 50 is set. The intersection of the indicator indicates the predominance of bears or bulls in the market.
If the central level is frequently broken, trading is not recommended. The situation indicates a struggle between buyers and sellers, resulting in the market being in a state of uncertainty. - Mutual intersection of lines. Used for indicators with 2 moving averages. A signal occurs when the main line crosses the signal line. The deal is made in the direction of the breakout. It is forbidden to use it as a main signaling device - frequent errors are possible.
- Divergence. The most powerful and influential signaling device. Indicates a discrepancy in the indicator field and the values on the chart. For example, the last of the local maximums on the quote chart is located above the previous one. The oscillator shows the opposite movement - we should expect a decline in prices.