My acquaintance with trading patterns began at the very beginning of a trader’s journey. I remember a colleague telling me what triangles were, which he was trying to trade at that time. He (as it turned out later simply by lucky circumstances) managed to earn money for an inexpensive car from Forex, so I listened. Over 7 years of trading with real money, I have made one single conclusion: patterns and figures work only in the skillful hands of an experienced speculator, and not on their own. Below I will tell you in detail what patterns are, how to use them and several other important nuances.
Definition
First, just a little theory.
Patterns in trading are different combinations of price (and sometimes indicators) that often appear on charts. For example, it could be “head and shoulders”, triangles, etc. Here we are not limited only to classical technical analysis, so doji, absorption, levels and other ideas in trading can easily be classified as patterns.
Let me briefly list the main types from the classification of pricing models:
- candlesticks (mentioned above);
- classic (double top/bottom, flag, wedge, triangle, etc.);
- levels (mirror, false breakout, etc.);
- from cluster analysis (letter “P” or “b”);
- by volume (spike, growth on a trend, decline in consolidation);
- Fibonacci (for example, rebound from 61.8%).
The list is not closed, because in trading there are many different methods of market analysis. All of them, in one way or another, rely on price movements that were repeated in the past, i.e. to patterns. However, in most sources they are understood as exclusively classical technical analysis, so that you and I do not have disagreements and misunderstandings, in this article I will focus on it.
Features of patterns
Literally translated from English, the word “pattern” means “template”. When applied to the Forex market, the pattern allows you to see the real movement of trends and prices in a specific direction from a tactical point of view. This does not take into account the location of the price chart. It is important that from the analysis of candles and their patterns it is clear which situation is profitable and which is unprofitable. For example, if candlestick analysis shows that the price rose for three days and then fell for one day, then this is a real opportunity to make a profit. This combination of candles is called a pattern.
It is interesting that when analyzing patterns, Forex traders may not react at all to other signals: trend, support and resistance. The main thing is to correctly determine the moment of tactical entry or exit.
Trend continuation patterns
I have already said several times that I always try to trade only the continuation of a trend, and patterns were no exception in this case. It is better to use them only as a signal to participate in a strong movement. It's simple physics - it's easier to roll down a hill. The market is like a train, and the trader's job is to get on and off at his stop. Let's move on to the description of the patterns.
Triangle and its types
The triangle is the most popular way to trade with the trend (although many beginners manage to look for reversals using it). To begin with, let's pay attention to the classic variation of this formation within the framework of the schematic image below.
As you can see, this is a typical figure from a geometry course. There are several nuances to this construction option:
- the angle must be right, i.e. the price hits the level and tightens (otherwise it will be a pennant, about which a little later);
- for construction you need at least 4 points to draw two lines;
- minor false breakouts and jumps beyond the boundaries of the shadow or body of the candle are allowed;
- the presence of an impulse is necessary, i.e. obvious trend.
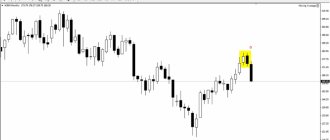
An example of a triangle trade is AUDUSD, March 2022.
As you can see, the entry was made almost at the very beginning of a small movement. The basis was a strong impulse before the formation of the triangle. Then, the price began to hit the level, and immediately after the breakout the trade was entered. Subsequently, there was a rebound from the border (retest). Read more about triangles in the previous article.
Important: after the end of the figure and a successful position, it is better not to open again. The maximum probability of success is only at the very beginning of the impulse, after which the market usually consolidates.
Pennant (symmetrical triangle)
People come up with a lot of names for the same thing. Some people consider pennants to be a separate pattern, but for me it’s the same triangle, it is also often called symmetrical. Here is a schematic illustration.
Rules for working with a pennant:
- you need at least 4 points to build;
- the lines must connect at the end and not be parallel, otherwise it will be a flag;
- it is desirable that the intersection point and the middle of the base of the triangle are approximately on the same line (if this is not the case, then there will be a different figure - a wedge);
- small false breakouts of boundaries are allowed;
- There must be an impulse before a pattern is formed.
Example transaction - USDCAD, end of January 2022.
As you can see, there is a false breakout at the bottom by the shadow of the candle - this is normal and has no effect. There was no obvious trend before the formation, but the impulse at the beginning of the pattern was quite strong, which allowed us to confidently enter the position.
Wedge (triangle sloping up or down)
The wedge is another variation of the triangle. It looks like a variation of a pennant, but the lines don't meet so easily at the end. In addition, the wedge can be directed downwards or upwards (descending or ascending), be a reversal or a continuation pattern. Here is a schematic illustration.
Rules for using a wedge:
- you need at least 4 points to build;
- the borders face each other, but do not intersect in the immediate space, like a pennant;
- the wedge can be directed downward or upward, as a rule, the breakdown occurs against the slope line;
- small false price hikes are acceptable;
- momentum before a wedge formation may be absent when it is a reversal pattern rather than a continuation pattern.
My recommendation: the wedge is most often formed in larger sizes than the classic pennant or flag. It is difficult to attribute it to a continuation of the trend, although theoretically there are such examples. I would classify the wedge as an independent formation that does not depend on the direction of movement.
Example on the chart. I didn’t find a real deal, I tend to see pennants and flags more often, so I’ll show the usual images.
This is exactly what I wrote about in the recommendation above. The wedge is quite large compared to the trend movement before it. It resembles the formation of a chaotic consolidation, but which can be represented as a figure.
Trend line (channel)
Since we are talking about technical analysis and patterns, we cannot ignore classic trend lines and channels. Schematically they look very simple.
Construction rules:
- you need at least 3 points (two for the main trend line and one for the projection in the form of a parallel);
- the channel can be directed in any direction (horizontally in consolidation, inclined downward or upward);
- The trade is entered after a rebound from the third point, i.e. you cannot open earlier, when only the second extremum appears, since the situation may change and the channel will not appear at all (it is also better not to enter later on the fourth rebound);
- small overshoots and false exits beyond the boundaries of the lines are allowed;
- the middle of the channel can become a zone of resistance or support.
An example transaction is EURAUD, February 2022.
Unfortunately, I didn’t stay in the position for a bit; I could have taken a little more profit. The entry was made after a strong downward impulse with a return beyond the upper limit. Further, the middle of the channel became resistance and there was no point in waiting for the bottom line to touch.
Everything you need to know about trend lines is here.
Flag
Why did I place the flag in the channel section? They are very similar, they just have different names. In fact, the flag is a consequence of a breakdown of the trend line. Just look at the diagram below to see this.
The construction rules are the same as for the channel, except that the formation of a flag requires the presence of an impulse, i.e. obvious trend.
An old example with USDJPY in October 2022 caught my eye.
Here I entered the trade ahead of time. Ideally, it was necessary to enter when there was an obvious breakdown of the channel border, but I was guided by a slightly different timeframe and system.
Pros and cons of using technical analysis figures in trading
Technical analysis is a reliable tool, especially when it comes to relatively short-term and speculative trading. Let's look at the advantages and disadvantages of this method.
Advantages and disadvantages
Technical analysis can be used both in the foreign exchange market and in the stock markets of different countries;
Using graphs, you can analyze different time periods: from one minute to several years;
There are many methods developed for specific market sectors;
Technical analysis can be used both in the foreign exchange market and in the stock markets of different countries;
Subjectivity. The positions of two traders on one issue may differ significantly, and a beginner may see what he wants to see, and not the real market situation;
Technical analysis reports the likelihood of certain events occurring, but does not state what exactly should happen;
Technical analysis is based on mathematical calculations and these operations require certain skills and abilities;
In technical analysis, the reliability and relevance of information is important.
Trend reversal patterns
I rarely work with trend reversals, but there are a lot of patterns for this. If you are a beginner, I advise you to focus on the above continuation formations. Let's get started.
Head and shoulders
The most famous reversal pattern is the head and shoulders. Despite the fact that in many studies and interviews this model was lowered below the plinth by the fact that it works 50/50 or even less, it can be used in skillful hands. Schematic illustration below.
Key rules of construction:
- the extremum of the head should be below the shoulders;
- it is necessary to be able to draw a neck line;
- the presence of a strong impulse, a final push before the reversal, is important;
- The trade is entered after the neck line is broken.
In fact, you should feel that the market is already at its limit. Only then can you draw patterns and enter into a trade; there is no point in mindlessly looking for “head and shoulders” on the chart, there will be losses.
Example trade - GBPUSD, November 2022. I have already shown this trade several times, one of the most successful at the end of last year, but here we will look at it from a different angle.
As you can see, before entering the first position (there were three further on), you can notice the classic “head and shoulders”. In this case, I relied on other considerations, but it is quite suitable as an example.
This figure was discussed in more detail in the article.
W-reversal or double/triple top (bottom)
The next pattern is a double top/bottom. In addition, there is a similar model, but with three extremes. Schematically it will look like this.
Construction rules:
- it is necessary to have 2-3 minimums or maximums at the same level;
- a small false breakout is allowed, but insignificant (by shadow);
- there must be a final impulse before the reversal;
- entry into a trade is carried out only after the breakout of the range boundary (thin line in the diagram).
Example - a triple bottom is very rare on large timeframes, so I always mention my forecast on TradingView for USDJPY.
This is practically a transaction, but not for money, but for public viewing. I was trading then, but the history was no longer preserved and there were many different positions. The graph in the green area is what happened after the forecast was published (they cannot be edited). In general, I don’t use this pattern very often, so I don’t remember any real transactions, although something might fit the description.
See all the intricacies of working with this figure at the link.
V-turn (spike)
A V-reversal is characterized by the presence of a strong surge in volatility on the chart, i.e. it's not just a letter-shaped depression. I try not to enter into such a whirlpool, because with high volumes it is easy to fly out of the market stupidly because of the broker (inadequate spreads, automatic reduction of leverage due to news, etc.). The stop may be triggered at other prices that are not particularly profitable. Here is a schematic representation of the pattern.
A few rules for construction:
- The V-reversal should resemble a spike (large pin bar) and consist of 2-4 candles;
- usually high volumes are observed, but Forex uses a tick indicator, it may not show the true picture (in other markets or currency futures this signal will be more reliable);
- there must be a stable trend at a slight angle before the reversal.
Example on the chart. I already talked about this deal with EURAUD.
It was possible to sit in it longer, but then I opened the position purely for fun in January.
U-turn
The next pattern in trading is the U-reversal. It is the exact opposite of the V formation. This time the market should unfold gradually, drawing a parabolic curve. The diagram looks like this:
Construction features:
- the presence of a U-shape rounding;
- the pattern should form gradually at low volatility;
- an impulse or a clear trend is needed before the figure;
- entry is made after a breakdown of the base of the rounding (preferably from consolidation).
My note: U-turns are very common, but not always so obvious. Many of my trades will fit the description, because after it we actually enter a new trend that has already confirmed itself. Thus, the model refers to a reversal only theoretically, but in practice it is a continuation trade of a new trend.
An example of a transaction is EURAUD, end of March 2022.
The U-spread is similar to a head and shoulders or diamond in many cases. I differentiate them for myself by the fact that in a parabolic rounding the market is in a narrow consolidation, there are many implicit extremes.
Cup with handle
Bullish trend continuation pattern. Often used to open long positions.
To form this pattern, the following is necessary: a sharp rise in price, after which a slight correction occurs and a pattern element called a “cup” is formed. Then the price rises a little more and corrects again, forming an element similar to a pen. Eventually, the price begins to rise again and rises even higher .
Cup with handle
A figure can be considered reliable when the depth of the bowl is 1/3-2/3 of the initial upward movement.
It is better to open buy positions at the moment when the price breaks the upper trend line of the handle.
Scheme No. 20. Linear channel (rectangle)
- The Rectangle pattern refers to trend continuation patterns, with a 70% probability of completion, a reversal probability of 30%;
- the principles of formation and development are the same as in the description of Scheme No. 18 ;
In the descriptive material, we decided not to include examples of charts from the market, since each case is special, it is advisable that readers themselves open the exchanges or the portal tradingview.com, start looking for similar patterns and see how they worked out.
Community based content
Thank you for your attention. We will be very grateful for subscribing to our channel Mirai Notes |未来|