olegas May 17, 2022 / 266 Views
Technical analysis indicators play a fairly important role in the work of a modern trader. The very purpose of indicators is to simplify as much as possible the analysis of the huge amount of information presented on price charts. Therefore, now it is hardly possible to find a trader who has not heard of such a concept as technical analysis indicators.
Thanks to the use of computers, the use of indicators has been simplified as much as possible for modern traders. In order to attach one or another of them to the chart of any financial instrument, just click a couple of buttons on the control panel of the trading terminal. The terminal will automatically calculate all parameters (according to the specified settings) and display a convenient and easy-to-read indicator chart.
A trader only needs to know how to correctly interpret the readings of a chart issued in this way in order to isolate from them reliable trading signals to buy or sell the financial instrument in question.
Below are the most popular (and therefore present in the tools of almost every trading terminal) existing indicators.
Indicators distract from what really matters
Previously, all my trading decisions were based on signals from a group of indicators. I didn't even look at the charts. It didn’t matter at all to me what exactly I was trading. That is, I relied on a set of lagging indicators to make the decision for me. I considered myself a trader and hoped to make a lot of money, but in reality I was just lazy.
Because of all these indicators, I practically did not pay attention to what phase the market is now and how far the price is from key levels. I just followed the signals because a few squiggly lines told me it was time to buy or sell.
My account balance gradually decreased. As a result, I lost my entire deposit. I had to radically reconsider my trading and completely abandon most indicators.
Do not misunderstand me. I don't want to say that indicators are bad or that they don't work. Even now, I sometimes use two moving averages to help me trade in a trending market.
However, I now firmly believe that relying solely on indicators without understanding price action is a big mistake. There is no better indicator than the price itself, which clearly shows the struggle between buyers and sellers in the current market situation.
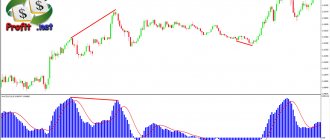
RSI
RSI (Relative Strength Index) indicator - The Relative Strength Index is an oscillator that follows the price and fluctuates in the range from 0 to 100. At first, its 14-period version was used, later 9 and 25-period indicators became popular.
It is important to remember that the shorter the calculation period, the more sensitive the RSI indicator becomes and produces more false signals. So you need to be careful when setting it up.
TS with RSI is based on searching for divergences (discrepancies), in which the price forms a new high, but the indicator fails to exceed its previous high. With such discrepancies, we can say that there is a high probability of a price reversal. If the RSI subsequently falls below the last trough, then the so-called The “failed swing” ends and indicates an imminent price reversal.
To open sell trades:
- The RSI broke through the overbought level (70) from top to bottom.
- We sell on the next candle after the breakdown.
- We set the Trailing Stop to the level of the local maximum price that preceded the opening of the transaction. That is, Stop Loss will automatically follow the price at a certain distance.
- We set Take Profit 2.5 times further (in points) than Stop Loss.
- If a reverse signal has formed, but Take Profit or Stop Loss has not yet triggered, we close the deal manually.
Buy transactions require the opposite conditions.
Indicators are tied to specific market conditions
Undoubtedly, you have more than once encountered offers to buy a trading robot or advisor. Most often, their creators talk about a high percentage of profitable transactions.
However, the percentage of winning trades is not the only factor. It is also important to take into account the risk-to-reward ratio and the size of the stop loss. Because one losing trade can cancel out a series of profitable ones.
How do developers manage to achieve such beautiful yield curves that they post on Myfxbook? It's simple. They create an advisor that works great in certain market conditions. Trading looks great, but the robot is completely dependent on specific conditions. They also work well only on certain currency pairs, because it was on these pairs that they were set up and tested.
Perhaps the robot was adapted for trading in a range or on a trending market. But what happens when the market situation changes? Trade goes into drawdown. And you will have to look for a new advisor that would fit the current conditions.
Perhaps some of the advisors can be configured to work in different phases of the market, but the vast majority of them still show only losses in the long term.
The key factor here is the inability of robots to dynamically adapt to the current market situation. If they are designed to trade in a trending market, they will most likely start trading in the red when the market goes into consolidation. Even large hedge funds are not immune to this. They pay millions of dollars for developments in automated trading, and still sometimes suffer losses.
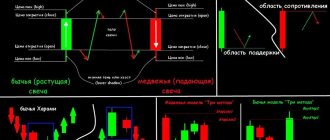
But you know what doesn't depend on market conditions? Price action. Simple but effective patterns such as the pin bar, inside bar or engulfing pattern have worked for decades and will continue to work for a very long time.
If you create a smart risk management strategy, price action trading will bring you consistent profits.
Of course, most of the time you will have to stay on the sidelines and not trade. But once you know exactly what you need to see on the chart, price action will work regardless of whether the market is trending or consolidating.
Chart patterns such as ascending and descending channels, double tops and head and shoulders have been around for ages.
Price Action Indicator
We recommend using Price Action patterns to all traders, regardless of what trading strategy they use. If there are difficulties in identifying patterns on the chart, an indicator (or rather an information panel) will come to the rescue, which will display 3 typical RA patterns in automatic mode. You just need to evaluate whether this pattern is worth using.
He can work with only 3 RA patterns:
• pin bar;
• absorption model, in the indicator it is called a vertical bar;
• Double High/Low.
There are many settings, most of them do not directly affect the operation of the indicator, but there are a number of parameters that are directly responsible for the configuration of patterns, as well as the display of patterns:
• block of settings with timeframes - sets the time interval on which the indicator will search for patterns. By default, m5, m15 and monthly timeframe are disabled;
• Symbols - in addition to the 3 currency pairs for which RA patterns are searched, you can add any other simply by entering it in this field;
• Max_Body_Tail_Ratio—for a pin bar pattern, the minimum acceptable ratio between the body size and the size of the shadow in points is set. There are settings sections for the other two patterns.
After launching the indicator, a separate table will appear under the chart in which 3 currency pairs are indicated:
• Symbol — currency pairs;
• TimeFrame—at what time interval the indicator found the pattern;
• Direction — direction of the pattern;
• Pattern — name of the pattern;
• Age—how long ago the pattern was formed. The age of the models is indicated in candles;
• Completion—at what price the model was formed;
• Chart - clicking on the link immediately opens the chart on which the pattern formed. Moreover, it opens immediately at the desired time interval.
On the chart, a smiley face is placed above the candle where the pattern formation has completed.
Don't forget that the indicator only checks patterns based on the relationships between the key elements of the candle. Thanks to it, you will not miss a single pattern, but each one must be checked manually - not all marked patterns are worth taking into work.
You can download the Price Action indicator here
Psychology of the majority
The psychology of the majority drives the price. Gather millions of people from all over the world, give them access to a computer and the ability to open trades to buy or sell. This is trading. Of course, making a profit from price movements is a completely different matter. It is we who must decide whether a given instrument will trade higher or lower. Essentially, all actions of market participants are reflected in the price movement on the chart.
What happens when the EURUSD currency pair approaches a level that has acted as resistance for the past six months? If it's an obvious level, it will likely attract a lot of traders. Each of them will see a given resistance level. You may not have marked it on your chart, but it's still there.
Key support and resistance levels are available to everyone. While individual indicators or combinations of indicators differ from one trader to another. How many indicators are there in total? 500? Or 5000? Their number is infinite. Everyone can create their own indicator. That is, for each trader the indicator signals will be different.
As I wrote above, indicators may give incorrect signals if the market situation changes. If your indicator-based strategy performs well in a trending market, it may fail when markets enter a consolidation phase. For price action traders, key support and resistance levels are universal. They reflect the psychology of the majority and work in any market phase.
Volume
Also the simplest and one of the most popular is Volume, or in other words, volume.
There is no specific trading method for this indicator, but it helps a lot with the concept of the overall picture of supply and demand. Based on it, you can understand what the mood of the market is today and in which direction it is necessary to open transactions.
Technical indicators complicate things
I have written more than once that trading should not be too complicated. However, most traders like to complicate things.
Let's see how the MetaTrader platform, perhaps the most popular trading platform among Forex traders, greets us after installation:
We immediately see four eyes of charts with indicators.
I'm not saying that technical indicators are bad per se. The problem is that many traders overuse them. They add four or five indicators to their chart, watch for crossovers or oversold and overbought levels, and only then make trading decisions. They don’t even pay attention to which currency pair they are currently buying or selling.
These traders typically end up with nothing but losses after a month or two. Then they start looking for a new indicator or perhaps a completely new trading strategy. And with the endless number of indicator combinations, it's no wonder that many never find what they're looking for. It's a vicious circle.
I believe that every new endeavor has its learning curve. For some, this process may last several months, and for others, several years. The process of learning to trade usually takes years.
When you use indicators, it will be very difficult for you to understand why they are not showing profit. Let's assume that we are using a trading system based on MACD, RSI and moving averages. So far our trading system brings only losses. But we really want to make a profit from it. It will be incredibly difficult to determine which indicator is the problem. Perhaps our results are spoiled by one indicator, or perhaps two or three. There are hundreds, if not thousands of technical indicators available for the MetaTrader platform.
In fact, the solution is to remove each of the indicators from the chart. Exactly each of them.
You can add one or two indicators later. However, first you need to learn to understand price movement. Otherwise, you won't know if the indicators actually work or if you just like them because they look cool.
Let's face it: most new traders choose indicators for their appearance, not for their practical use.
I can say with confidence that adding indicators without understanding price movement is a mistake.
MACD
This indicator consists of two moving averages and a histogram with a zero level. It combines the ability to trade with a trend, like moving averages, and the ability to trade with divergences, like RSI.
The trading method is no different from similar indicators described above; it only combines their best functions.
Technical indicators I use
The only technical indicators I sometimes use are exponential moving averages (EMAs) with periods of 10 and 20. You will never see any MACD or RSI on any of my charts.
Why 10 and 20 EMA? I primarily use these moving averages to determine the price average.
In mathematics, the average is the number between the smallest and largest of their values. This is the "central" meaning of any set of numbers. So if we had a set of numbers 1, 2, 3 and 4, the average would be 2.5. We get this by adding four numbers and dividing by four:
(1 + 2 + 3 + 4) / 4 = 2,5.
What does this have to do with the market? The price always tends to return to its average value. This is not even a probability, but a mathematical pattern.
With this in mind, I use the area between the 10 and 20 EMA as an average during trends. This helps me avoid buying or selling at price extremes.
Notice how the price reverts to its mean before taking the next step and moving on.
The concept of mean reversion is one of my general rules for taking a trade in a trending market. If the price is too far from its average, I stay on the sidelines, no matter how attractive the entry points are.
Adaptive Jurik Filter
We like:
- Djurik's adaptive filter is known as Mrtools' current favorite indicator.
- This indicator works accurately and has proven its ability to extract profits from the market.
- A wide range of options are available.
- Can be used by all traders right out of the box.
Flaws:
- This is an incredible indicator for technical analysts that includes many advanced trading options that can overwhelm new traders. For novice analysts, caution is advised when using advanced tools such as this one.
Dependence on indicators
Many traders do not know how to use indicators correctly. They believe the answer lies in the "right" combination of indicators that will make them rich.
So they test many indicators and after many unsuccessful attempts they wonder why they are losing money.
Indicators are derived from price. They simply tell you what has already happened in the market, not what will happen. So, no matter how many different indicator combinations you use, you will never be a profitable trader if you rely only on trading indicators to make decisions.
Technical indicators are designed to help your decision-making process, not to make market entry decisions for you.
Auto Fibonacci
What we like:
- The ideal training tool and guide for new traders wanting to practice Fibonacci drawing.
- Lights on the trading floor.
- Automatic Fibonacci indicator with alerts.
- The only automatic Fibonacci indicator that draws Fibonacci correctly, as shown in our Fibonacci guide.
What we don't like:
- It can be a little confusing for beginners at first.
How often are you wrong?
You might think, “Look how strong the signal is.” “All three indicators point in the same direction.” “The market is going to move higher.”
Sorry, but you are wrong. And this is the wrong way to use technical indicators. Why?
Because the RSI, CCI and Stochastic indicators belong to the same category (they are called oscillators).
This means that the values of these indicators are calculated using similar mathematical formulas, which explains why their lines move in the same direction. Therefore, do not think that the signal is “strong” because numerous indicators confirm this.
Lower & Higher timeframe Ichimoku
We like:
- By far the best and most complete Ichimoku indicator for Metatrader 4.
- Superbly coded and tested by an experienced trader.
- Allows traders to display any Ichimoku timeframe on their charts, including smaller ones on higher timeframes.
- Comes with different options that you will ever need.
- The ideal all-in-one trader indicator. If you are a trend trader, this is all you will ever need for your charts.
Flaws:
- Overall, new traders may find that the full Ichimoku display can be overwhelming and confusing. For beginners, it's best to start with just the Kumo cloud on the graph and then slowly explore each additional display individually as your experience improves.
Don't copy other traders
There are profitable traders who use technical indicators in their trading. And you're probably thinking, "Since they make money with these indicators, why don't I just copy them?"
You try to use the same indicators, trading settings, instructions, etc. But you still lose money. Why?
Because you only see the surface and not the full picture.
Here's an example:
Vitya is a profitable trader who relies on technical indicators to determine when to enter and exit the market.
Now, the reason why Vitya trades successfully using indicators is not because he found the “ideal” settings or anything else. Rather, it is because he knows how different indicators are correct for different market conditions.
So if you blindly follow what he does, when the market changes, your trading indicators will stop working and then you will have a drawdown.
Black Gold indicator
This tool is interesting because it allows you to find out the price of oil in rubles. This gives traders a couple of interesting opportunities.
In order for the indicator to work correctly, it must be attached to the oil chart, that is, to the Brent/USD chart (in the terminal it will be designated as BRN or Brent). In the settings, be sure to indicate the name of the USD/RUB currency pair. As a result, the indicator multiplies 2 fractions Brent/USD x USD/RUB = Brent/RUB. The Trading View service provides the same opportunity, but you will have to pay about $30 per month for access to full functionality. Here you have the opportunity to get a spread chart absolutely free.
After launch, if everything was done correctly, you will see this picture. The price of oil in rubles is displayed at the bottom.
There are several use cases:
• look for discrepancies in the oil price chart in dollars and rubles and trade on the assumption that this discrepancy will certainly smooth out;
• you can reduce the scale as much as possible on the indicator itself, outline oversold/overbought zones and trade at the output of the indicator line from them. The idea is this: when the price in rubles rises too much and reaches extreme values, the fall of the ruble may stop. When it is possible to earn less and less for oil in rubles, the Central Bank may slightly lower the ruble in order to equalize revenues to the state budget in rubles. After all, the Russian budget is set in rubles, so by regulating the exchange rate of the national currency, it is possible to regulate budget revenues.
You can download the Black Gold indicator here
How do professional traders use technical indicators?
At this point we have learned that technical indicators should not be the basis of your analysis and why you should not copy other traders. Now the question arises, how to use indicators correctly?
The secret is to categorize the indicators according to their purpose and then use the appropriate trading indicators. You can use them for:
- Filter market conditions.
- Significant area definitions.
- Search for entry points.
- Managing your transactions.
Chaos Visual Averages
We like:
- Excellent accuracy and ability to predict tops and bottoms even on the smallest time frames.
- Visually pleasing and easy to see market conditions.
- Strong back testing results.
- Alerts.
Flaws:
- Extreme overbought and oversold conditions can cause traders to enter prematurely during strong trends, resulting in drawdowns before the trends finally come to an end.
How do indicators help filter market conditions?
All trading strategies can work for some time. But no trading strategy can work all the time.
Therefore, you must know the appropriate market conditions in which your trading strategy will work and avoid market conditions in which it will be ineffective. This is where technical indicators can help you.
The moving average is a trend tracking indicator that can be used to filter trends in the market. For example, if the price is above the 200-day moving average, the market is in a long-term uptrend.
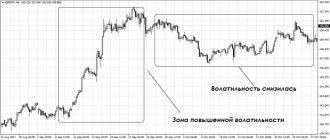
The ATR indicator measures volatility in the market and can be used to identify low or high volatility. For example, if your trading strategy performs well in low volatility environments, then look for ATR values trading at 52-week lows.
Jurik PPO Laguerre
We like:
- Accurate forecasting of tops and bottoms on all timeframes.
- Added Jurik Smoothing, which helps eliminate false signals.
- Beginner-friendly and easy to assess market conditions at a glance.
- Extremely versatile.
- Looks good on charts.
Flaws:
- Scalpers often find that extreme signals are few and far between.
- No alerts (yet).
Using Indicators to Find a Significant Area
You're probably wondering, "What is a significant area?"
Well, this is an area on your chart where potential buying or selling pressure could occur. For example, price action traders use support and resistance levels, trend lines, and price channels to identify a significant area.
However, you can also use indicators.
The RSI indicator is a momentum indicator that allows you to measure price movement over a certain period of time. It is useful to apply to the stock market. When stock prices fall, they tend to continue a long-term upward trend.
Therefore, one way to identify a price rebound is to look for trade setups when the 10-day RSI crosses below 30.
One trading indicator can be useful for several purposes, such as the moving average. How does a moving average help identify a significant area?
In a trending market, price rarely retests previous support or resistance. This is where the moving average comes into play. In a healthy trend, price tends to find support near the 50-period moving average.
In a strong trend, the market tends to find a significant area near the 20-period moving average. In a weak trend, this could be a 200-period moving average.
Trader Dynamic Index indicator
This indicator is a successful combination of several standard MT4 tools. Thanks to the original approach, it was possible to obtain an algorithm that produces reliable signals.
TDI uses:
• standard relative strength index (RSI) indicator, but it is smoothed using a moving average;
• Bollinger bands are used to estimate volatility, that is, the amplitude of fluctuations in the smoothed RSI is estimated.
There are many settings, but the indicator’s performance is most affected by:
• RSI period - by default the period is 13, the author does not recommend going beyond the range of 8-25 when changing the period;
• RSI price – at what prices RSI will be calculated, you can leave the default value;
• Volatility Band - the period of Bollinger bands; as the period decreases, the lines react more strongly to price movements;
• RSI Price Line and RSI Price Type – fast RSI smoothing period and smoothing type, by default a simple moving average is used for smoothing;
• Trade Signal Line and Trade Signal Type – the same, but for slow RSI.
Other parameters affect the visual component.
After launch, the trader will see the following picture:
• blue and yellow lines on the chart are the boundaries of Bollinger Bands and the midline of BB, respectively. Moreover, Bollinger Bands are built on the basis of a regular, unsmoothed RSI, although it is not displayed on the chart;
• green line – fast RSI; an MA with a short period was used for smoothing, so it looks broken and reacts faster to price changes;
• red – signal line, a heavier moving average was used.
Ways to use the indicator:
• trend determination. If the fast RSI line crosses the signal line from bottom to top, then a short-term upward trend is possible in the market. The midline of the Bollinger Bands can be used as an indication of the long-term trend. In addition, it is almost always in the range between levels 32 and 68, so if it has come close to one of them and is preparing to reverse, then a reversal is also possible in the market;
• volatility can be judged by the distance between the BB bands. During a flat they narrow, and during a trend they diverge.
As for signals, to work on small time frames and with small goals, you can limit yourself to the intersection of the slow and fast RSI lines (additional filter - both lines must be above the yellow BB line). You can try the option of medium- and even long-term operation by introducing an additional filter in the form of placing all lines above level 50.
You can download the Trader Dinamic Index indicator here
How to use technical indicators to find entry points?
Most price action traders are familiar with various trading methods. For example, they know how to trade a breakout, pullback, or market reversal.
But when the time comes to pull the trigger, doubts often arise because the price movement does not look convincing.
- The candle may not be large enough.
- Perhaps the candle is bearish and not bullish.
- Perhaps the upper shadow of the candle is too long.
So you need an objective entry trigger so you don't have to guess.
Stochastic is a momentum indicator (similar to RSI). When its value exceeds 30, it indicates that bullish momentum is underway, and this can serve as a bullish entry trigger to enter a long trade. If it crosses below 70, there is bearish momentum and it can act as a bearish entry trigger for a short trade.
Trade setup and entry trigger are two different things. You must first have a valid trade setup and then look for an entry trigger to enter the trade, not the other way around.
The Donchian Channel is a trend tracking indicator developed by Richard Donchian (a pioneer in trend trading).
By default, it plots the highs and lows over 20 days, so you can easily determine the high or low price for the last 20 days. This is useful for breakout traders as you can time your entry when price reaches the upper Donchian channel or sell when it reaches the lower one.
Heikin (Heiken) Ashi
Heikin Ashi is a useful indicator of the price oscillator family. To determine the trend and its strength, the indicator uses Heikin Ashi values instead of the “net price”. This is an additional signal line that is used to achieve the following purposes:
- Use it as a signal line at intersections with the oscillator.
- To smooth values and filter out some false signals, since oscillator values are prone to rapid fluctuations (nervousness) against the background of a natural lag.
Heikin Ashi is developed on the basis of ordinary Japanese candles, but the method of constructing candles itself is unusual. And visually, the opening and closing points of Heikin Ashi candles do not always correspond to the same points on the charts of “classic” Japanese candles.
The opening price of a Heikin Ashi candle (HA candle) is the smoothed value of quote fluctuations in the range between the opening and closing of the previous HA candle. Thus, the opening and closing prices are first added and then divided by 2. The indicated prices are taken from the previous HA candle.
The closing prices of an HA candle are the average of all indicators of a regular candle. That is, this is the minimum, maximum, as well as the opening and closing prices of the timeframe. Divide them by 4 and get the closing price of the HA candle.
The maximum price is obtained by comparing the parameters of the maximum of a regular Japanese candle with the opening and closing prices of an HA candle. The minimum price is obtained by comparing the minimum of a regular candle with the opening and closing prices of an HA candle. To make it more informative, HA candles are colored differently than regular Japanese candles. When analyzing, you need to take into account the shadows of candles.
With Heikin Ashi, trend reversals are easy to recognize. To do this, you need to draw a trend line and highlight the rollbacks in the trend. The lower shadow indicates where to set Stop-Loss. And Take Profit is usually set around the support/resistance level
How to use indicators to manage trades?
Trade management is an integral part of successful trading. Even if you have the best entry points, if you manage your trade poorly, you will still end up with a losing trade.
When you set your stop loss, it can't be too tight, otherwise you'll be taken out of the market by random price movements. Instead, you should let the price breathe. And here the ATR indicator comes in handy.
- Determine the nearest price structure (for example, support and resistance levels, trend line, etc.).
- Set your stop loss at 1 ATR from the price structure.
The price structure acts as a "barrier" that prevents the market from moving against you.
However, this "barrier" is not a specific level, and you cannot know for sure how far the market may move. This is why you can use the ATR indicator to give the price some buffer.
The exit from the chandelier is a trailing stop indicator. It calculates the current ATR value and multiplies it by a certain factor.
The coefficient can be any number, such as 3, 4, 5, 10, etc.
If you choose a factor of 3, then the chandelier's output will be built at a distance of 3 ATR from the maximum or minimum. And if the price closes below the chandelier exit, you will exit your trade.
If you want to trade a longer-term trend, use a higher odds value, such as 5, 6 or 7. And if you want to trade a shorter-term trend, use a lower odds value.
Chaikin Oscillator
Like other oscillators, the Chaikin oscillator works using an identical technique. What distinguishes it from others is its more accurate construction method and the ability to use it on local trend movements.
Basically, all transactions are carried out when the zero mark is passed. Crossing from bottom to top means buying, and crossing from top to bottom means selling.
How can you combine technical indicators?
We learned that every technical indicator has a purpose, be it to identify market conditions, entry trigger, trade management, etc. How can indicators be combined for better results?
So here are two rules to follow:
- Every indicator on your chart should have a purpose.
- You should only have one indicator for each goal.
A mistake that almost all new traders make is adding many indicators to their charts regardless of whether they have a target or not. But as you know, having more indicators doesn't mean anything. Instead, they only add noise to your trading and make market analysis more confusing.
If you want to identify a trend, you can look at the moving average. If you want to time your entry, you may want to consider Stochastic or RSI. If you want to track your stop loss, you might consider a chandelier exit or a moving average.
If you have an indicator on your chart and you can't find a target for it, remove it from the chart.
You don't need to use multiple indicators from the same category because they are correlated and do not provide any new information.
If you want to track your stop loss, you can use either the moving average or the chandelier exit, but not both. Or if you want to time your entry, you can use the RSI or Stochastic indicator, but not both together because they have the same goal.
What is the best way to trade – with indicators or on a “pure” chart?
Charts of currency pairs or other assets provide the same price data that is used in indicator formulas. This allows the experienced eye of a trader to visually identify entry or exit signals without additional tools.
Such trading can be compared to weather forecasting by folk signs by a resident of the outback or diagnostics “by ear” of engine operation by an experienced auto mechanic. However, none of the professionals rely entirely on “feelings”, supporting their forecasts with the readings of weather instruments or computer diagnostics of the car.
Even a professional trader can miss a signal on a “clean chart”. The use of formulas allows you to automate technical analysis, increase the number of simultaneously traded instruments, reducing the number of errors, and reduce losses.
A system created based on indicators can be programmed as a trading robot that will take trading to a completely different level. Even a beginner can understand signals from the intersection of the Moving Average or oscillator zones. They will help him find unambiguous entry/exit points and will not allow a professional to miss a deal.
Some signals, such as divergence, cannot be seen with the naked eye. You cannot refuse to monitor the long-term indicator - the moving average with a period of 200 days, which has become a “template” for institutional investors.
Trader evolution
Everything you need to know about price movement is right in front of you. If you want to become a professional trader, you need a clean chart. Otherwise, you will spend your time sifting through useless technical indicators rather than studying price action.
Trying to create a working strategy based on indicators is incredibly difficult. By using simple price action patterns, you can reduce your learning curve by at least half.
If you feel deep down that indicators are the way to go, that's okay. Just be sure to spend some time learning about price action. This will help you in the long run, even if you decide to use an indicator-based strategy.
Whatever you do, be simpler in your trading. Learning to trade doesn't have to be a difficult process. Everything should be just the opposite. First, learn a few patterns. Add an indicator or two if you like, but remember that price action is all you need to make consistent profits.
Super Smoothed Averages Trend
We like:
- Possibly one of the best trend trading, moving average style, indicators today
- High accuracy for catching trend movements.
- Can be "stacked" so that multiple instances of this indicator can be placed on a chart to form waves, crossovers and more (example here).
- Comes with multi-timeframe and interpolation.
- Includes alerts and push notifications.
Flaws:
- For new traders, it can be difficult to determine which stacking setups and combinations are best.
- Not too much information has been conveyed regarding how this tool was coded or exactly what it consists of.
Hull Moving Average Mountain Histogram
We like:
- Accurate and beginner-friendly trend trading.
- Tried and tested Hull's moving average formula.
- Works very well for swing trading using a multi-timeframe mode (our favorite is the 4-hour MTF displayed on the 30M chart).
- Comes with advanced pricing options, custom widths, average types, and beginner rows.
Flaws:
- Nothing special, other than the fact that this is an often overlooked metric that deserves more confidence.
Loading Dashboard
To get your use of the best Forex indicator that currently exists, just follow this LINK. The downloaded archive with the tool must be unpacked and placed in the terminal. To do this, launch MT4, click on the “File” menu in the upper left part and select “Open data directory” from the drop-down list.
As soon as a new window opens, click MQL4 – Indicators. As a result, a list of all indicators installed in MT4 will be displayed, and this is where you need to move the previously unzipped Day Trading Dashboard.ex4 file.
After this, the MT4 terminal needs to be closed and launched again. From this moment of installation, the indicator will be displayed in the “Navigator” window on the left side of the platform’s working window and in the menu item “Indicators” – “Custom”.
List of the best trading indicators
To offer you an overview of the existing Forex indicators, we will add a table with the different categories and some of the indicators considered to be the best (or at least the most used).
| Forex trend indicators |
|
| Forex Oscillators |
|
Best Trading Indicators - Fibonacci Sequence
This indicator, also considered one of the best trading indicators, is based on the idea that after an aggressive move, the market will have a high probability of reversing in appropriate proportions.
These proportions come from the Fibonacci sequence.
The Fibonacci series is a sequence of numbers known since ancient times, but popularized by Italian mathematician Leonardo Fibonacci. The sequence starts with 0 and 1. Any subsequent number is the sum of the two previous numbers in sequence.
Fibonacci numbers look like this - 0, 1, 1, 2, 3, 5, 8, 13, 21, 34, 55, 89, 144, 233...
The interesting thing about this series is that a certain pattern is always observed: no matter what number we take from the series, its ratio to its neighbors tends to 0.618 and 1.618, and the larger the number itself, the more accurately this ratio is fulfilled. If we compare any number with its neighboring ones forward and backward, it turns out that their ratio is 0.382 and 2.618. And after two: 0.236 and 4.236.
Source: GBPUSD, H1 Chart, MT5 Admiral Markets. Data range: August 23, 2022 to September 10, 2022. Accessed September 10, 2022. Please be aware that past performance is not a reliable indicator of future performance.
The lengths of price movements in financial markets continuously fulfill any of the above relationships.