You are probably familiar with Fibonacci levels? Whether you use them to complement your trading strategy or simply plot them on your chart to confirm key support and resistance levels, they can always be useful in technical analysis.
Who is Fibonacci?
How does the Fibonacci sequence work?
Fibonacci retracement levels in action
How to use Fibonacci levels in combination with horizontal levels and price action signals?
How to determine market turning points using Fibonacci levels?
How to find market tops using Fibonacci levels?
Fibonacci levels and increased volatility
Avoid false signals
The 50% retracement phenomenon
Rebound from 50% Fibonacci level with pin bar
Who is Fibonacci?
Leonardo Bonacci (better known as Fibonacci) was born around 1170 and was one of the most talented mathematicians of his time.
Not only did he develop the Fibonacci number sequence that all traders are familiar with, but he also popularized the Arabic number system in the Western world. However, his main achievement is considered to be the study of Fibonacci numbers.
Leonardo Fibonacci discovered that a simple series of numbers could be used to describe a wide variety of proportions in nature, from exploring the universe to determining the curvature of snail shells and the structure of plant seeds.
"Son of the Lucky Man"
This is exactly what, according to scientists, one can call Leonardo of Pisa, nicknamed Fibonacci. This nickname means that he is the son of Bonacci (“Bonacci” translates as “lucky one”). A very funny fact, considering how many people he made happy indirectly, contributing to the development of mathematics, economics and other fields of knowledge in which his discovery is now widely used.
This medieval Italian made such a great contribution to the development of modern science that it is very difficult to overestimate him. Every day, more and more scientific research only confirms the principle that he clearly showed to the whole world in the form of numbers.
Leonardo of Pisa is famous for introducing his sequential series of numbers, which constantly tends to the golden ratio.
How does the Fibonacci sequence work?
Most traders do not understand how the Fibonacci sequence works. After all, trading platforms provide us with a Fibonacci extension tool that already has built-in math functions. All we have to do is click on the button and drag the Fibonacci extension onto our chart. However, let's try to understand its patterns.
The Fibonacci number sequence looks like this:
0, 1, 1, 2, 3, 5, 8, 13, 21, 34, 55, 89, 144, etc.
Each number in this sequence is the sum of the two previous numbers:
0 + 1 = 1 1 + 1 = 2 2 + 1 = 3 3 + 2 = 5 5 + 3 = 8 etc.
What's special about this? Each number in the sequence is approximately 1.618 times larger than the previous number. Thus, although all the numbers are different, they have one common pattern.
If you are familiar with Fibonacci retracement levels, you know that the value of 1.618 or 61.8% is extremely important. The number 1.618 is called the “golden ratio” or “golden mean”.
The 38.2% ratio is obtained by dividing any number in the row by the number placed two positions to the right:
0, 1, 1, 2, 3, 5, 8, 13, 21, 34, 55, 89, 144, etc.
13 / 34 = 0,382.
The 23.6% ratio is obtained by dividing any number in the row by the number placed three positions to the right:
0, 1, 1, 2, 3, 5, 8, 13, 21, 34, 55, 89, 144, etc.
13 / 55 = 0,236.
This gives us ratios of 61.8%, 38.2% and 23.6%.
So what makes these ratios so special? This is still unclear. These ratios play an important role both in nature and in financial markets. We can use Fibonacci extensions to identify key levels at which price may reverse.
What does a snail's shell have in common with graphs? That's right, they are related to Fibonacci numbers. The profit you just made from selling EURUSD at the 61.8% Fibonacci level can largely be attributed to studying plants, flowers and even snail shells. These levels that we use in our charts were first studied in nature. After all, Fibonacci himself was never a trader.
However, it should be noted that not all graphs show these patterns. You will find that some currency pairs respect these levels more than others.
Bonacci tried to find a numerical order to bring order to the chaos in the world around him. In the world of trading, its sequence of numbers helps explain patterns of price movement. Ultimately, technical analysis and our actions as traders depend on repeating price patterns, patterns and levels.
How to add the Fibo indicator to a price chart
To add a Fibonacci grid to a chart in the MetaTrader4/5 trading terminal, just select the following path in the main menu: “Insert/Fibonacci/Lines”. To insert the indicator into the right place, hover the mouse cursor over it, hold down the left button, hold and drag until the extreme points are correctly identified.
To configure the indicator, right-click on any place on the chart and select “List of objects/Fibo/Properties”. After placing levels, sometimes you need to remove them. To do this, right-click on any place on the chart and select “List of objects/Fibo/Delete”. The grid will disappear.
To install Fibonacci in the QUIK trading platform, you need to find a special toolbar or install it in the context menu on the panel using the “Chart” item.
Next, just left-click on the desired toolbar icon, stretch the grid, and then in the settings window that appears, create an appearance and select parameters.
Fibonacci retracement levels in action
Fibonacci retracement levels are most effective when used at the highs and lows of price movements.
The price high is used as the starting point of the expansion and the low as the ending point. As you noticed, the price constantly takes into account Fibonacci levels.
In addition to the ratios we discussed above, many traders also use the 50% level. Although not a Fibonacci ratio, the market does have a tendency to continue moving in a certain direction after a 50% retracement. Therefore, the 50% level has been added to most Fibonacci extension tools.
Golden ratio
This is a proportion that can be graphically represented as a line segment divided into two parts by a dot. The most important rule of division: the entire segment is related to its larger part in the same way as the larger part is related to the smaller one.
That is, the point will divide the segment in such a way that if we divide the entire length (the sum of the parts) by the size of the larger part, we get the same number as when dividing the larger part by the smaller one.
Dividing always results in the same result: 1.618. It is called the Phi coefficient.
How to use Fibonacci levels in combination with horizontal levels and price action signals?
Common questions among traders: Do Fibonacci extension levels really work and are they useful? I can say without a doubt that they work and can be useful, but only if used correctly. Let's look at how you can use Fibonacci levels in combination with price action.
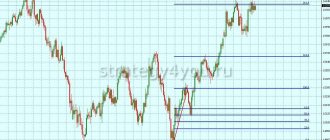
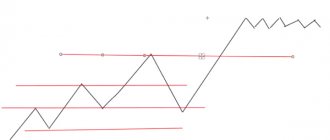
In the chart below, we are using the major low of the price movement as the starting point and the major high as the ending point. These two points are the most noticeable on the graph:
It now becomes apparent that there are several clearly defined levels on the chart.
Notice how the Fibonacci levels of 38.2, 50 and 61.8 coincide with the horizontal support and resistance levels from which the price rebounded. This gives us additional confidence that the market can reverse at these levels.
Fibonacci levels should never be used by themselves. Like everything else in technical analysis, Fibonacci levels are just another structural factor we can add to our trading toolbox.
We can use the Fibonacci tool to further confirm the price movement. Think of it as another look at the market and focus primarily on the horizontal levels that should already be drawn on your chart.
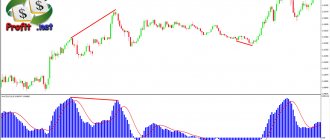
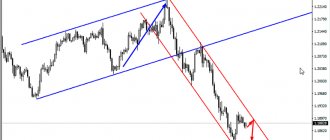
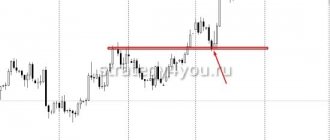
In the example below we see how the market continues its movement between two levels:
Now we can use the Fibonacci extension tool to see if any more levels match:
Once we draw the Fibonacci levels, it immediately becomes apparent that the 23,6 and 50 levels perfectly match our horizontal levels that we identified earlier. This gives us greater confidence that any price movement towards these levels should lead to an increase in demand and is more likely to cause some kind of market reaction.
What to do if Fibonacci levels do not coincide with support and resistance levels? They may also play a role, they just won't be the key levels to look at first.
As you can see in the chart above, the levels of 38.2 and 61.8 became the reason for the price rebound in the subsequent period.
You can also use the Fibonacci extension tool to find key levels that you may have missed. The key to using the Fibonacci tool effectively is to only use it on higher time frames. That is, daily or weekly charts.
Using the weekly chart, we can clearly see that the 148 level is a key horizontal level:
Now let's drag the Fibonacci tool from the low to the high to see if there are other levels:
The first thing we should notice is that the 50% retracement level does not correspond to the level we predetermined. But it normal! Remember that the obvious horizontal level will always be more important than the Fibonacci level.
Pj we look at levels 23.6, 38.2 and 61.8. At first glance, you can see that the 61.8 level is trying to tell us something. Let's draw a horizontal level above the Fibonacci retracement level of 61.8 and see:
It is now clear that this is a key horizontal level that we need to pay attention to. The chart above shows how the current 61.8 Fibonacci retracement level has impacted market movements over the past few years.
Now it's time to find the price action signal at the confluence level.
It is clear that the 50% level is ideally in line with the recent highs of the price movement. Therefore, we mark this level on our chart and watch the price if it returns to this area.
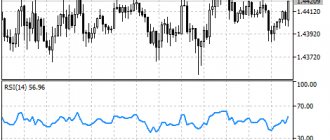
Two months later, the market returns to the resistance area of 1.005 and a bearish pin bar is formed:
Notice that the market is again finding support at the 23.6 Fibonacci level.
This is a great example of how we can profit from using Fibonacci retracements in combination with price action.
In many ways, the reason why Fibonacci levels are so effective is still a mystery. However, in technical analysis we don't necessarily need to know why something works. We can simply use this tool and benefit.
Don't forget that Fibonacci retracement levels only work and can be extremely useful in combination with other trading strategies like price action.
The effectiveness of this combination can be explained by the fact that these instruments are widely used by many traders, which causes a certain market reaction.
Summary
Fibonacci correction is a good analytical tool , but its effectiveness directly depends on the trader. If you do not use filters that confirm the reversal of Fibo levels, their effectiveness will be low. Research by Adam Grimes proves that without filtering signals by Fibo levels, their value decreases .
I note that this tool is suitable for all systems without exception . It can act both as a filter when added to an existing vehicle, and as the basis of a strategy when building it from scratch. To strengthen your skills in working with Fibo levels, I recommend working with history and practicing trading using signals of this type on a demo account .
If anything remains unclear, ask questions in the comments. There you can also offer your ideas on Fibo levels and share your experience of working with them - this will be useful to other readers.
If you want to keep abreast of updates to my blog, subscribe to the telegram channel . With it you are guaranteed not to miss the release of new materials. With this I say goodbye to you. Good luck in conquering the financial markets, and see you soon!
If you find an error in the text, please select a piece of text and press Ctrl+Enter. Thanks for helping my blog get better!
How to determine market turning points using Fibonacci levels?
Most traders plot Fibonacci levels on a 1-hour or 4-hour chart that spans several days or several weeks. In addition, these same traders use Fibonacci extensions only after the price makes a pullback. However, in doing so, they lose sight of the overall market context.
For example, you plot Fibonacci retracement levels on a daily chart of NZDUSD during an uptrend and find price matching at several levels. Remember that we do not use the Fibonacci tool to find key levels, but only to further confirm them.
Our graph will look something like this:
We then use the Fibonacci extension and drag the levels from the low to the last high:
All three levels coincide with the Fibonacci numbers 61.8%, 50% and 38.2%.
Most traders are looking at potential buying opportunities at one of the confluence levels. After all, the market is in an uptrend.
However, we then see a bearish flag where the Fibonacci levels coincide with predetermined support areas. If the market rises above the current high, the Fibonacci levels will not match our support levels. Essentially, we use the overall market picture combined with the Fibonacci tool to identify major turning points.
Remember that technical analysis is only valid in the overall market context. What looks like a buying opportunity may well turn out to be a sign of weakness in a secular downtrend.
What to do when the currency adjustment process occurs
The main reasonable actions when correcting cryptocurrencies are as follows:
- Analyze whether this is a correction or a decline/growth of the exchange rate.
- Analyze how long the process can continue.
- If you are proficient in technical analysis tools, carry out additional calculations.
Next, the investor should, if he is the owner of the asset, not to panic, make a rough forecast for himself and develop a strategy according to which:
- He will try to make money on this or will not try, since the process is so unpromising that it is better to wait it out;
- He will sell assets upon reaching a certain point if the correction turns into a recession, or he will not sell them.
The strategy depends on the asset, the size of the correction, trends, forecasts and the temperament of the investor. He should choose whether to enter the market now or wait a little longer. In this case, it is especially important to be sure that this is a correction, not a recession, and that the trend is unlikely to reverse
We looked at what a market correction is on the stock exchange and how to build a Fibonacci grid. A correction in the cryptocurrency market may be predictable as a phenomenon, but it is often not very predictable as a process. Therefore, it is better to have a strategy for all cases and monitor what is happening around the digital asset, because during this period external factors have weight and often determine whether the previous trend will continue or reverse.
How to find market tops using Fibonacci levels?
Highs and lows of price movements are not often seen on charts.
The GBPJPY weekly chart shows the simplicity of my method. I simply dragged the Fibonacci extension tool from the swing low to the recent high. Let's take a closer look at what's going on here.
Notice how each Fibonacci extension level coincides with the highs or lows of the price movement. This is a clear signal that the market has reached its top and is likely to reverse soon.
Here's another example:
Notice how the 38.2% and 50% Fibonacci retracement levels line up perfectly with important horizontal support and resistance levels. This again is not a mere coincidence. This pattern indicates that the market has reached its peak.
Here's what happened next:
The price fell by 1600 points.
How did I know the price had reached its multi-year high? Since the two Fibonacci retracement levels coincided perfectly with the highs and lows of the price movement, this was an obvious hint that a major reversal was coming in the market.
golden rectangle
An ideal rectangle, from the point of view of the Fibonacci spiral, has sides whose lengths are proportional to each other precisely according to the phi coefficient. In other words, when dividing one side by the other, the result must necessarily be 1.618 or 0.618 (the reciprocal of the phi coefficient).
Such rectangles are quite common in architecture and composition. It is also interesting that these are the ones that most people consider “ideal” or “correct” from a visual point of view. In other words, a person intuitively perceives these proportions as more beautiful and natural, pleasing to the eye. Even when it comes to geometric shapes.
Fibonacci levels and increased volatility
Technical analysis is a mixture of art and science. And while we don't know exactly why it works, one thing is clear: it relies on the perception of the market by the majority of traders. A level or pattern that is obvious to one trader is also obvious to many other traders.
Volatility often has a negative impact on technical analysis, including when using the Fibonacci extension tool.
What happens when a level or pattern is only visible to a small number of traders who trade on the same broker?
Let's look at an example. Which of the two highs in the chart below should be used as a point to determine key Fibonacci levels?
Under normal circumstances we should have used the last price high. However, this maximum will vary between brokers. Note the discrepancy between the Fibonacci levels, which arose due to the different size of the shadow of the super-volatile candle:
The increase in volatility led to the formation of three different highs for the same currency pair with different brokers.
Remember that the forex market is decentralized, which means that there is a high probability of different price values among different liquidity providers, especially if volatility increases greatly. This presents a huge problem for a trader who is trying to determine the true swing high in order to use a Fibonacci extension tool.
Imagine what would happen if three traders tried to draw Fibonacci levels:
We can conclude that Fibonacci extensions only work in certain market conditions when there are no similar spikes in volatility in the market. If you use it during periods of increased volatility, as in the chart above, the tool will be completely useless as it can lead to a false picture when drawing key levels.
What can you do when faced with these types of volatility spikes?
The first and most obvious: do nothing. Remember that your main job as a trader is to protect your trading capital. Plus, you always have dozens of other currency pairs to trade. So no matter how good a trade setup may look, it's good to know that it's likely not the only one.
The next option is to search for correspondence between Fibonacci extension levels and horizontal levels on the chart. This will give us additional confirmation whether these levels have any power.
Where to open an account for Forex trading
This is one of the most popular questions among beginners. Based on my own experience, I can recommend AMarkets .
| Criterion | AMarkets |
| Regulation | The Financial Commission |
| Minimum capital | From $100, €100, 5000 RUB for standard accounts |
| Number of assets | 100+ |
| Recommended capital | $1000 |
| Account currency | USD, EUR, RUB |
| Maximum leverage | 1 to 1000, on ECN – 1 to 200 |
| Spread in points | Floating, from 0 for ECN, fixed from 3 |
| Commission | $2.5, €2.5 or ₽175 for 1 lot one way for ECN |
| Execution speed, ms | 53,3 – 70,0 |
| Stop Out | 20-40% |
| Exiting client transactions to the interbank market | + |
| Number of positions | No limits |
| Pending orders inside the spread | + |
| Requotes | — |
| Limiting the number of transactions | Absent |
| Limit orders inside the spread | + |
| Availability quote | — |
| Own indicators | Cayman (market sentiment) and COT (provides information from the Commodity Futures Trading Commission) |
| Peculiarities | Welcome bonus up to $10,000. Cashback, there are tournaments and other incentives for traders |
I will give the main working conditions in this company in tabular form.
| Company | AMarkets | ||
| Rates | Standard | Fixed | ECN |
| Minimum deposit | 100$/100€ or 5000₽ | 200$/200€ or 14,000₽ | |
| Recommended capital | 1000$ | 50 000$ | |
| Leverage | 1 in 1000 | 1 to 200 | |
| Spread, points | Floating, from 1.3 | Fixed, from 3 | Floating, from 0 |
| Commission | No | 2.5$, 2.5€ or 175₽ for 1 lot one way | |
| Minimum Margin | 1$ | 5$ | |
| Stop Out | 20% | 40% | |
| Exiting client transactions to the interbank market | No | Yes | |
| Ability to place pending orders inside the spread | No | Yes | |
| Requotes | Eat | Their absence is guaranteed | |
| Open an account | |||
Avoid false signals
The best way to avoid false signals is to always use Fibonacci retracement levels on higher timeframes.
I prefer to use weekly or monthly charts to identify possible market reversals. The greater the distance between the highs and lows, the better. Try to cover a distance of at least several years.
Finally, the best way to avoid false signals is to never rely on one trading strategy. There is no better way to use Fibonacci levels. Always ask yourself, does this trading method suit your trading style and personality?
The 50% retracement phenomenon
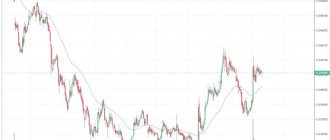
Why do I have such a strong love for the 50% level? Let's remove all Fibonacci levels and leave only the one that has the 50% mark:
Three lines, everything is clear and clear. In a trend, this is the strongest level from which you can squeeze maximum profit with the best entry points.
Why not other levels? For me, one reason is enough: all other levels are not so unreliable, they are often broken, and the stop loss has to be set larger than expected.
To begin with, let's plot this level on the chart, for example, on a 4-hour time frame, let's take one candle for analysis.
Next, let's switch to the hourly timeframe and see what happened there.
As we can see, the price rose exactly 50% and began its decline, while bringing us profit.
For stop loss, I recommend using the 61.8% level, since a breakout of this level is a strong signal that the trend has reversed.