Hello, dear friends! When it comes to the Fibonacci sequence, it is almost called the basis of the universe. It is found almost everywhere, from the structure of a mollusk shell to the geometry of spiral galaxies. Today we will not focus on studying the history and scientific facts related to the Fib sequence, but will concentrate on how to use Fibonacci levels in trading. This tool is built on ratios derived from the basic Fib progression and can form the basis of a profitable trading strategy.
What are Fibonacci levels
Fibo levels are a tool that allows you to determine the end of the corrective movement and target levels when the trend continues (Fibonacci extensions). The position of each level is calculated based on the key ratios of the Fib sequence.
Progression or Fibonacci sequence is a series of numbers in which each next term is equal to the sum of the previous two. The progression looks like this - 1, 1, 2, 3, 5, 8, 13, 21 and so on ad infinitum. Already from the 5th-6th term of the progression, key relationships :
- The ratio of the progression term N to the (N-1) element approaches the number 1.618 as N tends to infinity. For example, 5/3 = 1.667, 8/5 = 1.600, 13/8 = 1.625, 21/13 = 1.615, and the further you move along the progression, the closer this ratio will be to 1.618 , this is a certain equilibrium point.
- The ratio of the progression term N to (N+1) approaches 0.618 as N tends to infinity. For example, 5/8 = 0.625, 8/13 = 0.615…. 610/987 = 0.6180346.
These numbers allow you to determine corrective Fibo levels , and a group of main and secondary lines is distinguished:
- The main ones include 38.2% , 50.0% and 61.8% (0.382, 0.5 and 0.618). The number 0.618 is the ratio of the current and subsequent elements of the progression, 0.5 is the result of dividing the first terms of the sequence. The number 0.382 is the result of squaring 0.618 .
- Secondary - 23.6% and 78.6% (0.236 and 0.786), 23.6% is the result of raising 0.618 to the cube, and 78.6% is the root of 0.618 . They are not considered basic because they are derived from the Fibo progression.
Human body
If you measure the length of your finger and compare it to the length of your elbow, you will find 1.618.
Try dividing your height by the distance between your navel and the soles of your feet, the result is 1.618.
Compare the length from shoulder to fingertip with the length from elbow to fingertip, the result is 1.618.
Compare the length from waist to leg with the length from knee to leg, the result will be 1.618
All human body size comparisons – 1.618
This is true? please prove it.
How it works in technical analysis
Technical analysis involves predicting the behavior of a trading instrument based on quote analysis. It is believed that the price already takes into account all fundamental factors.
In addition to Fibo extensions and levels, channels , fans , spirals , time zones , and Fibonacci arcs . the lines that have become the most popular ; they are used both to determine the end points of the correction and to identify profit-taking zones.
The Fibonacci retracement grid works on any type of asset (stocks, currency pairs, cryptocurrencies, commodity market). As for the reasons for their development, a self-fulfilling forecast plays a role. If a large number of traders use the same technique, then it starts to work. Perhaps the principle of the “ golden ratio ” has an effect; it is found in nature and music. It is possible that this pattern also affects trade.
There are also skeptics . For example, Adam Grimes studied the effectiveness of levels in the stock market and Forex. His research shows that individual lines are not particularly important, but rather the 40%-80% zone plays a role. Its result can be explained by the fact that no additional rules were introduced to identify movements to which Fib lines were applied. Examples of real traders prove that this tool only works in capable hands.
Profitable trading in AMarkets
The structure of sea shells
Scientists who studied the internal and external structure of the shells of soft-bodied mollusks living at the bottom of the seas stated:
“The inner surface of the shells is impeccably smooth, while the outer surface is completely covered with roughness and irregularities. The mollusk was in a shell and for this the inner surface of the shell had to be perfectly smooth. External corners-bends of the shell increase its strength, hardness and thus increase its strength. The perfection and amazing intelligence of the structure of the shell (snail) is amazing. The spiral idea of shells is a perfect geometric form and is amazing in its honed beauty."
In most snails that have shells, the shell grows in the shape of a logarithmic spiral. However, there is no doubt that these unreasonable creatures not only have no idea about the logarithmic spiral, but do not even have the simplest mathematical knowledge to create a spiral-shaped shell for themselves.
But then how were these unreasonable creatures able to determine and choose for themselves the ideal form of growth and existence in the form of a spiral shell? Could these living creatures, which the scientific world calls primitive life forms, calculate that the logarithmic shell shape would be ideal for their existence?
Of course not, because such a plan cannot be realized without intelligence and knowledge. But neither primitive mollusks nor unconscious nature possess such intelligence, which, however, some scientists call the creator of life on earth (?!)
Trying to explain the origin of such even the most primitive form of life by a random combination of certain natural circumstances is absurd, to say the least. It is clear that this project is a conscious creation.
Biologist Sir D'Arcy Thompson calls this type of growth of sea shells the "dwarven growth form."
Sir Thompson makes this comment:
“There is no simpler system than the growth of sea shells, which grow and expand in proportion, maintaining the same shape. The most amazing thing is that the shell grows, but never changes shape.”
The Nautilus, measuring several centimeters in diameter, is the most striking example of the gnome growth habit. S. Morrison describes this process of nautilus growth as follows, which seems quite difficult to plan even with the human mind:
“Inside the nautilus shell there are many compartments-rooms with partitions made of mother-of-pearl, and the shell itself inside is a spiral expanding from the center. As the nautilus grows, another room grows in the front part of the shell, but this time it is larger than the previous one, and the partitions of the room left behind are covered with a layer of mother-of-pearl. Thus, the spiral expands proportionally all the time.”
Here are just some types of spiral shells with a logarithmic growth pattern in accordance with their scientific names: Haliotis Parvus, Dolium Perdix, Murex, Fusus Antiquus, Scalari Pretiosa, Solarium Trochleare.
All discovered fossil remains of shells also had a developed spiral shape.
However, the logarithmic growth form is found in the animal world not only in mollusks. The horns of antelopes, wild goats, rams and other similar animals also develop in the form of a spiral according to the laws of the golden ratio.
How to build a Fibonacci grid on a chart
This tool is integrated into all desktop and web terminals. As an example, let’s look at the rules of working on a live chart from TradingView and in MetaTrader4.
Working with a live schedule
In TradingView, Fibo levels are located in a separate menu “Gann and Fibonacci Tools” . They can also be called with the combination Alt+F .
A clearly expressed is selected on the chart . Fibo levels are extended to it. The construction is always performed so that the zero level is at the right extreme, and 100% is at the left . That is, on a bullish movement the lines are drawn from bottom to top, and on a bearish movement - vice versa.
During an upward movement, the 100% will be at the lower extremum, and 0 – at the upper one . The position of intermediate levels at which there is a high probability of the end of the correction is automatically calculated (the price is marked in brackets).
Double-clicking on Fibo levels opens the settings menu, in it:
- The style is responsible for the main parameters. You can set the color of each line, add arbitrary ones and, if necessary, extend them in both directions.
- Coordinates . Here the prices of 2 points on which the construction was carried out are set.
- Display. The timeframes on which Fibo lines will be visible are indicated. You can limit them so as not to clutter the chart with unnecessary constructions.
As the chart approaches the line, the price behavior is monitored. A reversal signal most likely indicates a continuation of the trend movement.
Fibo levels in MetaTrader 4
The principle is the same as in a live chart - clearly expressed movement is selected and lines are stretched from left to right.
To get to the settings menu, double-click the Fibo levels added to the chart, then right-click to select the context menu . In it, select the “ Fibo Properties ” item. The list of settings is approximately the same as on TradingView:
- General – select the type of lines and their color.
- Fibonacci levels – the lines are specified directly. On the left side - in fractions of a unit, on the right - in percentage (you will see this number on the graph).
- Parameters – settings for the prices of points along which Fibo levels are stretched.
- Display – select time intervals at which constructions will be visible.
The functionality of Fibo levels on a live chart and in MT4 is the same. TradingView stands out only for its large number of visual settings ; this does not affect the value of the tool.
Start trading with AMarkets
Congestion zones
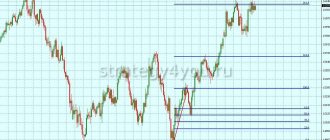
Fibonacci levels (lines) do not have to be laid out in a single copy. On the contrary, if a lot of levels seem to be combined into one, such a level only intensifies.
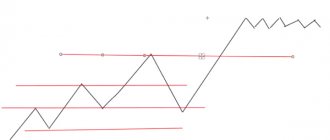
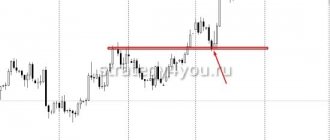
What is meant. There are plenty of peaks on the chart. According to our rules, we must apply a grid from peak to peak, but how can we understand whether we took the right peak, maybe we made a mistake. To do this, it was invented to overlay a grid of several peaks and look for where fibo levels will begin to accumulate. Let's draw.
There are two Fibo grids on the chart. Green ovals show places where fibo levels accumulate, but there are differences in them. Note the lower cluster and the upper one. Obviously, the upper cluster of levels seems to be drawn with one line, and do not forget that we installed two tools. As we can see, it was from the upper cluster that the reversal began.
It is important to note that when using a cluster of fibo levels, you should not overdo it and stretch too many grids, otherwise you may not even see the chart. I can’t answer how many grids are good and how many are bad, you have to come to this yourself during practice. So, the introduction is given, the rest is up to you.
How to choose movements to build Fibo levels
Waves of different lengths and heights are constantly formed on the chart of any asset. For beginners, it can be difficult to determine the movements by which Fibo levels can be stretched. There are several ways to determine such waves:
- Using indicators, for example, Zigzag (standard MT4 tool). It highlights significant movements and Fibo levels can be applied to them. The disadvantage of this indicator is that it does not evaluate market condition generally, highlighting all waves that meet the criteria of duration and distance traveled in points. As for how to use ZigZag, you don’t need to configure it; you just need to attach the indicator to the chart.
- Visually . You can reduce the scale of the graph and identify significant movements by eye The method is not bad, but there is a subjective factor: it depends on the trader which impulses will be chosen for construction.
- By trend. Using indicators, for example, moving averages, the direction of market movement is determined, and Fibo levels are plotted only according to trend waves. The reason for updating the markup is census trend high/low.
It is impossible to completely get rid of subjectivity when constructing Fibo levels . I recommend taking into account clearly expressed, confident, recoilless movements and applying this tool to them.
Also, when constructing, there may be several equivalent options . For example, after reaching a maximum around 1.3005, the GBPUSD pair begins to move in a horizontal corridor, gradually declining. After the formation of a local extremum, an impulsive downward movement develops.
In this situation, it is possible to construct constructions both only on the impulse and on the entire downward movement . Both options work.
Fibo levels work better on trending instruments. For those of you who plan to work in Forex, I recommend reading the post about the main currency pairs. It explains in more detail the features of the main financial instruments.
How to determine the end of a movement
Using this tool, you can determine both the end of the correction and the zones in which the main movement to end . Let's look at this in more detail.
Determining the end of a corrective movement
Fibo levels are used to find the end of the correction. The trader assumes that the main movement will not be interrupted and tries to find a point from which the chart will continue to rise or fall. The priority correction lines are 38.2%, 50.0% and 61.8%. The pullback to 23.6% is insignificant, but to 78.6% is too deep.
There is no point in forcing yourself into a framework by limiting the end point of the correction to a specific level. It is more logical to consider the range in which the rollback movement is highly likely to end. The levels of 38.2% and 61.8% are taken as its boundaries; taking into account Grimes’ research, this range can be expanded to 38.2% - 78.6%.
In simple words, it is not necessary to wait for a rebound from the Fibo level accurate to the point. A turn can be formed with a slight throw beyond the line or with little reaching it. There is no 100% guarantee that after touching, for example, the 38.2% correction level, the rollback will end and the trend will continue.
Open a Forex account in AMarkets
Determining target levels using Fibo lines
There are 2 ways to determine goals based on ongoing movement:
- According to standard Fibo levels.
- Using a separate Fibonacci extension tool.
When using Fibo levels, the rules for their construction change in a mirror way . When determining the end of the correction, the marking is done so that 0 on the right side . To identify target zones, Fibo levels are constructed in reverse - 0 is shifted to the left . If the main movement continues, the target lines are considered to be 161.8% and 261.8%, here you can take profits.
Fibo extensions are built based on 2 correctional and 1 trend extremum . In a growing market:
- The first point is the previous correction low .
- The second is the trend high .
- The third is the next corrective low .
3 lines are automatically drawn on the chart - 61.8% , 100.0% and 1 61.8% , their position is measured from point No. 3. To determine where the 61.8% line will be located, you need to set aside from point 3 the distance in points equal to 61.8% of the length of segment 1-2 towards the expected movement. The lines on which the numbers 100.0% and 161.8% are written are calculated using the same method.
Both can be used in trading . They give different positions of target levels, so close attention to the price action.
Determining the position of SL and TP using Fibo levels
This tool can help not only with determining market entry points, but also with calculating the take profit and stop loss values. In my practice I usually do this:
• I place a stop loss behind the next Fibo level + 5-10 points of reserve in case of a slight puncture of the level by the price;
• take profit can be placed at the levels of 161.8%, 261.8%. Most often, if the price rewrites the extremum of the trend movement, it reaches exactly the level of 161.8%; you can add your own Fibo levels, for example, 123.6%.
As for take profit, in order to squeeze the maximum out of each transaction, I would advise closing the profit in parts. For example, when entering at the end of a correction, the following option for taking profit is possible:
• 30% is fixed during the census at the price of the extremum of the trend movement;
• another third of the total volume is fixed when the price reaches the level of 161.8%;
• the rest of the transaction can be placed on a trailing stop and just wait to see how it all ends. This approach will allow you to get much more than if you closed all your profits at one of the levels. On the other hand, you are insured in case the price does not reach 161.8%, because part of the profit has already been closed.
Trading strategy on Fibonacci levels
Let's look at building a simple system using Fibo levels. You will have to solve several problems sequentially :
- Determine the state of the market. Indicators (ATR, Moving Average, Bollinger Bands and other tools) and graphical analysis can be used.
- Determine the range in which, with a high degree of probability, the rollback will end and the trend movement will resume. For this we use Fibo levels.
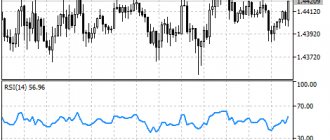
- Select filters that confirm the end of the rollback. Candlestick patterns and indicators can act as such filters . oscillators work well , you can use Stochastic or RSI. Their exit from the oversold/overbought zone confirms the signal from the Fibonacci levels. For beginners, I recommend reading the post “Japanese candlesticks for beginners”, from it you will learn more about the logic of the patterns and their application in trading.
- Develop a methodology for determining target levels . Take profits are placed here or profits are recorded manually.
Let's look at one of the possible deals:
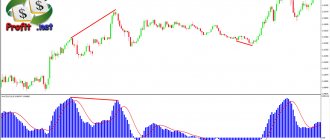
- In the market area under consideration the chart stays above SMA 120, there is a consistent increase in High and Low. This corresponds to a bullish trend; work is limited to buy transactions.
- After the next trend wave, a rollback begins and a local maximum is formed. We stretch the Fibo line to this movement and get a zone in which a chart reversal and a resumption of the bullish trend are most likely.
- After the first testing of this zone we get signal to purchase, but he not confirmed oscillator. Later the chart is adjusted deeper, forming reversal pattern in the highlighted zone, after which the Stochastic line leaves the oversold zone. This entry point is taken into account, and the stop is placed under the correction level of 61.8%.
- Target zones are defined using Fib extensions. Since we get several options for take profit, you can use partial profit fixation with simultaneous position trawl.
This is a ready-made strategy; the general principle is suitable for all volatile assets, including stocks , gold , and commodity market instruments. If you have just started getting acquainted with the world of trading, I recommend taking an educational course on “what is volatility” and understanding the rest of the terminology.
How to improve your work efficiency
To increase the efficiency of Fibo levels, I recommend :
- Do not use them in isolation from other analytical tools. Remember: the very fact that the price touches the Fibo line does not mean anything; confirmation of the reversal and the end of the correction is needed.
- Do not use them on small timeframes . As the time interval decreases, the forecasting accuracy decreases. At M1-M5 the value of Fibo levels is lower than at H4-D1.
- Use this tool only on clearly defined movements .
- Complement work with Fibo with other techniques . For example, instruments with high forward/inverse correlation can be analyzed simultaneously. Sometimes movement starts earlier on one instrument than on another. The article about the correlation of currency pairs tells more about this phenomenon.
- Combine Fibonacci levels from different timeframes . If several lines are located at a short distance from each other, they can be combined into a zone of increased significance.
- Stretch Fibo levels over several movements , for example, over the entire trend and over the last wave. The coincidence of several lines increases the value of this zone .
These rules are a kind of safety precautions . You can ignore them, but this will lead to a deterioration in the efficiency of Fibo levels.
Book Liber Abaci
Liber Abaci Page
In Liber Abaci (1202 edition), Leonardo of Pisa introduced the so-called modus Indorum (method of the Hindus), known today as the Hindu-Arabic number system. The book promotes numbering with numbers 0-9 and the positional number system. The book demonstrated the convenience of the Hindu-Arabic number system by applying new numbers to the accounting of goods, the conversion of weights and measures, the calculation of interest, and the exchange of money. The book was well received in educated Europe and had a profound influence on European thought. There are no copies of the 1202 edition.
The first section of the 1228 edition introduces the Hindu-Arabic numeral system and compares it with other systems such as Roman numerals and methods for converting other numeral systems into Hindu-Arabic numerals. The replacement of the Roman numeral system, its ancient Egyptian method of multiplication and the use of counting boards for calculations, with the Hindu-Arabic numeral system allowed for easier and faster business calculations, leading to the growth of banking and accounting in Europe.
The second section explains the use of Hindu Arabic numerals in business, such as converting various currencies, calculating profits, and calculating interest, which were important to the growing banking industry. The book also covers irrational and prime numbers.
Where to open an account for Forex trading
This is one of the most popular questions among beginners. Based on my own experience, I can recommend AMarkets .
| Criterion | AMarkets |
| Regulation | The Financial Commission |
| Minimum capital | From $100, €100, 5000 RUB for standard accounts |
| Number of assets | 100+ |
| Recommended capital | $1000 |
| Account currency | USD, EUR, RUB |
| Maximum leverage | 1 to 1000, on ECN – 1 to 200 |
| Spread in points | Floating, from 0 for ECN, fixed from 3 |
| Commission | $2.5, €2.5 or ₽175 for 1 lot one way for ECN |
| Execution speed, ms | 53,3 – 70,0 |
| Stop Out | 20-40% |
| Exiting client transactions to the interbank market | + |
| Number of positions | No limits |
| Pending orders inside the spread | + |
| Requotes | — |
| Limiting the number of transactions | Absent |
| Limit orders inside the spread | + |
| Availability quote | — |
| Own indicators | Cayman (market sentiment) and COT (provides information from the Commodity Futures Trading Commission) |
| Peculiarities | Welcome bonus up to $10,000. Cashback, there are tournaments and other incentives for traders |
I will give the main working conditions in this company in tabular form.
| Company | AMarkets | ||
| Rates | Standard | Fixed | ECN |
| Minimum deposit | 100$/100€ or 5000₽ | 200$/200€ or 14,000₽ | |
| Recommended capital | 1000$ | 50 000$ | |
| Leverage | 1 in 1000 | 1 to 200 | |
| Spread, points | Floating, from 1.3 | Fixed, from 3 | Floating, from 0 |
| Commission | No | 2.5$, 2.5€ or 175₽ for 1 lot one way | |
| Minimum Margin | 1$ | 5$ | |
| Stop Out | 20% | 40% | |
| Exiting client transactions to the interbank market | No | Yes | |
| Ability to place pending orders inside the spread | No | Yes | |
| Requotes | Eat | Their absence is guaranteed | |
| Open an account | |||
Summary
Fibonacci correction is a good analytical tool , but its effectiveness directly depends on the trader. If you do not use filters that confirm the reversal of Fibo levels, their effectiveness will be low. Research by Adam Grimes proves that without filtering signals by Fibo levels, their value decreases .
I note that this tool is suitable for all systems without exception . It can act both as a filter when added to an existing vehicle, and as the basis of a strategy when building it from scratch. To strengthen your skills in working with Fibo levels, I recommend working with history and practicing trading using signals of this type on a demo account .
If anything remains unclear, ask questions in the comments. There you can also offer your ideas on Fibo levels and share your experience of working with them - this will be useful to other readers.
If you want to keep abreast of updates to my blog, subscribe to the telegram channel . With it you are guaranteed not to miss the release of new materials. With this I say goodbye to you. Good luck in conquering the financial markets, and see you soon!
If you find an error in the text, please select a piece of text and press Ctrl+Enter. Thanks for helping my blog get better!