Any successful trader carries out his activities according to certain rules and a developed action plan, which together represent his strategy.
Developing a trading strategy is the most important aspect of successful activity in the stock market; it eliminates randomness, leads to consistency, and ensures efficiency.
Strategies may differ according to certain criteria:
- according to the urgency of transactions - short-term, medium-term and long-term, and hence - speculative trading (in particular, speculative strategies) and investing;
- by the direction of the transaction - bullish - in a growing market or bearish - in a falling market;
- according to the degree of acceptable risk - conservative with low risk, moderate with average risk and aggressive with high and very high risk.
You can use other criteria for classification or detail the proposed points.
For example, in the short-term strategies section there may be scalping, arbitrage or others.
A long-term stock trading strategy may focus on generating dividend income or investing in undervalued stocks.
Separately, we can highlight IPO operations.
What is a trading style?
Trading style is a set of preferences that determine how often you place trades and how long you keep them open. This will depend on your account size, how much time you can devote to trading, your personality and your risk tolerance.
While your trading style and your trading plan should be unique to you, there are four popular styles that you can choose from.
- Positional trading.
- Swing trading.
- Day trading.
- Scalping.
Speaking about the types of time strategies, there are the following:
- long-term
- mid-term,
- intraday,
- short-term,
- ultra-short-term,
- scalping,
- peeps.
Longer strategies are considered less profitable in percentage terms, but they also involve much lower risks, require less psychological stress, and a higher Deposit to Margin ratio.
Long-term strategies are those when the trader holds a position open for a long time (from a couple of days to a month or more). These are the least risky systems that do not require making instant decisions, with a low psychological load. But they require a large deposit, which will be at least 5-10 times the Margin (the amount needed to open and maintain a position).
Medium-term systems operate from 1 day to a week. They have the same properties as long-term ones, but you have to wait less.
Intraday strategies involve conducting one transaction within one trading day. The system is quite risky, since the result is influenced by market noise. Such trading allows the trader to monitor price movements; it is psychologically less stressful than pipsing, for example.
When talking about types of strategies, traders usually pay a lot of attention to short-term systems. The duration of transactions in this case ranges from 1 hour to a day.
These are potentially highly profitable strategies, but they require a lot of experience. The advantage is that there is no risk of unexpected price changes when the trader is not on the market, the disadvantage is large indirect costs (spread, commissions, communication services); considerable risk of short-term price fluctuations, the need for constant focus on the schedule and control.
Ultra-short-term strategies are most attractive to beginners, but they can quickly lead to the loss of all funds. Working with such a system requires a lot of psychological stress; it makes it possible to earn a small number of points, but you can lose much more.
Scalping is a complex type of trading that requires considerable skill and excellent understanding of the market. Scalping involves making a profit in a minimum time spent in a position. You need to be able to accurately enter a position, ensure good communication, the trader exits the position as soon as he receives a profit of several points. When trading this way, you definitely need to remember about money management, which will help you avoid losses.
Forex pip strategies are highly profitable systems that involve making a huge number of transactions in order to profit from minimal fluctuations in the value of a currency. The trader makes an unlimited number of transactions in minimal time intervals.
Discretionary trading and algorithmic trading
Before we dive into different trading strategies, we must first determine the system by which you will execute your trades.
When it comes to trading the financial markets, there are two main approaches to trade execution that a trader can use. The first is the discretionary approach, in which the trader trades manually and uses his analysis to guide trades.
The second is an algorithmic approach to trading, in which a trading robot is in charge of trading. Here the trader’s job is to program the automatic trading system and then regularly monitor it.
Choosing the appropriate approach depends on your choice, comfort level and psychological preferences. For example, if you want to always be in control of all trading decisions, a discretionary approach may be more suitable for you.
On the other hand, if you know how to program and can create a trading algorithm based on your rules that will make systematic trades in the market, then algorithmic trading may be the best choice for you.
All of the trading strategies that we will discuss in the following sections can be either discretionary or algorithmic. Keep in mind that a discretionary trader can also follow a strict rules-based strategy, but still has some leeway to make decisions. At the same time, the algorithmic approach cannot be discretionary. The robot will automatically make all transactions according to the trading algorithm.
It is important to ask yourself which approach to trading you are most comfortable and comfortable with, and then choose the trading style that works best for you.
Introduction to Trading Strategies
A trading strategy (TS) is the rules that describe in which cases to sell and in which to sell. According to them, a trader must perform transactions on the stock exchange.
There are hundreds of different strategies. They all work with different efficiency for each financial asset. This is due to the specifics of each investment instrument. For example, exchange rates are rarely subject to a long-term trend. Most often they fluctuate in a tight range.
Globally, the following approaches to trading on the stock exchange can be distinguished:
- Intraday trading (intraday or day trading). Most beginners start with it and fail. Only a small part is able to earn money consistently from month to month;
- Positional. Trades are made with the aim of obtaining a movement of 10-50%. Usually occur once every few months. This approach does not require much time and really brings profit to traders.;
- Scalping. Super short trades. Most often, trading is carried out on Forex. Read more: how to make money on scalping;
- Passive investing. Buying with long-term goals. Implies a complete absence of any action on the part of the investor. This is a huge area that is widely used by experienced investors. Read more: principles of passive investing;
Active strategies can be divided into two types:
- Trend (transactions are opened in the direction of movement);
- Countertrend (trying to find reversal points);
At the same time, the timing of using the strategy is also important. For example, during periods of trending movements, it is better to use trend options than counter-trend ones. But it is impossible to determine in advance whether there will be a trend now.
Traders can be divided into two camps:
- Bulls - trade bullish;
- Bears - trade bearish;
The trading strategies discussed in this article will work equally for both bulls and bears.
- Bulls and bears on the stock exchange;
- What is long and short;
The working classic trading strategies described below and their approaches are not some kind of secret knowledge. However, not everyone can successfully trade on the stock exchange, so it is very important to develop the psychological component, to weigh the risks that everyone is willing to take. Another important point is experience, which can only be acquired through trading.
High Frequency Trading
High frequency trading is an algorithmic trading method that large organizations use to execute huge numbers of orders in a matter of seconds.
However, this style is not generally classified as a mainstream trading style because it relies on core technology rather than the trader's personal preference or plan to execute trades. High frequency trading is also not widely available to individual traders, meaning they simply cannot keep up with the big companies.
Strategy for trading with the broker uTrader
If you don't like strategies based on technical indicators, then you will like a strategy based solely on the built-in functions of the uTrader broker's trading platform. The strategy is very simple and is suitable for any trader. Using the Strategy Advisor , we analyze the chart and determine the direction of price movement, after which we open 2-4 trades in the direction of the received signal.
Technical characteristics of the strategy:
- Asset: any currency pair
- Expiration time: 60 seconds
- Profitability: 65-80%
Suitable brokers:
- uTrader
- Binarium
Trading example:
Trading results:
Learn more about the trading strategy for the uTrader broker
Scalping
Scalping is a fast-paced trading style that can be very intense and often brings a lot of stress. Scalping involves constantly looking for trading opportunities. Scalpers can often trade 20, 30 or more than 50 positions during a single trading session. Most scalpers tend to be in and out of the market within a few minutes.
Scalping involves opening and holding a position for a very short period of time, ranging from a few seconds to a few minutes. The idea is to enter a trade and exit it as soon as the market moves in your favor - making small but frequent profits.
Scalping is often considered a faster and more intense form of day trading. This requires traders to focus on markets that are extremely liquid and have strong trends.
Scalping is an extremely labor-intensive and energy-consuming process. This style is not typically used by part-time traders as it requires constant market monitoring and analysis.
Scalpers typically use high leverage and look for small moves that they can take advantage of. For example, a scalper trading EURUSD might trade multiple positions on a smaller time frame, such as a 1-minute or 2-minute chart, based on a breakout on the daily chart.
Scalping is quite popular in the stock market, where price movement is clearer and less chaotic than in Forex.
As you can imagine, one of the biggest disadvantages of using scalping is the high cost of transaction fees associated with a large number of trades. In many cases, transaction costs in the form of commissions can amount to 60-70% of a trader's gross profit. Therefore, scalpers should aim for low commissions from their broker to increase their chances of success.
These days, scalpers are facing serious competition from high-frequency trading using robots that can make hundreds or even thousands of trades during a single trading session. Therefore, it is not surprising that it is computer algorithms that dominate scalping and largely determine price movements on lower time frames.
Indicator Strategies
A distinctive feature of trading from all similar exchange tactics of investing in stocks, futures or currency pairs is that the trader has significant time limits for making his decisions on transactions. This requires the trader to constantly focus on the technical parameters of transactions rather than on fundamental analysis.
Another significant difference between trading and regular investing is that when carrying out transactions, margin instruments are used or transactions with high leverage are applied (usually not lower than 1:100). All this requires the trader not only to concentrate attention and carefully develop a trading plan, but also to use special methods and practices that can increase the likelihood of making the right decisions and increase the number of profitable transactions.
One such practical strategy that is used by traders is the indicator strategy, which is based on the use of only technical market indicators.
Basic elements of a trader's indicator strategy
To successfully implement an indicator strategy, you must, at a minimum, have a good knowledge of all its tools, which include the so-called technical indicators (i.e., the trader must have a good knowledge of all the equipment). There are more than 150 such indicators used in stock trading, which can be either universal or used only when trading special financial instruments.
In trading practice, several technical indicators have the best results in terms of the quality of decision-making. They are used mainly not only by market newcomers, but even by professionals.
Let's start with the simplest and most reliable:
- Relative strength indicator or RSI (relative strength index). This technical indicator is based on taking into account and pre-calculating the rate of increase of the option price function. The price change chart that a trader sees on the monitor is not some chaotically drawn line by price, but a cyclical function that can be analyzed mathematically. Thus, RSI gives the most important thing for a trader - the time or moment at which the current price trend ends.
The higher the value of this indicator, the closer the trend is to completion and you should wait for a reversal. Typically, a professional trader never waits for this indicator to reach its extreme values, but enters or exits the trade a little earlier in order to get a guaranteed profit without waiting for the trend to actually reverse.
- The second most popular indicator among traders is the ADX indicator or trend change indicator. This indicator is based on taking into account the dynamics of the ratio of short and long positions for the selected financial instrument. As a rule, when the price moves up, the number of short positions increases, and when the price decreases, the number of buy positions increases. Taking into account the average dynamics of this ratio gives an indication of a change in trend. The main advantage of this indicator is that it gives a very high probability of confirmation of price movements (90%), especially on short timeframes of no more than 1 hour (time intervals). The only drawback of the indicator is its slight lag, which, depending on the selected time interval, is approximately 10-15% of the real time of the beginning of the asset price reversal.
- Moving averages are another type of indicator that is used not only in the foreign exchange market. the stock market but also even when trading real estate. There are three types of moving averages - simple moving MA, average moving EMA and 3 EMA (sometimes called the Williamson alligator).
The essence of a trading strategy based on the use of these indicators is as follows:
To enter a trade or exit an asset, the moments when the moving average lines begin to intersect are used. This is due to the fact that each moving average is based on the dynamics of price changes over certain periods. If the exponents of these functions intersect at one point, then we should expect a change in the current trend of price movement.
The main thing that a trader should know is that the moment of entering (exiting) a trade using EMA indicators must take into account its lag time, which, unlike the ADX indicator, can be about 5-10% of the time period, which makes it more accurate .
The main advantage of the indicator strategy for a trader is that:
- relative accuracy of signal execution, which is an order of magnitude higher than the use of wave and graphic models.
- clarity and unambiguity, which does not require additional tools to confirm or interpret indicator signals.
- there is no need to undergo special training in the use of such indicators, which allows even a beginner to begin independently carrying out transactions using technical indicators after 2-3 trading sessions
The only drawback, it seems to us, of using an indicator strategy is that in some cases there are technical limitations for a trader using various indicator tools and trading platforms, especially if there are significant limitations in Internet speed.
Day trading
Day trading is somewhat similar to scalping, as here traders open and close their positions during one trading session. But the main difference between the two is that day traders tend to trade on higher time frames and hold their trades for longer periods of time than most scalpers.
Day trading is a style that involves a trader opening and closing all of his positions before the markets close each evening. Day traders will buy and sell multiple assets throughout the trading day, sometimes multiple times a day, to take advantage of short-term market movements. In doing so, they avoid some of the risks and increased costs associated with holding a position overnight.
Day trading requires time, attention and dedication to a trading plan. It involves executing a large number of trades for relatively small profits compared to swing trading or position trading, so it is imperative that day traders do not fall prey to emotions. To reduce the risk of loss, day traders often use stops and limit orders.
Day traders usually don't get in and out of the market within minutes. They typically use day trading techniques and look for price fluctuations throughout the day that they can capture. Thus, a day trader can remain with an open position from 30 minutes to several hours or even throughout the entire trading session.
Most day traders will place two to five positions per day depending on the current volatility. Although transaction costs can affect a day trader's trading outcome, they are not as obvious as they are for scalpers. Also, the vast majority of scalpers tend to focus on algorithmic trading, with many day traders still choosing a discretionary trading style.
Besides traders who focus on news trading, most day traders focus on technical analysis. They are not as concerned with macroeconomic trends because their trading style does not require long-term forecasts of days or weeks.
To become an effective day trader, you can use a robot that will ensure that all your positions are closed by the end of the trading day. Some new traders find it difficult to exit losing trades at the end of a trading session because they still believe that prices may reverse. Therefore, they allow a short-term day trade to become a swing trade.
Every successful day trader knows that the market will open tomorrow, so they will always have the opportunity to make money.
Types of trading strategies in the stock market
The total number of trading strategies is incalculable. New schemes are invented every day, and old ones are improved. However, several trading investment strategies have been established for a long time and are used everywhere, having proven their effectiveness on the MICEX and foreign stock exchanges.
Asset Allocation
A distributed portfolio trading strategy, where assets are segmented by categories of terms, risks, and potential profits. In particular, this includes securities of Russian and foreign companies, large market players and small firms, government bonds, short-term and long-term instruments.
With the right combination, timely redistribution and addition of new assets, this results in a constant increase in the total value of the portfolio. Using this strategy, the investor refuses to predict anything and buys not individual stocks or bonds, but the entire market, using indices.
Dividend strategy
Securities with high dividends are purchased with the goal of holding them for a long time and receiving these dividends. Today there are many companies on the stock exchanges that pay dividends from 1 to 4 times a year.
Cost strategy
Undervalued shares are purchased on the stock exchange. The parameter is determined by fundamental analysis. For example, securities are sold at a low cost, but in the future they have growth drivers, growth in enterprise profits, debt repayment, indexation. All this entails market revaluation and growth.
Trading strategy for growth
Investments are made in shares of stock market companies with growing profits. A large part is invested in further development, due to which income and share price increase. In this case, the issuer deliberately refuses dividends in favor of reinvesting funds back into the business.
Trading
A trader is characterized by an active position in the stock market. His positions are short-term or medium-term in nature with the possibility of quick exit, profit taking and risk control.
Often the game is played with borrowed funds. The money with interest is returned to the broker, and the profit remaining after deducting it remains with the investor. Roughly speaking, investors use fundamental analysis, and traders use technical analysis.
Swing trading
Swing trading involves trading with a time horizon ranging from one day to several weeks. Swing traders typically trade H4 and D1 time frames, but can also use hourly time frames. Swing traders choose the best trading strategies among different trading styles when it comes to trading frequency and transaction costs.
It is typical for these traders to open 8-12 positions per month, which can mean 100-150 trades per year. From this perspective, it is a great trading style for new traders due to the large number of opportunities available to hone your skills in the market.
Swing trading is a style that focuses on taking a position in a significant market move. This involves holding a trade over a period of days or weeks to take advantage of short- and medium-term price movements.
The main goal of swing trading is to identify a trend and then capitalize on the peaks and troughs that provide entry points. A swing trader will use technical analysis to identify key entry points into the market. They look for two types of market movements: "swing highs" when the price moves up, and "swing lows" when the market price declines.
A swing low indicates an opportunity to buy a long position or sell a short position, and a swing high indicates an opportunity to sell a long position or go short. Swing traders often look for markets with a high degree of volatility, as these are the markets where swings are most likely to occur.
There is no specific length of time to hold a position for swing trading as it all depends on how long each trend lasts. It could be just an hour or a week. Swing trades will only be closed when the profit target is reached or the position is closed by a stop loss. This is the preferred method for traders who do not want to spend all day monitoring the market but want to profit from long-term positions.
The cost of trading in the form of spreads and commissions is also significantly reduced in swing trading. The lower trading frequency compared to day trading and scalping, combined with large take profits, makes swing trading one of the most attractive trading styles for professionals.
Another major advantage of swing trading methods is that many of the technical patterns that form on these relatively higher time frames are much more accurate and reliable. For example, a support level formed on H4 is much more important than a support level formed on the 15-minute chart. Also the head and shoulders pattern that appeared on H4 is more reliable than the same pattern on M5.
There are many trading strategies in the market that can be used in swing trading. You can trade for market reversals, use technical indicators like Bollinger Bands or momentum. Use support and resistance levels, trade with the trend or in consolidations. Choosing the best trading method will depend on your personality and personal trading preferences.
Selecting stocks to trade
As an example of choosing an investment object, you can consider the analysis of shares of the Chinese automaker NIO Inc.
Fundamental data and overview
In recent years, Chinese startups have demonstrated record results and attracted the attention of market participants.
In December 2022, the manufacturer reported that it had posted a doubling of year-over-year shipments for nine consecutive months.
Car delivery schedule in annual and monthly terms in 2020.
Nio more than doubled its electric vehicle sales to 43,728 vehicles in 2022 and analysts expect sales to reach 100,000 in 2022 as the company expands production capacity in China and also plans to enter the European market.
Nio plans to reach production capacity of up to 10,000 units per month in the second half of 2022 and reach capacity of up to 150,000 electric vehicles per year in the first quarter of 2022.
Optimistic forecasts are slightly overshadowed by problems with chips on the global market. The global shortage of semiconductors has already forced almost all leading electric vehicle manufacturers to suspend work at their factories. NIO was no exception and at the end of March was forced to suspend work at a plant in China for five days.
The year 2021 started quite successfully and included the most successful strategies in the stock market.
The official report for March and the first quarter of 2022 reports that 7,257 vehicles were delivered in March, which is a new record for the month and corresponds to a significant increase of 373% compared to the same period in 2022, a low base must of course be taken into account calculation.
Year-over-year sales rose 352% in January and 689% in February.
At the end of the first quarter, sales reached 20,060 vehicles, which is a new quarterly record and were 423% higher compared to the same period last year.
Nio lags behind industry leaders in key metrics, but it is a young and fast-growing company that is looking to turn a profit.
In the first quarter, loss per share was 14 cents, compared with 39 cents a year earlier.
Analysts expect Nio to cut its loss per share by another 75% in 2022 as it expects revenue to grow 80%.
Wall Street forecasts that the company will break even and achieve EPS of $0.23 per share for 2023.
Nio's investors include Baidu and Tencent.
Experts are optimistic about the prospects for the electric vehicle market, both in China and globally.
However, investing in securities of Chinese issuers is associated with significant risks, both internal and external. The unpredictability of Chinese regulators and increasing tensions in relations with the United States are forcing investors to be cautious.
In recent years, competition in the industry has increased significantly and it is quite difficult for young Chinese manufacturers to compete with leaders such as Tesla Inc. or the enormous resource potential of Volkswagen.
Technical picture
NIO stock reached an all-time high on January 11, 2022, at $66.99 per share.
Since February, profitable securities have been sold along with other representatives of high technologies.
Since the beginning of the year, the industry flagship TSLA has fallen in price by 9%, while young Chinese companies have suffered more. NIO shares fell 25%, Li - 22%, XPEV - 16%.
NIO, TSLA, LI, XPEV Stocks in 2022
By April 1, the price of NIO is below the 50 MA near the $39.5 level. Support is MA 200.
NIO,D
However, even though NIO stock has been hit by the sell-off, it could be on an investor's watch list.
The company operates in a country where the government is making great efforts to accelerate the transition to environmentally friendly cars by providing support to businesses.
NIO's price was widely outperformed by fundamentals earlier this year, according to analysts, but the recent decline has brought the stock to a level that could be attractive to long-term investors.
Given the volatility of the markets, we can expect a continued correction in the sector, which could further reduce the value of NIO.
Analysts, when assessing risks, look at the security from the point of view of gradually gaining a position.
When researching, investors can use comparative analysis based on multiples - P/E, P/B, P/S and others, or use the discounted free cash flow method.
In any case, the approach to analysis is consistent with the specific intraday strategy of each trader and bears the imprint of his individuality.
Position trading
Position trading involves holding a trade for an extended period of time, be it weeks, months or even years. Position traders don't worry about short-term market fluctuations—instead, they focus on the overarching market trend.
Investing is perhaps the most popular form of positional trading. However, an investor will most often use a buy and hold strategy, while position trading can also apply to shorter positions.
Positional trading involves taking fewer trades than other trading styles, but the positions will tend to have higher value. While this increases the potential for profit, it also increases the trader's exposure to risk. Position traders must have a lot of patience to adhere to the rules laid out in their trading plan. They need to know exactly when to close a position and when to let profits run.
Typically, position traders will rely on technical analysis and global support and resistance levels.
The price paradox or how we deceive ourselves
Let's quickly look at the price paradox and trader behavior as an example.
Let's say some asset has been trading in the range of $10-$30 (the historical maximum is $31) for 2 years. After which, within 2 weeks, there is a sharp breakout of the previous resistance level of $30 and the price reaches $50 with fairly large trading volumes. You will buy? Most likely no. It is psychologically difficult to buy at a higher price today something that was almost 30% cheaper yesterday. “I’ll wait for the correction,” the newbie trader thinks.
Then the price rises further within 3 days and reaches $60. Are you going to buy? Again, no, because the price has become even more expensive. This time the quote hangs in the range of $55-$62 for the whole month. After which, over the course of 5 weeks, it gradually grows higher and reaches $100. Now the investor is already tearing his hair out that he missed such a chance to triple his deposit in 3 months. And the price after $100 continues to rise higher and higher.
For example, the price after $127 bounces down. The trader is in a hurry to buy a share and takes $115 for everything at once. As a result, the price drops to $100, then $110 and then flies down to $85, where it remains to fluctuate for the next year. As a result: we missed the whole movement, bought it expensively and are sitting in a strong minus. If we had just bought at $30 and done nothing, we would have been in huge profit.
- The stock market is growing on volume - what does this mean;
- Passive investing - step-by-step instructions;
- Buy and hold strategy;
Look at a real example of Litecoin to dollar quotes. It would seem that there is nowhere to grow further:
Two months have passed and the first growth seems funny:
Having bought Litecoin for $4 after eight months, you could sell it for $368 (at its peak). This is an increase of 9200%. Most of us won't earn that much in our entire lives.
What is the security price paradox? The fact is that the asset can break new record after record. And the chances of this are very high. However, in most cases traders miss such growth, although they can literally “make quick money”.
In this situation, when an asset begins to fall (for example, by 10-20%), then we begin to enter, on the contrary, to buy more. And this often turns out to be a trap. The price has turned around and begins a slow fall. Quotes are slowly decreasing by 30%, 40%, 70%, 80%. This situation occurred in Bitcoin quotes. Many expected growth, but instead received a strong, long-term decline.
When building your trading strategies, you need to take this fact into account and not enter on the decline. This is an easy way to lose, not make, money. Moreover, it will be long and painful.
Remember a simple rule: while the price hits maximum after maximum and a bullish trend prevails, then always open positions only in the direction of growth. There is no need to look for entry points to play short. As soon as the quotes have stopped updating the “highs” for several days, then this is a reason for analysis: this is a break in the trend or a fixation of the positions of large players.
Trading on the news
Trading on news is a variation of fundamental analysis. News traders seek to capture price movements following news announcements using the economic calendar. Economic events such as US non-farm payrolls, central bank rate announcements, inflation reports, and quarterly GDP reports may cause increased volatility in the market.
When numbers from a planned news event deviate significantly from analyst consensus, there may be an unexpected reaction in the market. Sometimes prices can rise by 150 points or more within a few seconds, or, on the contrary, fall by 150 points.
Trading the news can be quite complex and risky, as these price movements can occur in a variety of directions, making it difficult to determine the true direction of the market. Strict money management rules and tight stops are a necessity for news traders due to the increased risk involved.
There are various trading strategies and techniques that a news trader can use. Here you can trade the forex market, use futures, stocks or options.
Regardless of the method used, it is important to note that immediately before scheduled news events, the price of certain pairs that may be affected by the report usually trades in a consolidation. As a major economic report approaches, trading spreads will tend to widen as forex brokers making the market look to balance their risks to protect themselves from potentially adverse price moves.
Some news traders prefer day trading, where they enter the market immediately after news releases. Other traders prefer to wait for the market to cool a bit and wait for a pullback before entering the direction of a new trend created by a news event.
Strategy No. 2. Divergence and convergence of indicators
Divergence and convergence is a situation in the market when the price has updated a new extreme, but the indicator has not. The exact definitions are:
Divergence (from the Latin “divergere” - divergence) is a signal for opening a short position, which represents a divergence at new price highs and the absence of a new high on the oscillator.
An example of divergence in theory:
Convergence (from the Latin “convergo” - convergence) is a signal for opening a long position, which represents a divergence at new price lows and the absence of a new low on the oscillator.
An example of convergence in theory:
Note Sometimes there are triple and even quadruple local extrema.
A trading strategy involves opening a position against the trend. Therefore, sometimes there will be not the best moments to enter, so it is worth using protective stop loss orders.
What indicators may be suitable for working with a divergence and convergence trading strategy:
- MACD;
- RSI;
- Momentum;
Rarely, but sometimes they also use volume indicators (Volume), Stochastic or CCI.
Divergence and convergence is one of the most accurate signals that can help traders and investors make a successful trade at very good prices.
An example of divergence and convergence in practice. Sberbank quotes chart:
Alexander Edler loves this class of divergence-based strategy. Author of the book “How to Play and Win on the Stock Exchange.” He presented the material in an interesting and accessible way. I advise beginners to read the book or at least watch his speeches on YouTube (they are free).
Trading Strategies
A trading strategy will use technical or fundamental analysis to determine specific market conditions and price levels.
While there is a lot of confusion between the terms trading styles and trading strategies, there are some important differences that every trader should know. While style is a comprehensive plan for how often you will trade and how long you will hold positions open, strategy is a specific methodology for determining the market entry and exit points at which you will enter and exit your transactions.
Some popular strategies include:
- Trading with the trend.
- Trading in consolidation.
- Breakout trading.
- Reversal trading.
Trend trading is a popular trading strategy among many futures traders and hedge fund professionals. This style of trading was initially popularized by Bill Eckhardt and Richard Dennis through the “Turtle” experiment.
These two traders took a bet to see if they could teach ordinary people from different walks of life a trend-following methodology to succeed in the markets.
The results of the experiment showed that, in fact, traders can be taught to be profitable in the markets. Some of the turtles became very successful private traders and hedge fund managers.
The idea of trend trading attracts many traders. We know from the law of physics that everything follows the path of least resistance. The trading of most trend traders is long-term in nature. They tend to focus on the daily and weekly charts in search of the strongest moves.
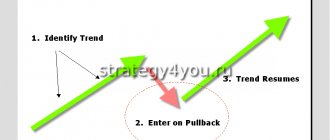
The main goal of a trend trader is not to predict where the market might go, but to join a market that is already showing signs of moving strongly in a particular direction. Traders try to enter established trends and stay there as long as the market continues to move in the desired direction.
The main difficulty that many new traders face is that they enter the market too late. By the time most retail traders enter a trending market, most of the move has probably already been exhausted. So the trick is to spot an emerging trend as early as possible and enter the market as close to the beginning or middle of the trend as possible.
Trend Strategies
One of the simplest strategies that is available even to market beginners is a trend trading strategy. Its essence is that the price of any asset, for example, currency or shares, has only three movement patterns - growth, decline and sideways movement (as professionals say - sideways or flat).
During these relatively short periods (as a rule, trend movements account for no more than 20% of the entire time interval), the price of an asset can increase by several percent or even tens of percent. In addition, using even a smoothly upward movement of the price of an asset during a trend period, you can apply a trading strategy using small fluctuations in the price corridor.
Trading in a trend price range
As we have already noted, the price of an asset, even with its upward or downward movement (trend), does not follow an even straight line, but oscillates around a certain average value with a certain slope. Those. the price of an asset fluctuates, makes a gradual upward or downward movement, and the price operates in a price corridor.
Using this property of the asset, you can make money on short-term price fluctuations within this corridor, which is most suitable for trading on any exchange market.
The periods of such fluctuations in the price corridor can range from several minutes to several hours and even weeks. The main task of the trader in this case is, for example, in the case of an ascending corridor, to buy an asset at the lower part of the price corridor, and to sell at its upper part.
The same applies to the reverse price movement, during a downward corridor (trend). They buy shorts of an asset or at the upper price value in the corridor, and take profit at its lower values (in the corridor). The advantage of this strategy is that knowing the boundaries of the corridor in advance, the trader can see the next price levels in advance and predict price movements in advance and place orders.
Using the SMA trend indicator
Another strategy used for trend trading is the use of special trend indicators. These include, in particular, ADX or RSI. However, they provide some lag and uncertainty cannot always be eliminated when using them (especially if there is high volatility in the market).
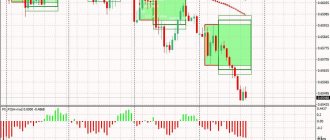
Therefore, for a trend strategy, the use of trend indicators such as, for example, SMA (moving average) is most suitable. Let us explain with an example how all this works in real practice (for clarity, it is shown in the graph below).
- You should wait until the two average indicators begin to intersect at one point, such as the top of a trend, to buy or short a stock. However, when the indicator lines cross for the first time, the position is not taken with the entire lot or the entire trading deposit. But, for example, only 50% is taken.
- then you should wait until the indicator and its lines intersect again at one point, i.e. the signal will be confirmed.
If a repeated signal confirms that the trend direction is correct and the price goes down, then the trading position is expanded to 100% and we wait for the selected trend to end until it is completely completed (full cycle).
- At the end of the trend, which is determined as the indicator lines cross, the position is exited - the stock is sold or the short position is closed (for example, a reversal from short to long).
What are the advantages of this strategy:
- the trader chooses almost the entire price movement along the trend, which gives incomparably more income from an open position than if a lot of transactions were made within the price corridor of such a trend. It is also worth recalling here that on trend movements you can save a lot on brokerage commissions, since, in the case of a successfully caught trend, only 2 transactions are made (buy-sell).
- a significant saving of time when there is no need to be at the trading terminal monitor, monitoring your transactions for hours.
The significant disadvantages of this particular type of strategy are the following:
- If there is strong volatility in the market, the SMA indicator may show incorrect values, so you should trade using a trend strategy only during periods of stable growth or decline of the entire market.
- As a rule, trend movements make up no more than 20% of the total time of movement of the asset price. The rest is spent finding the price in a sideways flat. However, here the trader himself can choose for himself - either to make one hundred trades a month on sideways price movements, or to make one or three trend trades, with the same financial result, and maybe even higher.
In addition to the example trend trading strategies, strategies are used that are based on the use of indicators such as stochastics or Bollinger bands. But as practice shows, a large number of indicators on a trend strategy adds little to the effectiveness of trading, since even an experienced trader can interpret the values of trend indicators differently, which in different market situations can give ambiguous trading signals.
Trading with the trend
A trend trading strategy is based on the use of technical analysis to determine the direction of the market. This is generally considered a medium-term strategy, best suited for position traders or swing traders, since each position will remain open as long as the trend continues.
The price of an asset can move both up and down. If you are going long, you will do so if you are confident that the market will make higher highs. If you were going to go short, you would do so if you thought the market would make lower lows.
Trend traders pay little attention to market corrections, but it is important for them to confirm that this is a temporary price movement and not a complete reversal, which is a signal to close the trade.
Some of the most popular technical analysis indicators that are included in trend following strategies use moving averages, the RSI indicator, as well as the ADX indicator.
Forex strategy “Three moving averages”
The best forex strategies are usually simple and at the same time effective. It is not easy to meet these two criteria, so they are usually designed for large time frames. Let's consider a very interesting technique, which is based on the simplest definition of a trend. as well as on only three indicators of the same type - moving averages.
Trading scheme
To work, we need a chart of any active currency pair (very good to use on the pound) for the H4 period and another for the H1 period. We add three moving averages to the hourly chart:
- Simple moving average with a period of 240.
- A simple moving average with a period half the previous one, that is, 120.
- Exponential moving average with a period from 36 to 72, 48 is considered optimal.
Interesting poll at the end of the article!
Don’t leave early - take the survey) It’s both useful and informative)
Go to survey>>
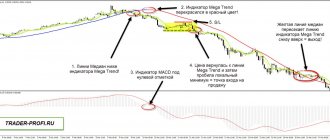
So, we determine the trend on the four-hour chart. The best option is if a reversal has recently occurred and the trend is just beginning to develop. This rarely happens abruptly, so a correction always begins after the first movement in a new direction. After its completion, the trend direction resumes. For those who are familiar with wave theory, at least in general terms, these can be called leading waves, that is, 1 and 2. Let’s move on to the hourly chart and look at the position of the moving averages on it. The slow one, which has a period of 240, begins to gradually unfold, although not necessarily, it all depends on the situation. The main thing is that the average moving average with a period of 120 ends up in the following position:
- Above the slow one if an upward trend develops.
- Below slow if a downward trend develops.
Now we are waiting for a signal from the fast moving average. It should cross the average by analogy with the location of the previously mentioned indicators, that is, to enter a buy position after a correction, the fast moving average crosses the average from bottom to top. This is how a signal to enter the market arises.
Take profit and stop loss
Now let's move on to the stop. Limitation of losses due to the fact that the main time frame is still H4 should be placed behind the local extremum on the four-hour chart. This may be the level of the end of the correction or even be removed from the very beginning of the trend. The size will be quite large and reach 120-180 points. Setting short stops is completely pointless, as is early breakeven before the price moves 100 points in the desired direction.
The take profit is either fixed - twice the stop, or you can use the same scheme with moving averages, or rather, with their relative position. There are two options:
- Take profit at the moment when the average moving average crosses the slow one against the trend. This will indicate the beginning of a new correction on H4.
- Take profit at the moment when the slow moving average moves to a horizontal position or changes the direction of its slope.
- When a clear reversal pattern forms, as in the example in the picture above.
I also recommend reading:
Pareto's rule (20-80) and its application in real life
This pattern can be compared with the Fibonacci sequence and the relationships derived from it. They work in all spheres of human […]
Trade in consolidation
Range trading is a strategy that seeks to take advantage of consolidation, a term to describe price that remains within support and resistance lines. Range trading is popular among scalpers as it focuses on making short-term profits, but can be seen on all time frames and styles.
While trend traders focus on the overall trend, range traders will focus on short-term price fluctuations. They will enter long positions when the price moves between two clear levels and stays between them
This is a popular forex trading strategy, as many traders use the idea that currencies remain in a narrow trading range most of the time, with significant volatility between these levels.
There are a number of other indicators that consolidation traders can use, such as stochastic or RSI, which identify overbought and oversold signals. Range traders will also use tools such as Bollinger Bands or fractal indicators to determine when the market price may break out of this range, confirming that it is time to exit a position.
Trading strategy “Three moving averages” (short-term option)
There is another interesting option for using the same set of indicators as in the previous case, but only now it will be practically a scalping strategy on Forex.
Trading scheme
The main schedule remains hourly. You need to wait for the moment when a good trend movement begins. The moving averages should be arranged in this order (let’s look at the example of a falling market):
- Slow
- Average
- Fast
For bullish, respectively, in the reverse order. So, such an arrangement indicates a powerful trend. Since all the values were chosen for a reason, we will enter each time the price approaches the fast moving average to rebound from it. There may not be a touch, so we take a range of 10-15 points near it. The stop is located behind the average moving average. Take profit is determined by the trader himself, but you can count on 30-50 profit points.
Breakout trading
Trading a level breakout is a strategy for entering a given trend at a very early stage, before the price breaks out of the range. Breakout trading is commonly used by day traders and swing traders as it takes advantage of short- and medium-term market movements.
Traders who use this strategy will look for price points that indicate the beginning of a period of volatility or a change in market sentiment. A common practice is to place limit orders at support or resistance levels so that any breakout will automatically open a trade.
Most breakout trading strategies are based on volume, because when volume levels begin to rise, a breakout of a support or resistance level will most often occur. Thus, popular indicators for breakout trading include the money flow index (MFI), on-balance volume, and volume-weighted moving average.
Strategy #1. Based on moving averages
Moving averages display the average price for the previous period, which the trader chooses. There are two main types of line:
- Simple (SMA, Simple Moving Average);
- Exponential (EMA, Exponential Moving Average);
It is better to use the exponential type of moving averages, since they better take into account recent data, and therefore have more relevance.
The difference between SMA and EMA can be seen in the following chart:
What information can moving averages give an investor:
- Shows how expensive/cheap the price is relative to the average price;
- They perfectly show the long-term trend;
- Allows you to buy at the best prices;
The most classic use case is moving average crossovers.
When the fast moving average crosses the slow moving one from below, this is a buy signal. Similar to selling: when the fast one crosses the slow one from top to bottom. Here's what it looks like in examples.
Crossing EMA 7 and 21:
Crossing EMA 30 and 100:
But there is another option for using sliding ones. Entering a position after the 200 day EMA begins to round upward. In this case, a good addition to the signal is an increase in trading volume. This is often one of the best entry points. Therefore, this position can be maintained for several more years, or maybe even left forever.
Note There are two more rare types of moving averages: linear-weighted LWMA (Linear Weighted Moving Average) and smoothed SMMA (Smoothed Moving Average). These are specific options. Perhaps they can complement some trading strategies well.
Reversal trading
The trend reversal trading strategy is based on determining when the current trend will change its direction. After a reversal has occurred, the strategy will acquire the characteristics of a trend trading strategy.
A reversal can happen in both directions as it is a turning point in market sentiment. A bullish reversal indicates that the market is at the bottom of a downtrend and will soon turn into an uptrend. While a bearish reversal indicates that the market is at the top of an uptrend and is likely to turn downward.
When trading a reversal, it is important to make sure that the market is not just undergoing a correction. Fibonacci extensions are a common tool used to confirm whether the market is exceeding known retracement levels.
The importance of trading strategy in the stock market
Trading and investment strategies are divided into simple and complex. The most ingenious ones involve the use of trading robots, opening 2 brokerage accounts with mutual reinsurance, and simultaneously entering a long and short position. In practice, it is easier for novice investors to stick to one (preferably simple) method.
When it is mastered and brings profit, you can try a trading strategy, gradually developing your skills. To begin with, it is better to focus on preserving the deposit, having learned not to lose, by choosing a trading strategy with minimal risk. Consistently following a trading strategy will lead to the desired result in the form of financial independence.
The market is not a charity. Others will do anything to scam you out of your money by manipulating them on news and excitement. To prevent this from happening, the investor needs consistency and internal discipline.
Macro-economic trading
Macroeconomic traders mainly focus on long-term fundamental data that determines a country's economy. These traders can hold positions for months and even years. Many of them have only a few positions open throughout the year. These traders choose their positions carefully because their number is very limited.
Some of the most important economic data that macroeconomic traders study include a country's GDP data, current inflation and employment situation, interest rates and trade balance data.
It is from this primary data set of macroeconomic indicators that a trader can begin to build a forecast, his expectations from a particular country and its exchange rate in relation to other countries.
Successful macro traders can spot new trends in the current business cycle and prepare to enter the market before many others realize the impending changes. These traders tend to be well aware of the overall market sentiment and look for early shifts in market sentiment and psychology.
Although macroeconomic traders rely primarily on fundamental analysis techniques, they also often use technical analysis to plan their trades and find optimal market entry and exit points.
An important analytical method used by many macroeconomic traders is the use of intermarket analysis. They regularly study the cause-and-effect relationships between different asset classes.
For example, macroeconomic traders want to know:
- How do government bonds move relative to stocks?
- What impact do certain currencies have on crude oil prices?
- What are the prices of basic commodities relative to the US dollar?
- What is the relationship between gold and stocks?
These are just some of the questions that macroeconomic traders try to answer before making their forecast.
My trading rules. Trading strategy for technical analysis figures using an example
My regular readers know that I use only technical analysis for market forecasts. I use graphic formations, candlestick patterns and divergences. This is more than enough for me to trade. In this article, I will talk about my attitude to technical analysis, which helps me in trading, and will show, using an example, a trading strategy for technical analysis figures, how I understand and use it.
In my opinion, when trading using technical analysis, the approach to it is very important, because technical analysis is an extremely subjective thing. It’s not without reason that they say that give several traders a chart, and everyone will see something different in it. Some build based on the lows/maximums of candles, some based on closes, some accurate to the point, some carelessly. To each his own. But, in any case, you need to come to a structured methodology and stick to it.
In my opinion, the main mistake of beginners, or traders with little experience in trading on the stock exchange, is a dogmatic attitude towards analysis . These are those traders to whom the price constantly “owes” something. You can often hear them say: the market should, the price should go this way, etc. Everything with them is precise and categorical. When a person in the market operates with such criteria, then everything is clear with him, as with a trader. As a rule, these people constantly argue with the market, and their fate is predetermined. Examples are a wagon and a trolley. Remember, the price doesn't owe anyone anything . She doesn't care how you lined the chart or where your expectations are.
The literature also makes its contribution, where it is written in such a way that the trader perceives that, for example, if there is a formation, then it must necessarily be realized. This stereotyped opinion is then very difficult to break. You will lose money to get rid of this mindset. Therefore, it's all about attitude. Never perceive anything in the market as a dogma , except for the truisms that the price will go to the right . You can tell me that this is not so, but you have no idea how many people who think and operate in dogmatic concepts on the stock exchange.
We came to the market to trade and earn money, not to argue and stroke our egos. Therefore, we need to listen to the market and remain very flexible to its changes. He himself tells you what to do. You just need to put your opinion aside and follow the prompts. Did you come to argue or make money? This is hard for people who are always used to being right. If you are like that, then either change or get screwed.
This was an introductory one. Now let's get down to business. I will show the trading strategy for technical analysis figures using an example, and with detailed explanations, as I do. Let's consider the market situation
Fig.1
We see how the price has formed an excellent descending wedge. I continued the sides further to make it clearer. It is worth making a small note about the price behavior inside the pattern. I do not recommend trading inside the pattern. An exception can be made only for those moments when the price approaches the support or resistance of the formation. But at this moment you will not know what will happen, a breakdown of the figure, or a rebound from the level. Therefore, when the price approaches support or resistance, it is better to switch to a lower time frame and work out reversal patterns there. But, it is better not to get into the game inside the formation at all if you have little experience in trading and you have a bad attitude towards accepting losses. Let's continue.
Then the price behaves like this:
Fig.2
A breakdown of the figure has occurred. The trade is entered during the breakout itself, and not after the candle closes. This is how you can enter before the upcoming impulse. A buy opens, and then the market behaves like this
Fig.3
The price approaches the broken resistance from above. This is a negative sign. The overwhelming majority of true formation breakouts take place with good momentum and, without losing speed, move towards the goal. And the time it takes to work out a target according to a figure is at least 2 times less than the time it takes to form the formation itself. I prefer to exit if the price doesn't go right away. You can always re-login if anything happens. Further events develop like this
Fig.4
The price moves inside the range of the formation. After that, I consider the figure broken and expand the range (the old resistance of the wedge is a green dotted line, the new resistance is a thick green line). I am waiting for developments outside the market. And they develop like this:
Fig.5
The wedge resistance breaks through again. At the breakout, a buy entry occurs. The closing takes place within the range of the formation, which is also bad. Therefore, upon closing, the position is liquidated. We are waiting to see how events will develop further.
Fig.6
Expanding the range of the wedge. The price continues to trade inside the figure. The last candle closes with the inner one. Now all attention is focused on her. We need a breakout of its minimum or maximum. Accordingly, if the maximum breaks through, we buy, and if the minimum breaks through, we sell. We wait.
Fig.7 I buy on the breakdown of the internal candle upward. We are waiting for developments. The probability of a breakout of the figure's resistance upward is growing.
Fig.8
And here is the test! Price behavior is good so far. And there was a breakout on impulse, and the market immediately rushed up. We continue to hold purchases that we opened while still inside the figure.
Fig.9
The first surprise is the inner candle, and also the doji. A serious reason to think and increase risks. We move our stops to the minimum of the candle. We wait.
Fig.10
The next candle arrives and goes back into the wedge range. The red lines mark the purchase fixation zone, which was open. On the screenshot, daily chart. The day opens with a gap. Let's look at the screenshot inside this day to look at the options for fixing a long.
Fig.11
In the box I marked the previous day's doji. There are three options for fixation after opening (marked with numbers):
- Since the inner doji candle is broken down, it is necessary to fix it immediately. This can be done anywhere in the first candle. Please note that this is in the area of 166-166.5, which is ideal, and, practically, is the minimum of the previous doji candle, at the minimum of which a stop should be placed.
- The next candle is internal. You can close at the breakdown of its minimum.
- And the last option is to close the position at the breakdown of the local minimum.
These are the three closest possible situations. If you reduce the timeframe to a minute, then you can probably close even more profitably. Moreover. Does the chart or the nature of price behavior remind you of anything? That’s right, this is the most natural shock day, with its initial signs. Therefore, you can also shorten it well. But, I will not break away from the context of the article, and will continue to analyze the movement within the framework of the figure and timeframe that we began to consider.
Fig.12
Taking into account that the price has returned back to the wedge range, it is again necessary to redraw its upper border (the old resistance is the red dotted line, the new resistance is the green line). But then, graphically, this is no longer a wedge. But there is definitely an ascending local minimum, which can become the basis for drawing a triangle. We draw new lines (green) and get an excellent ascending triangle. In graphical analysis, this is not uncommon when one figure transforms into another. This is especially common in the head and shoulders pattern, which transforms into triangles and wedges.
Well, we continue to monitor the formation and wait for signals.
Fig.13
We enter shorts on the breakdown of the figure. The target is in the area of 148. This breakdown may occur on the gap from the opening. Therefore, let's take a look inside the breakout candle.
Fig. 14 On a five-minute frame, there are three immediate options for shorting:
- During the first candle (taking into account the risk binding within the formation range).
- At the close of the first black candle.
- At the breakdown of the local minimum.
We are waiting for further developments while on sale.
Fig.15
The day closes with an inner candle. If its maximum is broken, it will be necessary to close the deal, because a reversal may follow. Then the market moves like this:
Fig.16
- The price breaks the inside candle downwards, which intensifies the fall.
- The triangle target is executed almost perfectly, followed by a rebound.
In the target zone, you can try to take the rebound, because... this is often worked out. Naturally, with the use of junior frames and formations on them.
Fig.17
Eventually
along the wedge , of which:
- One to zero.
- The second is a minuscule loss.
- The third is profit.
That's not bad at all for a figure that's broken.
According to the triangle , we have one transaction that reached the goal and brought an excellent profit. Moreover, we are talking only about working out the figure on a specific timeframe, “head-on”. If we had entered short, taking into account the shock day (see Fig. 10, 11), then the entry would have been much more accurate - the very maximum of the formation.
Conclusion
Now I will summarize the trading rules for technical analysis figures and various graphic patterns, as I see it.
When trading using technical analysis, it is important:
- Remain open and flexible to market changes.
- The market and price owe no one anything.
- The behavior and actions of the crowd are displayed on the chart in the form of formations and patterns. This tends to repeat itself. Therefore, technical analysis will always work, no matter what adherents of other theories tell you. Read articles on the topic of technical analysis, there are many examples there with developments.
- There is always the opportunity to re-enter the trade. It's better than watching your deposit melt away. There is no need to be stubborn and hope.
- There is no need to argue with the market. The market is always right.
- For me, any formation is just price consolidation in one form or another. Although formations have a classification according to the classics of technical analysis, I do not make these distinctions. The breakdown is important to me, I don’t care in which direction. If it’s false, then I’ll close and re-login. If the target is not fulfilled and the price reverses, then I will take only part of the movement, which is also not bad (see the example with a false breakout of the wedge in Fig. 8, 9, 10). If it turns out to be true, then I will get the target according to the pattern . It's simple. The main thing is to track the formation step by step, as I tried to show in the article.
- Reliable patterns, if you can call them that , are worked out quickly. Those. the price rushes to the target almost immediately and without rollbacks. As it was in the example above with the ascending triangle.
- Use low-order frames for precision inputs and outputs.
- I do not advise inexperienced or newbies to trade inside the pattern.
- Each trader has a limit on total losses, after which he gets a shake-up and reconsiders his trading. If you are not yet trading correctly, it means you just haven’t lost enough yet. Don’t despair.
- Take screenshots after each day you trade and analyze them. So you will see a lot of interesting things.
That seems to be it. Happy trading!
Subscribe: Telegram, Mailing Channel, VKontakte, Facebook, Twitter
Kerry trade
Carry trade is used by many large companies around the world to generate significant interest income. Essentially, you buy a currency with a higher interest rate and sell a currency with a lower interest rate.
So, for example, if the Australian dollar has a 4% interest rate and the Japanese yen has a 1% interest rate, then buying the AUD/JPY pair will give a net 3% interest rate and this is considered a positive carry trade.
On the other hand, if you sold the AUD/JPY pair, you would pay a 3 percent interest rate. This is considered a negative trade. Traders should be aware of the impact of carryover trades when they buy and sell currencies because negative costs can sometimes eat up potential profits above expected returns.
You may be wondering why such a low interest rate would be attractive? It is important to remember that with this trading technique you can earn multiples of the difference in interest rates. For example, based on the 3% we mentioned earlier, a position with 1:10 leverage could potentially earn 30% per annum.
Now, although a carry trade sounds like a no-loss trade, the reality is that you should still be aware of potential market fluctuations while you hold your position. Depending on whether the market moves in the direction of a positive carry trade, you can make a profit or loss that exceeds the interest rate differential.
Essentially, the best carry trades are those that not only have an attractive interest rate differential, but also a positive market bias in the direction you choose.
Analysis of the graph and search for patterns
Let's get down to business. Let's come up with a strategy by searching for patterns in stock quotes. Let's open an hourly chart for example.
If you have a mathematical mind, then it is not difficult to find many patterns in the graph. For example, you can look for a pattern in the fact that at the opening the market most often opens with growth. If you look even more closely, you can say that the strongest growth occurs in the first hour; at lunchtime, quotes slow down or begin to fall. Beginners like to study morning price gaps because most often they are followed by a pullback.
And if we add indicators to the chart, we will find even more patterns. For example, I like the RSI oscillator. It’s easy to notice that when it enters the red zone (below 20), the price bounces up (of course, this is not in 100% of cases, but often). This situation is called oversold. And if the RSI is in the green zone (above 80), there is a possibility of an early decline.
Great, we've already come up with a few patterns. Is it time to earn money? We begin to act according to our methodology and it turns out that after the first two profitable transactions, the last one produces a loss. What to do? I don’t want to close it down. The market always rolls back up. As a result, our trading gradually developed into investing. The deal is going further into the negative, and we are just waiting.
Here's what happened a week after the flat discussed above:
If we also opened positions based on oversold and overbought conditions, we would have ended up in a good minus. As I already noted: one strategy works great in one period of time and loses in another.
What was the mistake? The fact is that we did not limit losses with a stop loss. In today's market, placing stops is problematic due to high volatility. Large players know exactly where the flow of sell orders accumulates and can artificially bring prices down to this level. And they themselves will buy our assets cheaply.
Therefore, if you set a stop, you need to do it at a decent distance from the current price. So that market noise and stock sharks do not cut him off. But if we set the stop 5-10% lower, it turns out that in one trade we are risking too much of the deposit. This means that we will have to open a position for a smaller amount. Somewhere by 10-20% of the deposit. In this case, we will risk significantly less even with a stopping level over a long distance. But on the other hand, we will earn less.
Further testing of the strategy turns into an inconvenient undertaking. After all, every time we will think differently and set stops the same way, so we need some rules. How to set a stop loss so that it really protects our position is an extremely large topic. I recommend to read:
- How to look for the best stop loss levels;
The divergence and convergence of the RSI and MACD indicators also works great. Perhaps these are some of the best trading strategies.
We made a small profit from price fluctuations. Well, let's say 1-3% per transaction. Over time, the trader will discover that periodically there are moments when the price leaves the range and moves by 10-15% in the direction of the breakout. We could make the average trader's annual income in one trade. So maybe we were wrong? Maybe it was worth opening positions the other way around; when the RSI exceeded 80, you should buy rather than sell? Strange as it may seem, such a strategy is likely to even give more profit, and the whole point comes from the paradox of price (we discussed this a little higher).
What can we say in the end?
Do the patterns in the market that we obtained when analyzing history over the past 1-2 months work? They work, but with a huge risk of going negative and turning us into long-term investors who will stubbornly hold on to what falls, instead of making money on subsequent growth. Setting a stop loss is difficult and no one wants to.
Of course, with a more thorough analysis of the history for at least 2 years, you can adjust the strategy in such a way that 2 transactions are negative and 3 are positive. In this case, the annual result will most likely be at the level of 10-20% per annum plus. Which is extremely small for daily trading operations. This takes up our time. Securities already grow by this percentage on average every year.
In fact, longer-term strategies bring more profit. Let's talk about them further.
Trading strategies: let's summarize
In this lesson, we discussed a variety of trading strategies in financial markets. We covered scalping, day trading, swing trading, as well as position trading on macroeconomic indicators. Additionally, we discussed the use of discretionary and algorithmic trading systems.
With this knowledge, you can decide which trading style best suits your personality. For example, my trading style is focused on a discretionary swing trading style. This is what works best for me and I stick with it. Now it’s your turn to explore the various options available and choose the best trading strategy for yourself.
Strong Level Trading System
This is my next development, which I actively use in my trading. By the way, at the time of writing this article, the Strong Level trading system is my last brainchild, which I posted for free on the general public. The Strong Level trading system is built on the principle of reversal from strong price levels - round price levels that are interesting to market participants. Unlike the trading systems described above, Strong Level is perfect even for novice traders - you need to have minimal knowledge of arithmetic.
Technical characteristics of the Strong Level trading system:
- Asset: any currency pair
- Time Frame: M15-M30
- Expiration time: end of next candle
- Number of transactions per day: 30-40
Which brokers should you trade with this trading system:
- uTrader
- FiNMAX
- Binomo
- Binary
An example of trading using the signals of the Strong Level trading system:
The Strong Level trading system has its own improved system for reducing possible losses. More details about the Strong Level trading system
Indicatorless Forex strategy. Work only 30 minutes per week
For very busy people, we have the best Forex strategy in our arsenal. Market analysis will only take half an hour a week. It brings huge profits to some traders. The profitability for a month of trading on it is 50 percent of the invested funds.
Yes, you heard right, you can earn fifty percent a month for simple actions. To do this you need:
- Open the terminal on Monday morning.
- Place orders.
- Take profit on Friday evening.
Work schedule:
H4.
Currency pairs:
AUD/JPY, EUR/JPY, CHF/JPY, GBF/JPY.
As you can see, this strategy involves playing by certain rules. Trading only with certain yen pairs is not easy to offer. It has long been noted that the way a currency paired with the yen behaves at the beginning of the week, so it will behave until the end of the week.
This indicator-free Forex trading strategy is unique in that if successful, the trader will receive a profit three times greater than the loss. After all, Take Profit exceeds Stop Loss three times.
How to work using a no-indicator strategy
First step
. First you need to set up your work schedule:
- We select a 4-hour chart and one of the yen pairs.
- Enable the period separator using the key combination Ctrl + Y (vertical dotted lines should appear).
Second step
.
On Monday morning, on the H4 chart, we determine the first candle within the new trading week (hint: it should be located on the dotted vertical line). Then we set 2 pending orders Sell Stop and Buy Stop. The first delay ( Sell Stop
) will be 20 points below its price minimum, the second (
Buy Stop
) will be 20 points above its price maximum.
It should look something like this:
Third step
. Stop-Loss must be placed at those levels where pending orders are placed. In other words, the Stop-Loss from the Buy Stop order must be placed in the place where the Sell Stop is placed, and the Stop-Loss of the Sell Stop order must be placed on the Buy Stop. The Take Profit size should exceed the Stop Loss size by three times.
Fourth step
. If the candle of the yen pair touches the pending order, there is no need to delete the second one, since there is always a possibility that the asset price may reverse and open a second pending order, thereby knocking down the Stop Loss of the opposite order. Next, turn off the terminal and go about your business until Friday evening.
In terms of optimization of a non-indicator Forex strategy, you can use the trailing stop tool, or manually move the Stop Loss to a positive zone. Is it true. Then the concept of strategy breaks down. You'll have to look into the terminal more often.
Important: if the size of the first candle in a new week exceeds 100 points, then it is better to refrain from entering this pair.
Strategy “Until the end of the day”
Meet another profitable strategy for Forex – “Until the end of the day”. This is an indicator trading system designed for long-term transactions with profit taking at the end of the day (23:30-00:00).
Markets:
Forex, commodities, CFD.
Work schedule:
H1.
Indicators used:
- Moving Average (21);
- Moving Average (9);
- ADX (14) with level 33.
How to use the “Until the end of the day” strategy
In order to open transactions on (BUY), the following conditions must be met:
- A slower moving average with a turquoise period (21) should be crossed by a blue moving average (9) from bottom to top.
- Candles are formed above two crossed moving averages.
- The turquoise line of the ADX basement indicator is above level 33 at this time.
To play sideways (SELL), you need to wait for the following market conditions:
- A slower moving average with a turquoise period (21) should be crossed by a blue moving average (9) from top to bottom.
- Candles are formed under two crossed moving averages.
- The turquoise line of the ADX basement indicator is above level 33 at this time.
Download TS “Until the end of the day”.
How to close positions?
This trading system involves closing orders at the end of the trading day.
“William's Percentage Share” Strategy
This is a purely trend strategy designed for both Forex and binary options.
All trades should be opened exclusively in the direction of the trend indicated by the two moving averages. Also, an additional filter for selecting trend movements is the basement indicator.
Work schedule:
M5-H4.
Markets:
any.
Financial assets:
any.
Indicators used:
- 9Squared MM;
- buy zone fibs;
- MMPrice;
- rsi chart bars;
- Williams Percent Range;
- sell zone fibs;
- XIT_FIBS.
How to use the “William’s Share Percentage” strategy
Important: for short-term trading, first track where the asset price is (above or below 2 moving averages). For example, first go to the 4-hour chart to determine the trend, and then go to M5 or M15 and wait for the trends to coincide.
To consider purchasing a currency pair (BUY), the following conditions must be met:
- Japanese candles are formed above two moving averages.
- The candles have a blue reference point.
- The yellow line of the basement Williams Percent Range indicator will reach the upper blue zone.
To be able to consider shorts, transactions on (SELL), you need to wait until the following conditions are met:
- Japanese candles are formed below two moving averages.
- The candles have a red reference point.
- The yellow line of the basement Williams Percent Range indicator will reach the upper blue zone.
How to close positions?
If the work schedule M5-M15
, then you don’t have to chase big profits and set small goals for yourself, for example, 5-10 points.
If a trader works on the M30-H1 chart
, then you need to wait until the price reaches the Fibonacci level indicated on the chart.
You can download the indicators and template.