Among the many strategies used by market participants, swing trading is the most comfortable and safe. It does not involve attempts to reverse the situation, but allows the trader to follow the natural flow of market processes, using ups and downs to their advantage.
Content
- Definition of Swing Trading
- Basic vocabulary related to Swing Trading
- Types of tools for swing trading
- Characteristics and Features of Swing Trading
- Example of technical analysis for swing trading
- Classification of Swing trading strategies
- Simple Swing trading strategy Forex
- Using the Additional MA Indicator in Swing Trading
- In Conclusion on Forex Swing Trading Strategies
A strategy that works
Based on the results, we can derive the basic rules of the trading strategy in swing trading.
The market is in consolidation
The trader waits until the price approaches resistance or support levels and a false breakout occurs. On the pin bar, he opens a position by placing a stop loss with a small buffer for the price below or above the level.
The market is trending
The market is entered when the moving average is reached (it is better to use the 50 MA). The trader waits for a reversal pattern to appear on the chart. Stop loss is set with a small gap from the entry point (1 ATR).
Definition of Swing Trading
Swing Trading
is a style of trading in financial markets that is focused on identifying the cyclical nature of price movements. Positions usually remain open for 2-3 days or more.
This approach assumes that each trend consists of several phases of growth and decline
. Swing traders try to capitalize on these short-term impulses and corrections. Swing traders typically hold positions open for several days to take advantage of larger market trends.
It is important to note that trading in financial markets does not guarantee profit and always involves risk.
The Swing Trading approach is universal
and can be used when trading various financial market instruments: stocks, bonds, stock indices, Forex, metals, energy and others.
- Synonyms
: wave trading. - Etymology
: The financial term swing trading comes from two English words “swing” and “trading”. The term "swing" means "oscillation", "swaying". The term “trading” means “trading”, “operations on the financial market”. Thus, “swing trading” is translated as “trading during periods of market fluctuations.”
Interpretation. Indicators and models
You already know that swing traders look at the market as a map of energy potentials. Now it’s time to familiarize yourself with the rules for interpreting market situations and the necessary tools for this. The most important factors for swing trading are price patterns, certain technical indicators, and fundamental factors.
1. Pricing models.
This tool is the main one in the arsenal of any swing trader, since the need to be one step ahead of the market majority dictates high demands on the speed of generating trading signals. Price patterns allow you to notice trends in advance by early graphical identification of their first pivot points. For example, you noticed that the price has currently formed the first three pivot points of a pattern that is well known to you. Thanks to this, you have the opportunity to start acting two steps earlier, since with a certain degree of probability you can expect that the five-point model will be built to completion. By the way, the percentage of this probability is quite measurable. In the specialized literature, there are statistical samples that demonstrate the percentage of successful completion of a particular graphical model.
Pay attention to classic formations, for example, triangle and flag figures. They form a clear picture, on the basis of which you can successfully build trading tactics several steps forward. Moreover, when combined with the simultaneous monitoring of the energy state of the market, price models can become an extremely flexible tool for finding and successfully exploiting false market movements. Volatility analysis can significantly complement price models and help out in situations where the pattern does not work as expected.
Expansion and contraction models can be considered extremely effective. This is the clearest example of cyclicality in changing trends. They most clearly demonstrate the energy charge of the market, since when approaching the maximum points of growth or decline, the bars expand and volatility reaches its peak. Then comes the stagnation zone, when volatility decreases. This period will last until the conditions for a new breakthrough are formed. Recognizing the direction of a new movement using price models is much easier and more reliable than using technical indicators, and then you will understand why.
2. Technical indicators.
This tool is designed to facilitate the analysis of the market situation and confirm already formed strategic views. Indicators are recommended to be used to confirm price patterns, but not to open positions independently. Moving averages or price rate indicators are good up to a point, but as soon as the stagnation zone drags on or volatility gets too high, they lose their effectiveness and begin to “stick” in one range. Another significant drawback is the delay in readings of all indicators.
They are based on this property; it is the delay that makes it possible to identify many patterns. But the essence of swing trading is to be ahead of the crowd, ahead of the wave, and not to be far behind all the events.
3. Fundamental factors.
Local and global factors have a strong impact on the state of both the stock and financial markets. The market digests information and does it in cycles. The publication of macroeconomic indicators, as well as the release of political news, always affects the activity of trading participants. Such moments are triggers for a one-time release of accumulated volatility. It is, of course, not so easy to predict in which direction a given emission will go, but it is still necessary to take this feature into account.
So, now you understand why the main partners of a swing trader are chart patterns, cyclicality and volatility. The disadvantage of technical indicators is that they lag very much. And in the concept of swing trading, this property is simply unacceptable. Indicators are suitable for confirming price patterns or preparing for direct market entry, but nothing more.
Basic vocabulary related to Swing Trading
✔️ Trend
- a pronounced tendency when quotes move along an upward or downward trajectory.
✔️ Flat
- movement of quotes that does not have a clearly defined trend. This movement is also called a "lateral movement" or "lateral movement".
✔️ Pulse
— the phase of movement of quotes within a trend, developing in the direction of the main trend. For example, if the long-term trend is up, then each short-term or medium-term up trend can be called an impulse.
✔️ Correction
— the phase of movement of quotes within a trend, opposite to the direction of the trend. For example, if the long-term trend is up, then every short-term or medium-term downward trend can be considered a correction.
✔️ Price channel
is a trading range within which the quotes of an asset change over a certain period of time. Typically, this channel has a pronounced trend direction - upward, downward or sideways.
✔️ Upper limit of the price channel
is a conditional restriction on the movement of quotes “from above”, formed on the basis of an analysis of historical data.
The upper limit of the price channel can be considered by a trader as a resistance level
.
✔️ Lower limit of the price channel
is a conditional restriction on the movement of quotes “from below”, formed on the basis of an analysis of historical data.
The lower boundary of the price channel can be considered by a trader as a support level
.
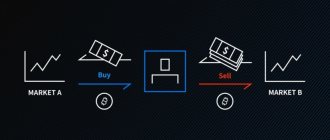
✔️ Buy position (BUY, long)
is a trading order that a trader opens in anticipation of a future price increase.
✔️ Sell position (SELL, short)
is a trade order that a trader opens in anticipation of a future price drop.
✔️ Trading platform (trading terminal)
is a specialized computer program with which you can analyze the dynamics of quotes, as well as open, modify and close trading positions. The MetaTrader 4 and MetaTrader 5 platforms are examples of a trading terminal.
✔️ Swing Trader
is a person who trades in financial markets using the Swing Trading approach. He can analyze company stocks, study currency quotes and trade Forex or apply the Swing Trading approach to other markets.
✔️ Swing Trade
is a trading operation in financial markets managed within the framework of the Swing Trading approach.
Even if a trader is interested in fundamental analysis and studies macroeconomics and finance, he can enter swing trades
. By definition, this approach is general and can be used in conjunction with other analytical approaches and tools.
➠ Start trading real quotes on a demo account. Use virtual money and create your trading strategy for FREE!
Conditions for opening and closing swing-trading positions
Before we talk about how swing traders open and close trades, let’s consider the most important condition, without which effective work is simply impossible. Emotional stability is the basis for a swing trader's successful trading activities. It is impossible to make money on the emotions and reactions of other traders when you yourself are at the mercy of your feelings.
You must remain outside the majority of market participants in order to look at the situation from the outside. And also you must be rational in order to consider the irrationality in the actions of others. Yes, that probably sounds too specific. Indeed, you cannot personally see each trader and his actions. But you don't need that. You see the situation on the market and the reaction of the majority to it. This is more than enough to grasp the general idea and not be hostage to emotional decisions.
And now more specifically about opening and closing transactions. Firstly, you can use almost any time frame. You can trade equally successfully on both the 5-minute and weekly charts. Secondly, learn to build your strategy in relation to the entire market and a specific trading position. The idea of swing trading is to be several steps ahead of the market, which means that the points for decisive actions must be determined in advance.
This very much depends on the experience and professionalism of the trader, but you should always strive for this. The exception is when the market goes against your analysis. In this case, you should have an emergency plan. Being prepared for mistakes also means being one step ahead.
Opening a position must be clearly planned. The best period for analysis is the period of stagnation and accumulation. At this time, you can create a map of the balance of forces, study the chart, find the starting points of price models, and check the data of technical indicators. Your goal is to enter at a level close to a strong support or resistance level at a time when the crowd is about to move the market in the desired direction. Look for periods when price is moving sideways and identify the point at which the current narrow corridor will be broken. Graphic models and technical indicators will help you here. The second successful moment for a swing trader is a trend reversal. To successfully enter the market at the point of change in direction of movement, it is best to use Japanese candlestick patterns, such as doji, harami and hammers (see more details). You can also successfully trade on pullbacks using Fibonacci levels. Positions can range in duration from a few minutes or hours to one week.
See: “Fibonacci Levels”
The closing of a transaction can be postponed to the next trading day if the nature of the movement is positive. An overnight breakup can work in your favor. But it is worth remembering that you cannot leave a position for the weekend - this is too long an interval, after which the market can suddenly change its state. The cycle model is based on a 5-day system and it is most likely that a new cycle may begin after the weekend. If the price does not move as you expected, then it is best to exit on the first pullback. And in general, you should not be captured by your open positions. You must be prepared to fight for better conditions that may arise at any moment. It is best if you determine the closing point of the transaction in advance - these are ideal conditions.
Types of tools for swing trading
By definition, Swing Trading is a versatile style of trading that can be applied to a wide variety of markets as a stand-alone analytical tool or as part of a more comprehensive trading strategy.
➡️ Having answered the question “What is swing trading?”, let’s look at its application in practice
. Let us consider below the features of using the Swing Trading method for different classes of trading instruments:
➠ Swing trading in the Forex market. ➠ Swing trading in the stock market: stocks, bonds, ETFs. ➠ Swing trading and stock indices.
Remember that you have an excellent opportunity to receive analytics from our experts, which are published almost every trading day, completely FREE!
✅ Articles on Fundamental Analysis and Weekly Market Reviews via LINK.
✅ Articles on Technical analysis of financial markets via LINK.
Follow the latest market news for trading on various instruments in our ➡️ Economic calendar ➡️ via LINK!
✅ Swing trading in the Forex market
➠ What is swing trading in the Forex market?
By definition, this means applying the Swing Trading approach to the Forex market. The analysis process might look like this:
- The trader selects the currency pair he is interested in and the timeframe that suits him.
- The trader determines the direction of the main trend
of his trading range. - In this trading range, the trader distinguishes phases of growth
(impulses) and
phases of decline
(correction) of quotes. To do this, you can use various analysis tools: Elliott Wave Theory, Donchian Channel, Bollinger Bands indicator and others. - The trader identifies the current phase
of the market movement and looks for suitable price areas to open positions.
✅ Swing trading on the stock exchange: stocks, bonds, ETFs
By definition, swing trading in stocks, bonds, and ETFs is similar to swing trading in other markets. How to swing trade the stock market?
Let's look at several approaches to opening and closing positions.
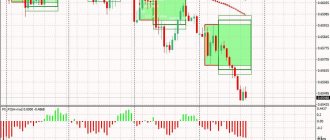
1️⃣ Trading inside the channel
. This method involves identifying a price channel and opening and closing trades at its boundaries.
For example, opening buy trades near the lower border of the channel and closing near the upper border. Or, opening a sell trade near the upper border of the channel and placing a Take Profit order near the lower border.
| ✍ It is important to understand that quotes do not have to move from border to border, so the trader’s capital is always at risk. Swing trading involves the trader periodically studying the market and performing repeated analysis , if open trades are closed prematurely. For example, repeated analysis can show a trader that the probability of achieving the set take profit at one of the channel boundaries is decreasing. |
START TRADING
2️⃣ Trading according to Elliott wave theory
. According to this approach, the market constantly moves along a certain trend. If the trend is not visible, you need to change the timeframe.
✅
Movement within a trend has periods of impulses and corrections. Elliott's theory implies that
- each impulse consists of 5 waves, and
- each correction includes 3 waves.
Each of these waves has its own name and potential limits, which can be calculated using Fibonacci methods. Swing traders can identify the beginning and end of each of these waves and trade them.
3️⃣ Trading using the Zig-Zag indicator
.
This indicator is available for free
on the MetaTrader trading platform.
It automatically shows the trader past trend movements, the magnitude and scope of which depends on the parameters that the trader sets when using the indicator. You can learn about many other features of the MetaTrader 4 terminal in the article “ Detailed MetaTrader 4 Guide
”.
The Zig-Zag indicator allows you to determine the size of each trend movement, as well as its duration. Thanks to this, a trader can calculate the average size and average duration of uptrend and downtrend movements on a given timeframe and use this knowledge for trading.
| ✍ The Zig-Zag indicator can be used to build an independent strategy or as an additional element for identifying Elliott waves. |
Watch the video