In order to correctly make forecasts regarding the price of an asset and analyze the situation on the market, you must be able to determine the downward and upward trend on the currency chart. Learning to distinguish them from each other, and also not to confuse them with sideways movement, is important for every novice trader at the beginning of his Forex trading activities.
First, it’s worth understanding what each trend is characterized by.
Uptrend
It is also called “bullish” and is characterized by rising price lows and highs. On the chart, an ascending trend line is drawn from bottom to top along at least two price lows. It is best visible over a long time period, that is, a four-hour chart will be more informative than a five-minute one. A global long-term trend can only be seen on a large time frame. This trend has strong boundaries, and its high angle of inclination shows the activity of players who stimulate price changes.
It is important to learn to recognize the classic patterns of an uptrend, which can signal its continuation with periods of usual corrections (deviations) or a reversal. In the first case, you should open a buy deal, waiting for the rollback to complete and the trend to continue; in the second, you need to open a sell transaction at a trend top, being ready for the start of a new movement.
What are trend phases
There are three of them and they relate to both ascending and descending: accumulation, stabilization, distribution, and that’s what they mean.
Accumulation is the first phase. This refers to the accumulation of a position, when traders place orders, including pending ones, and determine whether they are going to buy or sell. That is, everyone seems to choose a side in the confrontation between buyers and sellers. Some traders believe that it is better to buy now, while others decide to sell. This causes temporary parity of forces and the market is in a flat; there is no main trend yet.
When, in the end, the forces of one of the parties outweigh, a trend begins. If buyers are stronger, it will be upward, if sellers - downward. This is how the second phase begins. The greatest profits can be made by those who correctly predicted during the accumulation phase where the market will move - up or down and entered the market early. But the risk here is that you can make a mistake, then you will receive a loss.
Stabilization is the second phase, which means that the market has decided on the direction and the trend has stabilized and formed. The forces of one of the parties have won and all traders are actively following the emerging trend. The best and safest way to trade is to enter the market at the beginning of the stabilization phase, so that you can move with the trend and not risk trying to guess the direction in the accumulation phase. At the same time, late entry into stabilization is a bad idea, since at any moment the market can move into the third phase, which is called distribution.
Distribution - the time for fixing or distributing profits and ending the current trend. Competent traders have received their profit and decide to fix it - to close positions. This causes the trend to go flat or serves as the beginning of an opposite trend. This is why entering the market at the end of the stabilization or, especially, distribution phase is a bad idea. Quotes begin to “sausage” and this sausage is not predictable.
Here you will either be lucky and manage to earn something (usually crumbs, all the profits were in the trend, but now there is none), or there will be complete losses. So the distribution phase is the time to exit the market for those who have successfully worked in a trend, upward or downward, and not the time to open new positions.
From all that has been said above, I am sure you have already been able to draw the correct conclusion: the safest time to open a position is the beginning of the stabilization phase, and the worst time is the distribution phase. The risky, but potentially most profitable time is early entry during the accumulation phase.
Lateral movement
Flat prevails in the market and takes up 80% of all time. During this period, a small price corridor is observed, which is limited by 2 horizontal lines. Often this situation precedes a significant price impulse - a trend movement. During a flat, the price seems to collect all its potential, and at the end of it, it rapidly rushes up or down. It is especially important for every trader to learn how to open positions when a trend begins after a long flat.
It is worth saying that the ability to determine the origin of a trend movement - whether it is an upward or downward trend - is important for a trader’s trading results.
Optimal opening of a position and increasing the chances of profit requires correctly identifying the trend at its very beginning. That is why a beginner in Forex should understand the features of each trend movement. We remind all traders that the catalog of investment companies has been updated, in which you can invest without independent trading.
Trend is your friend
You may have already heard this expression. Here we mean any of its directions, both upward and downward. Why do they say this? Let's figure it out.
In fact, everything is quite simple here. It is much easier to make money in a trend, since the market is predictable, it clearly shows you its intentions to move in one direction or another. All you have to do is follow him! All trend following strategies are based on this principle, such as Elder's Three Screens strategy or its more modern version, the FBI strategy.
So the conclusion is simple: trend is your friend. Follow its direction and make a profit. If it is directed downward, sell, if it is directed upward, buy.
False breakouts on trends
Trends can be interrupted by false breakouts, and then recover and move on as if nothing had happened.
False trend breakout
You need to pay special attention to false breakouts, because... these are excellent points to make a deal. All trading strategies using false breakouts can be found in the article: False Breakout. How to determine a level breakdown.
Identifying weakness in trend movement
We know that any trend consists of the trend movement itself and a period of rollbacks.
A trend move is a strong phase of the market when the price moves in one direction and consists predominantly of bullish candles. Bullish candles are larger than bearish ones and close near their highs. When bullish candles become smaller, it indicates that buying power is weakening, or there is equal selling pressure.
The size of the candles will not give you a guarantee that the market will reverse. But this is definitely a signal that indicates the weakness of buyers.
A pullback is the opposite of a trend move, where the price moves against the underlying trend. Retracement periods are dominated by bearish candles, which are relatively small and usually close near the middle or low of their range.
When bearish candles become larger, it indicates that selling pressure is increasing as buyers are unwilling to buy at higher prices.
Again, this does not guarantee that the market will definitely reverse. But this is a sure sign that buyers are becoming weaker.
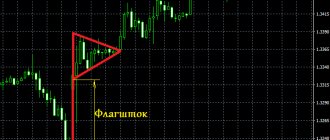
Masterforex-V triangles: how are they formed and what is the strongest triangle penetration?
Any triangle is the intersection of the Sloping Channel (NC) MF and a strong horizontal level of resistance and support . When does the market give a strong signal?
I give only ONE triangle combination out of MANY from the closed forum of the Masterforex-V Academy.
Fig.20. Masterforex-V triangles: how they are formed and what they mean
Is the answer clear? The higher the wave level of the impulse (trend), the stronger this wave will be , breaking through the descending triangle in a bearish trend.
Triangles Masterforex-V: what is the weakest signal when a triangle is broken?
The weakest signal when the triangle is broken is the wave of the lower time frame (TF) - m30 - n1. From the point of view of wave analysis, this could be the 5th subwave of the current trend, followed by a powerful upward reversal
Fig.21. Triangles Masterforex-V: what is the weakest signal when a triangle is broken?
Thus, when the triangle is broken, a “weak signal” turns into a strong signal in the opposite direction. This is the absolute opposite position of Masterforex-V to what Alexander Elder, Eric Nayman, D. Murphy wrote about breaking through the descending and ascending triangles.
Trading with the trend - strictly recommended
Many people associate trend following trading with positional trading. In fact, any trader, be it intraday, swing or positional, looks for a trend on the chart. Give yourself an answer to the question: why?
Based on the information we have already received about market phases and the Elliott wave theory, we can authoritatively say that a trend is a gold mine, a source of profit. Trend is truly our friend. Therefore, being able to recognize a trend in a chart and its changes (learn how to spot a trend reversal 80% of the time) is paramount.
Looking ahead a little, I will say that to determine the direction of the market, we will use a moving average, which will greatly simplify our trading. And now a little theory.
Summary
- Downtrends are characterized by lower peaks and troughs and suggest fundamental changes in investor beliefs.
- A change in trend is caused by a change in the supply of stocks that investors want to sell compared to the demand for stocks from investors that want to buy.
- Bearish trends coincide with changes in factors that surround security, whether macroeconomic or related to a company's business model.
And that’s all about the downward (bearish) trend today. I hope the article was useful to you. Share the article on social networks and instant messengers and bookmark the site. Good luck and see you again on the pages of the Tyulyagin !
- 3
Shared
DETERMINING TRENDS USING MAXIMUM AND MINIMIMA
One standard definition of an uptrend is: a sequence of higher highs and higher lows. For example, in Fig. 3.1 in the period from March to September, each relative high (RH) is higher than the previous maximum and each relative low (RL) is higher than the previous minimum. Essentially, an uptrend can be considered unbroken until the previous relative low is broken. Violation of this condition serves as a warning that the trend may have ended. For example, in Fig. 3.1 the October breakdown of the September relative minimum turns out to be a harbinger of a subsequent fall in prices. It should be emphasized, however, that a break in a pattern of higher highs and higher lows (or lower highs and lower lows) should be viewed as just one possible sign and not a definitive indicator of a reversal in a long-term trend. In Fig. Figure 3.2 provides another example of an upward trend, defined as successively increasing highs and lows. Likewise, a downward trend can be defined as a sequence of lower lows and lower highs (Figure 3.3). A downward trend can be considered unbroken until the previous relative high is broken. Upward and downward trends (or trends, which is the same thing) are often distinguished on graphs by straight lines (trend lines).
Figure 3.1.
UP TREND AS A SEQUENCE OF HIGHER MAXIMUM AND HIGHER HIGHER MINIMUM: EURODOLLAR, DECEMBER 1992
D91 J92 Fob Mar Apr May Jun Jul Aug Sep Oct Nov Dec Note: RH - relative maximum; RL - relative minimum.
Figure 3.2. UP TREND AS A SEQUENCE OF HIGHER HIGH AND HIGHER LOW: TREASURY BONDS, DECEMBER 1992.
D91 193 Feb Mar Apr May Jun Jul Aug Sep Oct Nov Dec Note: RH - relative maximum; RL - relative minimum.
Figure 3.3.
DOWNTREND AS A SEQUENCE OF LOWER MAXIMUM AND LOWER MINIMUM: COFFEE, DECEMBER CONTRACT, 1992
O91 Nov Dec J92 Feb Mar Apr May Jun Jul Aug Sep Oct Nov Dec Note: RH - relative maximum; RL - relative minimum.
Figure 3.4. UP TREND LINE: SILVER, JULY 1993
Figure 3.5. UP TREND LINE: EURODOLLAR, JUNE 1991
Jul-90 Aug Sep Oct Nov Dec
Figure 3.6. DOWN TREND LINE: CONTINUOUS FRENCH BOND INDEX FUTURES ON MATIF*
* MATIF (Marche a Terme International de France) - French international commodity and futures exchange. — Approx. ed.
Figure 3.7. DOWN TREND LINE: NEARBY COCOA FUTURES CONTRACTS
Figure 3.8. DOWN TREND LINE: CONTINUOUS COCOA FUTURES
Figure 3.9. UP TREND CORRIDOR: EURODOLLAR, JUNE 1991
Figure 3.10. DOWN TREND CORRIDOR: COCOA, SEPTEMBER 1992
An upward trend line connects a sequence of lows (Figures 3.4 and 3.5); the downward trend line connects the sequence of maxima (Fig. 3.6). Trend lines can sometimes last for many years. For example, in Fig. Figures 3.7 (nearest contract chart) and 3.8 (continuous futures) show downward trends in cocoa prices that have lasted almost a decade. Often, a reaction against a price trend begins near a line parallel to the trend line. Parallel lines that limit the price trend are called trend corridors. In Fig. Figures 3.9 and 3.10 show long-term upward and downward trend corridors. The following rules generally apply to trend lines and corridors:
- Price declines approaching an uptrend line and price increases approaching a downtrend line are often good opportunities to take positions in the direction of the underlying trend.
- A breakout of the uptrend line (especially if it is confirmed by the closing price of the day) is a signal to sell; a breakdown of the downward trend line is a signal to buy. To confirm a breakout, a minimum percentage of price change or a minimum number of daily closes behind the trend line is usually set.
- The lower line of a downward trend corridor and the upper line of an uptrend corridor represent potential profit-taking areas for short-term traders.
Trend lines and corridors are useful, but their importance is often exaggerated. It is easy to overestimate the reliability of trend lines when they are plotted after the fact. What is often overlooked is that as a bull or bear market develops, trend lines often need to be adjusted. Thus, although a breakout of a trend line will sometimes serve as an early warning signal of a trend reversal, such a development can equally well lead to just a simple correction of the trend line. For example, fig. 3.11 contains a continuation of the fafik in Fig. 3.4 for another two months. Bottom line in Fig. Figure 3.11 represents a trend line that could be drawn using all available data. The upper line is a continuation of the trend line in Fig. 3.4, based on price data available before June. The June breakdown of this line did not lead to a trend reversal, but simply made it necessary to adjust the trend line. It is worth noting that the pattern of higher lows and
Figure 3.11. UP TREND LINE ADJUSTMENT: SILVER, JULY 1999
Figure 3.12. UP TREND LINE ADJUSTMENT: EURODOLLAR, JUNE 1991
| J90 Aug Sep Ocr Nov Dec J91 Feb Mar Apr May Jun |
Figure 3.13. DOWN TREND LINE ADJUSTMENT: CONTINUOUS FRENCH BOND INDEX FUTURES ON MAT1F EXCHANGE
higher highs remained intact even after the June breakout of the trend line. Similarly, Fig. 3.12 is identical to Fig. 3.5 with the only difference that the depicted period is extended for five months. Bottom line in Fig. Figure 3.12 represents an upward trend line that could be drawn based on new data. The top line reproduces the trend line in Fig. 3.5, built on information available before January. The January breakdown of this line did not lead to a trend reversal, but simply made it necessary to adjust the trend line. In Fig. Figure 3.13 shows a similar example for a downward trend line. This drawing is identical to Fig. 3.6 except that the period depicted is extended by two months. The top line in Fig. Figure 3.13 represents a downward trend line that could be plotted based on new data. The lower line reproduces the trend line in Fig. 3.6, based on information available before May. The May breakdown of this line did not lead to a trend reversal, but simply made it necessary to adjust the trend line.
Figure 3.14. DOUBLE DOWN TREND LINE ADJUSTMENT: CONTINUOUS FRENCH BOND INDEX FUTURES ON MATIF EXCHANGE
Similarly, Fig. 3.14 is identical to Fig. 3.6 and 3.13 with the only difference that the depicted period is extended for another four months (relative to Fig. 3.13). The bottom lines are transferred from Fig. 3.6 and 3.13 and represent trend lines as of May and July, respectively. The breakdown of these lines did not lead to a trend reversal, but simply made it necessary to adjust the trend line. This example shows that the trend line sometimes has to be adjusted several times.
The above examples indicate that a breakout of a trend line is the rule rather than the exception. It is an undeniable fact that trend lines must be broken, sometimes repeatedly, as they evolve, which is the same as saying that trend lines are often corrected as they extend. The important takeaways from this observation are that trend lines work much better in hindsight than in real time, and breakouts of trend lines often turn out to be false signals.
Setting goals
DeMark sequence
Opposite opinion
False signals
Change of opinion about the market
Timeframes for uptrends and downtrends
There are short-term and long-term trends, this concept also applies to both trends - both upward and downward. On different timeframes and with different moving average period settings, the trend will be defined differently. So, on older TFs, from hourly and higher, we will observe a long-term trend. At lower levels - short-term. This is completely normal when, within a day, on small timeframes below the hourly one we will have, for example, a downward trend, and on older ones, let these be daily charts, the trend will be upward.
It's the same with moving averages. The longer you set the period, the longer-term trend the indicator will display. To understand which trend you should be interested in in terms of trading - short-term or long-term, you must decide how long you want to keep the position open.
If you trade intraday and the lifetime of the transaction does not exceed a day, then you should be interested in the short-term trend; accordingly, look at small timeframes, for example, the one you are trading on. If you hold a position for several days - long-term, you will look for it on high timeframes.
Advantages and disadvantages of trend trading
The concept of trend is one of the key ones in technical analysis on Forex and the stock market, where price behavior is graphically reflected and forecasts are made on its basis. The first thing a trader learns is to look for and follow a trend, because... this is his main income in the future.
Trend trading is the most common type of trading in financial markets and Forex. A well-known proverb among traders says trend is your friend, which means the trend is your friend. Trading in the direction of the current trend allows the trader to clearly determine entry and exit points from the market, extract maximum profit from price movements and minimize trading risks.
The disadvantage of trend trading is the individual perception of each trader. For example, lines of the same trend drawn by two traders may differ. As a result, one trader will observe a breakout of the trend line, the second trader will only see a touch.
The reliability of a trend depends on the size of the timeframe - the older the timeframe, the more reliable it is, but, accordingly, it takes much longer to form.
The popularity of trend trading has led to the emergence of a huge number of trend trading strategies and trend indicators.
How to determine if the trend is currently up or down and how it is displayed
In addition to the simplest method - visual, there are clearer options that also display the moment the trend changes. In general, there are many such methods, there are various indicators for this, and they all use their own approach. We'll look at a couple of the most popular methods. The first one is a trend line.
Read more about how to build it correctly here; it’s worth a separate article, but now let’s give a short example.