The concept of “second-tier shares” and their difference from blue chips
Second-tier stocks are securities issued by companies with lower capitalization and stability compared to blue chips. This group includes fairly large enterprises without widespread worldwide popularity and demand. Issuers use a moderate marketing campaign in relation to these shares, and therefore investor interest in them is not as great as in blue chips.
The main criteria for evaluating the second tier of shares:
- moderate liquidity - quick sale is possible, but probably with a loss in price;
- wide spread - from 2 to 3%;
- high volatility - from 7 to 10%;
- average trading volume - sufficient for the investor to buy and sell the required number of shares;
- often higher dividends than blue chips, but their payment stability is lower.
In practice, first-tier stocks rarely achieve annual growth of more than 15%. By comparison, less liquid assets are able to demonstrate an increase in value more than twice a year. The reason is that the issuers of these securities are sometimes companies with great development potential, but which have not had time to demonstrate it - undervalued organizations.
Second-tier shares are preferred by investors with a long-term investment strategy. A wide spread prevents you from making quick profits, but high volatility indicates the promise of these assets. This approach helps balance the portfolio. Less liquid assets are less reliable than blue chips, but their value lies in their ability to provide good returns in the future.
Examples of Russian and foreign second-tier companies
A fairly large number of second-tier shares are traded on the domestic and foreign markets.
Many of them have a high probability of reaching the level of blue chips in the future due to their relatively high capitalization and increasing demand among investors. Top 10 Russian second-tier companies for 2022
| Company | Ticker | Industry |
| Bashneft | BANE | Oil and Gas |
| Mechel | MTLR | Mining and metallurgy |
| AvtoVAZ | AVAZ | Automotive industry |
| Cherkizovo group | GCHE | Food industry - pork and feed processing |
| Irkutskenergo | IRGZ | Energy |
| Kazanorgsintez | KZOS | Chemical industry |
| Mostotrest | MSTT | Construction |
| Protek | PRTK | Pharmaceuticals |
| Promsvyazbank | PSBR | Finance |
| Raspadskaya | RASP | Coal mining |
Foreign companies issuing second-tier shares are more capitalized than Russian ones due to the greater development of the foreign stock market.
This gives the assets of foreign enterprises an additional dose of reliability and stability for investment. Top 10 foreign second-tier companies for 2022
| Company | Ticker | Industry |
| Horizon Technology | HRZN | Finance |
| Illumina | ILMN | Medicine |
| JOYY | YY | Telecommunications |
| KLA | KLAC | Equipment manufacturing |
| Livent | LTHM | Chemical production |
| Moderna | MRNA | Biotechnology |
| Sunrun | RUN | Development of equipment for the use of solar energy |
| TJX | TJX | Trade |
| Verizon | VZ | mobile connection |
| Welltower | WELL | Real estate |
RTS-2 Index
One of the most important values used on stock exchanges is the RTS index. It reflects a summary assessment of the 50 most liquid issuers. In addition to this indicator, the sites use another form and method for determining the trend of market movement. For example, the RTS-2 index. It allows you to track dynamics over various periods of time: a week, a year, several years.
The number “2” reflects the fact that the total value of second-tier shares is included in the calculation
RTS-2 helps investors determine the overall dynamics in relation to medium-liquid assets. Shareholders who plan to invest money in promising securities pay special attention to this index. That is, assets that have the potential to become market leaders and bring good income to the investor.
The tool is also used for the opposite purpose, to assess the prospects and growth rate of existing first-tier shares. In the case when the RTS grows more slowly (or falls faster) compared to the RTS-2, this becomes a signal to refrain from investing capital in blue chips. Information about the index is posted and regularly updated on the Moscow Exchange website.
Review of some shares of second-tier issuers from the RTS-2 index according to the financial portal Finanz.ru for 2022.
List of Russian 2nd tier shares
Until 2022, the MICEX calculated an index (MICEXSC), which included a rating of second-tier securities with distributed weights. I will build on this, deleting from the 2022 list companies that, for one reason or another, have lost their publicity or have significantly changed their level of liquidity.
Current list 2022
| Ashinsky Metallurgical Plant | Saratov Oil Refinery | IDGC of Volga |
| En+ | HVAC | IDGC of the North-West |
| AFK System | Lenenergo | MOESK |
| Bashneft | LSR | Mostotrest |
| Bank "Saint-Petersburg | Megaphone | Mechel |
| ChMK | IDGC of Center | NKNKH |
| Enel Russia | IDGC of Siberia | OGK 2 |
| Cherkizovo | IDGC of Center and Volga Region | Protek |
| Irkutskenergo | IDGC of Urals | Kiwi |
| Kuzbass Fuel Company | IDGC of the South | Raspadskaya |
| Rostelecom | Sollers | THC 1 |
| THC 2 | Transcontainer | VSMPO-AVISMA |
| Unipro | Phosagro | Rusal |
| NCSP | Gazpromneft | TMK |
| AKRON | Shoes Russia | Mosenergo |
| Child's world | NKHP | M Video |
| KAMAZ | PEAK | ICD |
| Mostotrest | FGC UES | Inter RAO |
This list may be supplemented or deleted depending on various factors. If anyone has different opinions about where the papers of a particular organization can be attributed in 2022, write in the comments.
Risks and features of trading
Conducting transactions in shares of second-tier issuers is a riskier activity compared to trading in liquid assets. The subtleties of the agreement are determined by a number of certain factors that increase the risk of investing funds:
- Little known issuer. Small firms known to a small circle of people may be significantly undervalued or excessively overvalued. This can lead to a serious increase in stock prices in a short period of time, as well as cause a rapid collapse.
- Lack of news. It is more difficult to obtain reliable information about the activities of an issuer belonging to the second echelon compared to blue chips. The factor prevents a timely response to positive changes in the organization’s activities that change the investor’s opinion about its value.
- Low liquidity. Execution of an order for a purchase and sale transaction of shares of companies with medium and low demand on the market sometimes takes from a couple of hours to several days. During this time, there is a risk of changes in the value of the asset and not always for the better.
- High spread. The low liquidity of shares of little-known organizations causes a significant difference between the price of their acquisition and sale. This factor can reduce profits or cause losses even with a subsequent increase in the value of the asset.
Trading in second-tier shares requires mandatory compliance with several rules:
- portfolio diversification - investing money in shares of different enterprises;
- tracking information on shares - refraining from purchasing securities of companies about which almost nothing is known;
- liquidity control - when a signal to sell shares appears, an order is submitted in advance before a negative change in its price.
To achieve high income, professional investors do not limit themselves to blue chips. Profit comes from an investment portfolio that is properly filled with securities of different levels of liquidity and risk, including second-tier shares. The main thing is a deliberate strategy of action and constant monitoring of the situation on the stock market.
Blue chips VS second tier. What to choose
Investors have noticed that since the beginning of 2022, the trend toward faster growth in large stocks and a slowdown in the dynamics of “second-tier” securities has begun to intensify. Let's look at the reasons for this process.
Fundamental Prerequisites
Small- and mid-cap stock indices are leading indicators of movements in broad equity indices. And this is not surprising.
The cyclical nature of economic development provides for the outpacing growth of developing companies over developed ones with a general rise in the economy.
Conversely, stagnation of business activity in the world or in a particular country causes, first of all, a reduction in the business of small economic entities.
It is quite difficult for large companies to achieve high development indicators from year to year. The growth rates of operating and financial results of “established companies”, as a rule, are at a stable level, not much higher than their weighted average cost of capital.
At the stage of their development, small companies are usually characterized by a high proportion of debt capital in the balance sheet structure. This fact allows them to take advantage of suitable market conditions and, due to the “financial leverage effect,” show impressive results of their financial and economic activities.
Expectations of a slowdown in the global economy lead to the fact that developed companies, having significant reserves, experience less pressure from the debt market and have greater opportunities to survive “hard times.”
The trends described above are confirmed by the look at countries from international rating agencies when classifying them as “developed” and “developing” economies.
Thus, the Fitch rating agency notes that emerging markets are facing more downgrades than upgrades in the next two years due to weakening global economic growth, as well as the likely strengthening of the US dollar.
In general, the sensitivity of internal and external environmental factors manifests itself to a greater extent in developing subjects.
Securities of companies are influenced by various drivers of their pricing. The scale of a company directly affects the liquidity of its equity and debt financial instruments. And the liquidity of a security characterizes the risks inherent in investing in it.
Thus, we are now witnessing a process of avoiding investing money in shares of mid- and small-cap companies. The main flows of liquidity are directed to large companies, causing an increasing increase in their market value. Such trends are also noted in studies by TradingAnalysis.com, Strategic Wealth Partners and others.
We have a paradoxical situation where the high risk of developing companies with low and mid-capitalization does not provide increased returns from investing money in them. Investment risk indicators remain at a reasonably high level, and stock returns significantly lag behind general market trends.
The largest issuers continue to enjoy increased demand, ensuring their quotes rise to new historical maximum prices, while small and mid-cap companies remain deprived of investor attention.
Strategic Wealth Partners, represented by President Mark Tapper, confirms the general sentiment on mid- and small-cap companies. “We'd rather own large-cap stocks—companies with good, strong balance sheets, free cash flow and low debt. Small capitalization companies have a high debt load and will not “survive” when the economy turns downward,” summed up M. Tapper.
We will calculate risk and return indicators for the stock markets of Russia and the United States in the context of the largest issuers and 2nd tier companies and show that the trends when “large ones become even larger” and smaller “players” lag behind them are only intensifying.
The markets for blue chip stocks and mid- and small-cap companies in Russia and the United States were selected for analysis.
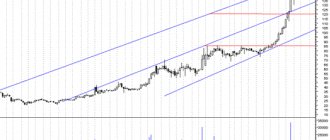
In Russia, such companies are represented by the Moscow Exchange indices (Figure 1) of “blue chips with full return” and “mid and small capitalization with full return” (2nd tier).
In the USA, the S&P 500 TR (total return) and the Russel 2000 TR small-cap index were selected (Figure 2).
These indices take into account not only the dynamics of the securities included in them, but also dividend income on shares, which is why they are called “total return”. Accounting for dividends allows us to demonstrate with even greater force the process of divergence between developed and developing companies.
To identify trends in the assessed indicators, 3 time periods were analyzed: 5 years (long-term dynamics), 3 years (medium-term) and 1 year (short-term).
The characteristics of risk indicators were described in detail by us in a study on the risks of global stock markets .
In general, for the purposes of the current study, index sensitivity (β), relationship strength (R), volatility (σ) and relative risk-return ratios (σ/I) of stock markets are used.
In Russia
Table 1 presents the results of calculations for Russian indices.
Over the past 5 years, we have observed a decrease in the sensitivity (beta coefficient) of second-tier shares to trends inherent in the shares of the largest Russian companies.
If until the end of 2022 it was possible to observe an accelerated growth in stock prices of mid- and small-cap companies, then from the beginning of 2018 the yield spread has narrowed, and the correlation has reached its maximum values (0.96). Interest in blue chips remains at the same high level, and the second tier no longer shows the outperforming dynamics characteristic of this sector.
Capital flows primarily go to liquid chips, and mid- and small-cap companies grow only on a residual basis. There is no frontal entry into second-tier shares; only individual corporate stories move the quotes of a particular company.
In terms of the risk-return ratio, the second-tier index has become comparable to the risk parameters of investments in shares of the largest Russian issuers. The returns from investing in blue chips are multiples of the returns from investing in mid- and small-cap stocks.
IN THE USA
Table 2 presents the results of calculations for American indices.
In the American stock market, the trend of divergence between large-cap and small-cap indices has not been so pronounced for a long time. The reason for this was the high liquidity of the US financial market, when capital was evenly distributed among various groups of assets in proportion to their inherent risk.
However, a feature of the last year has been the outpacing growth of the S&P 500 index over the dynamics of the Russell 2000. We see that the relationship coefficient (correlation) decreases from maximum values close to 1 to 0.72 in 2022. Unidirectionality is still stable, but the strength of the relationship is decreasing .
The return on investment in shares of mid-sized and small companies lags significantly behind the rate of return on capital shown by American blue chips.
Based on the risk-return indicator, we can conclude that there has been a serious decline in interest in the second tier.
conclusions
1. There is a clear trend towards a decrease in the return on investment in second-tier shares. This feature manifests itself both in developed markets (DM), which includes the United States, and in developing markets (EM), including the Russian stock market. Although the nature of such changes is different, it can be stated that the demand for mid- and small-cap stocks has decreased.
2. The risk of investing in Russian small-cap companies is lower than the risk of large-cap companies, which leads to the undervaluation of the “mid- and small-cap” index on the risk-return scale.
3. For developed markets, risk parameters differ insignificantly. Against the backdrop of a global increase in the risk of developed stock markets and a decrease in the dependence of developing countries on global trends, the return on investment in small capitalization companies in the United States carries increased investment risks. Purchasing demand for this segment of the American securities market is not sufficient.
Thus, all other things being equal, the risks of investing in mid- and small-cap stocks exceed the rate of return on capital expected by market participants. This trend cannot continue for too long; over time, investors will turn their attention to second-tier shares. The cyclical nature of economic development will, over time, provide such companies with an increase in the investment attractiveness of their shares.
BCS Broker
