Content
- Bullish Japanese Candlestick Patterns
- Abandoned baby - bull model (abandoned baby)
- Morning doji star
- Three inside up
- Three outside up
- Three white soldiers
- Breakaway candle
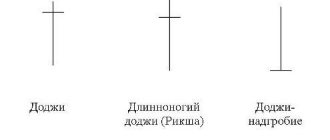
- Doji star
- Dragonfly doji
- Engulfing
- Three stars in the south
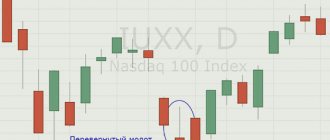
- Hammer
- Ladder bottom
- Morning star
- Piercing line
- Three stars
- Belt hold
- Gravestone doji
- Inverted hammer
- Tweezers bottom
- Abandoned baby – bear model (abandoned baby)
- Dark cloud cover
- Evening doji star
- Evening star
- Three inside down
- Three outside down
- Advance block
- Breakaway candlestick
- Deliberation
- Downside tasuki gap
- Dragonfly doji
- Engulfing
- Meeting lines
- Three stars
- Gravestone doji
- hanging man
- Belt hold
- Harami
- Shooting star
- Harami cross
- Tweezers top
HAMMER and HANGING MAN
- The color of the candle body does not matter. It all depends on what phase of the market they arise in: a hammer at the bottom, a hanging man at the top ;
- The body is very small and is at the upper end of the price range;
- The main feature: the lower shadow is twice or more longer than the body;
- The candle has no upper shadow or is very short.
The signal is strengthened if the next candle opens with a price gap from the hammer/hanging close towards the future trend.
Bullish Japanese Candlestick Patterns
By bullish Japanese candlestick patterns we mean those formations that will lead to further price growth. Very often you will encounter reversal patterns, and they will work best at support and resistance levels. If there are no such levels, and the model has formed “in the field,” then it is better to refuse to use the formation.
Abandoned baby - bull model (abandoned baby)
Abandoned Baby - a pattern of three Japanese candles. The first candle indicates the continuation of the trend, the second candle is formed in the form of a doji candle (uncertainty), the third candle is bullish. Moreover, the last candle absorbs the first two, thereby confirming an upward reversal. The trade should be opened after the third (bullish) candle closes.
Morning doji star
The Morning Star Doji is also a Japanese candlestick pattern consisting of three bars. The first candle indicates a strong trend, the second candle is a doji (star) candle, the third candle is a reversal candle, but it is smaller than the first bearish candle. To confirm a reversal, you can draw a line for the maximum of the first candle and, when it breaks through, open a trade for an increase.
Three inside up
Three inside up is a reversal pattern of Japanese candlesticks. The essence of the pattern is that the 2nd and 3rd candles absorb the first bearish candle. Entry to go up immediately after the close of the third candle of the pattern.
Three outside up
Three outside up – a model similar to the “absorption” model. The pattern starts with a bearish candle, which is immediately engulfed by a bullish candle (outside bar). It all ends with confirmation in the form of another bullish candle. Enter a trade immediately after the pattern is formed.
Three white soldiers
Three white soldiers are three rising candles, forming one after another.
This Japanese pattern is a trend continuation pattern, so it can form without support and resistance levels. The main thing is that the candles are approximately the same size and do not have large shadows on top. Enter the market immediately after the close of the third candle of the “Three White Soldiers” pattern. If the pattern formed on a reversal, then you should also expect a strong upward price movement - the model indicates a serious advantage of the bulls, so the price will move up.
Breakaway candle
Breakout candle – a pattern of 5 candles. The first four candles are downward. Closer to the fourth candle, the trend begins to slow down (the bears have hit a strong support level). The fifth candle is bullish and large-bodied. It absorbs the last three candles and closes at or above the middle of the first candle. Entry to go up immediately after the closing of the last candle of the pattern.
Doji star
A Doji Star is a Doji candle formed after a downtrend.
In fact, you should be very careful with this Japanese candlestick pattern. A Doji is not necessarily a reversal candle! It can also indicate the equality of strength between bulls and bears (uncertainty candle), which means that the price, after a short break, can continue its trend movement. For a pattern to be a reversal, it must form at a strong support level! It would also be a good idea to wait for confirmation of the reversal, and only then enter into a rise.
Dragonfly doji
Dragonfly Doji can form both at the very bottom of a trend and during a price correction in trend movements. Confirmation is the presence of a support level. The model itself suggests that the bulls are very strong, which means the price will move up. Enter the trade immediately after the formation of the “dragonfly”.
Engulfing
Engulfing or bullish engulfing is a candlestick pattern in which the left bearish candle is completely contained within the boundaries of the right bullish candle. The pattern is interesting to consider at support levels, and can form not only at reversals, but also during trend price movements. Entry after the formation of an engulfing bullish candle.
Three stars in the south
Three southern stars are three bearish candles, one after the other. The first candle is the largest, the second is smaller than the first, and the third candle is the smallest. The model indicates that sellers have exhausted their strength and they no longer have the opportunity to lower the price. It's time to go up.
Hammer
A hammer is a type of pin bar. A small bear body and a long shadow (twice as long as the body). The candle signals that during the formation, the bears gave way to the bulls - if there was a little more time, “Pinocchio” would have formed. The hammer should be looked for at strong support levels. You can enter either immediately or after confirmation in the form of the next bullish candle.
Ladder bottom
A stepped bottom is a candlestick pattern consisting of five candles. The first three candles indicate a falling price, the fourth candle is a downward candle with a long shadow on top and a small body, and the fifth candle is a reversal candle (it should be larger than the previous one and, preferably, close higher than the shadow of the previous candle).
Morning star
Morning star is almost the same as "morning star doji". Only in this case, instead of a doji, we will observe a small bearish candle, which may be far from the low of the previous candle. It is advisable to confirm the reversal with the support level or the next candle (it should be bullish).
Piercing line
Piercing candle – the pattern consists of two candles. The first candle is downward and the second candle is bullish. The essence of the model is for the second candle to close above the middle of the first candle. The model may not work itself out right away, so you should wait for a candle that closes above the high of the first candle of the model and confirms the entry for a rise.
Three stars
Three stars are three doji candles with small shadows that formed at the very bottom of a downtrend. All candles should be at the same level - they indicate the presence of a strong support level that the price cannot overcome. You should enter if a bullish candle forms after the third star.
Belt hold
Belt grab – reversal candlestick pattern. The first candle of the pattern is a full-bodied downward candle, the second candle is a doji candle or a small red candle, the third candle is a large bullish candle that closes above the high of the first candle and has no shadows (or has but very small shadows). A strong bullish signal is entering a trade immediately after the formation of the last (third) candle.
Gravestone doji
A tombstone doji is a formation that forms at the ends of a bearish trend or during pullbacks. The main candle in this formation is a doji with a shadow only on top. There should be a downward candle to the left of the doji, and an upward candle to the right. Entry for a rise after an ascending (confirming) candle.
Inverted hammer
Reverse hammer is a reversal pattern consisting of three candles. The first candle indicates a falling price, the second candle is an inverted hammer (a candle with a small body and a long shadow at the top, no shadow at the bottom), the third candle is a reversal (rising) candle. It is better to filter this pattern with support levels or Fibonacci levels. Entry after a rising candle.
Tweezers bottom
The base of the tweezers is a model of two Japanese candles, similar to a reverse hammer. The first candle is downward, and the second candle has a body equal to the shadow above. It is important that the second candle is bullish and not bearish. It would be a good idea to wait for confirmation of the reversal - the breaking of the high of the first (bearish) candle - after which you can open a trade up.
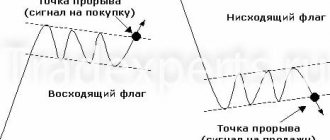
Candlestick patterns in trading and technical analysis
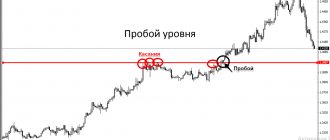
Candlestick formations show the sentiment of market participants. They are used as a complement to various strategies based on technical analysis. In technical analysis figures, graphic structures are often formed at the boundaries:
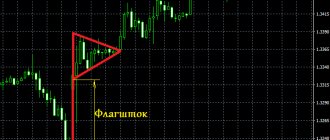
- Triangle figure. When you touch the trend lines in the image, all the basic reversal structures are visible.
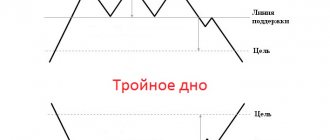
- Head and shoulders pattern on the 15 minute timeframe. The example indicates the presence of candlestick combinations in all three peaks.
The combination of these two systems contributes to accurate entry into a transaction, which means receiving additional profit. However, few trading systems use candlestick patterns as a basis, as they can give unreliable signals.
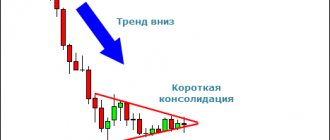
Bearish candlestick patterns
Bearish Japanese candlestick patterns are patterns, after the formation of which, the price falls. They should also be filtered by resistance levels or Fibonacci retracement levels, and you can also use indicators that predict price reversals.
Abandoned baby – bear model (abandoned baby)
The abandoned baby (bearish pattern) is a complete mirror image of the bullish pattern. The first candle is bullish, the second candle is a doji with small shadows, the third candle is a reversal (bearish). The pattern is formed at strong resistance levels. Entry after the formation of the third candle.
Dark cloud cover
A dark curtain (in Price Action - bearish CPR) is a candlestick pattern in which the second candle breaks the high of the first candle, but closes well below its opening level. The candle indicates the strength of the bears and the continuation (or beginning) of a downward trend. Login immediately after the model is formed.
Evening doji star
Evening Doji Star is a candlestick pattern that forms only at the tops of trending movements. The price moves up, after which it encounters a strong resistance level, from which a reversal occurs. Enter down immediately after the formation of a pattern of three candles.
Evening star
The evening star is exactly the same pattern as the “evening star-doji”, with one difference - instead of a doji, there is a small candle with a shadow on top (or just a small candle). Formed at the tops of upward trends.
Three inside down
Three inside down – a reversal candlestick pattern, consisting of an inside bar and breaking through the boundaries of the mother candle against the current trend (breakdown downwards). Enter a bearish trade immediately after the formation of the third (confirming) candle.
Three outside down
Three outside down is a variant of a reversal candlestick pattern with engulfing. The second candle engulfs the first bullish candle, and the third candle only confirms the price reversal. The model is quite strong and is formed at the tops of trend impulses. Entry immediately after the confirmation candle closes.
Advance block
The repulsed offensive is three ascending candles, the last of which has a long shadow at the top. The fourth candle should be a reversal candle. It’s not bad at all if it forms a bearish CPR (breaks the high of the previous candle and closes below the opening price – as in the example above). Entry immediately after the formed reversal candle.
Breakaway candlestick
A breakout candle is a formation of five candles. The first four candles are moving upward, the fifth candle is bearish. It should absorb the last three candles - a signal to open a downward trade.
Deliberation
Reflection – reversal pattern or trend continuation candlestick pattern. A distinctive feature of the formation is that the second candle, most of its body, is located within the first candle, and the third candle is a doji candle or a candle with a small body. The fourth candle is a reversal candle - entry down after its formation.
Downside tasuki gap
The lower tasuki gap is a candlestick pattern of three candles. The first and second candles are downward, the third candle is upward. The second candle is formed with a gap (the gap between the candles), the third candle begins to form approximately from the middle of the second candle. Enter a bearish position after the formation of the third candle.
Dragonfly doji
Dragonfly Doji is a reversal pattern with a dragonfly Doji (a Doji candle whose shadow is directed against the uptrend). Before opening a trade, be sure to wait for the reversal candle!
Engulfing
Absorption is a candlestick pattern (in this case, bearish), in which the first candle is completely contained within the second candle (the second candle formed above the high of the first and closed below the low of the first candle). Enter immediately after the formation of the pattern - expect a strong downward price movement.
Meeting lines
Colliding candles are an interesting candlestick pattern in which the first upward candle collides with a second downward candle. It is interesting that the second candle begins its formation significantly higher than the high of the first candle, and the closing of the second candle very often occurs at the high of the first candle. Enter immediately after the formation of the second candle.
Three stars
Three stars are three dojis formed at the top of a trend and at the same horizontal level. A signal for a further price decrease, although first it is better to wait for a confirming candle - a candle with a downward movement, which should form immediately after the third doji candle.
Gravestone doji
A Tombstone Doji is a pin bar formed at a strong resistance level after a strong upward move. The pin bar should have no body and no shadow below (or a very small shadow). The longer the shadow above, the stronger the reversal pattern. You can enter a bear market immediately after the pin bar appears, or after a confirmation candle.
hanging man
A hanging man is a small candlestick with a long shadow at the bottom at the top of a trend. The color of the candle does not matter - only the shape matters. After the hanging man there should be a candle confirming the reversal - entry into a decline only after it.
Belt hold
Belt grab is a candlestick pattern where one downward candle engulfs three previous upward candles. It is formed both at the tops of trend movements and during price corrections. Entry immediately after the engulfing candle.
Harami
Harami is a pattern where the first second candle closes approximately in the middle of the first candle. At the same time, their maximums are the same. This formation is worth considering. Like a reversal, but it is better to wait for confirmation in the form of breaking the low of the first candle.
Shooting star
A shooting star is a pin bar that formed at the top of a trend or a local maximum. The pattern must be confirmed by the resistance level at which the pin bar was formed. The color of the candle does not matter, the main thing is that the body of the candle is three times (or more) smaller than the shadow above. Enter a trade immediately after the formation of a pin bar or after a confirmation candle.
Harami cross
A harami cross is a pattern consisting of a full-bodied candle followed by doji candles (uncertainty candles). The model is formed at local highs, but to enter you should wait for confirmation of the reversal.
Tweezers top
The top of the tweezers is a formation of one full-bodied rising candle and a candle with a small bearish body and a long shadow below. This pattern is considered a reversal pattern, but it is better to wait until the low of the first candle is broken and only then open a downward trade.
Forex candlestick indicator: illusions or benefits?
A separate class of Forex candlestick indicators that recognize candlestick patterns is widely advertised on the Internet. As a result of the analysis, they display the name of the pattern and even give trading recommendations in the form of arrows of the corresponding color and direction. An example of such a tool is given below - the Pattern Options indicator, which displays all (embedded in) popular combinations of Japanese candlesticks directly on the price chart. As a rule, the appearance of a pattern is accompanied by a sound signal and duplicated by a text window.
Such indicators can only be used on timeframes from H4 and higher, but, as a rule, they cannot be fine-tuned. The usefulness of such tools is immediately questionable: many pattern names, sometimes mutually exclusive, appear on almost every candle and it is almost impossible to assess the reliability of each. Moreover, such Forex candlestick models do not show individual candles included in a specific pattern, and the evaluation mechanism is very dependent on the algorithm embedded in the indicator. With some experience, even a beginner can consider the main candlestick patterns, and at the same time filter out insignificant signals from stronger ones.
Japanese candlestick patterns: summary
Candlestick patterns are not a 100% trading strategy.
Moreover, they must be used wisely - filtered by support and resistance levels, oscillators, Fibonacci levels, trend lines, etc. If you take and open a blank price chart and start finding Japanese candlestick patterns on it, the result may be will be positive, but far from the best! There are many models - you should study them gradually. To begin, select 3-4 clear candlestick patterns and try to find them on the emerging charts and open trades on them. Once you are sure that these models are deposited in your memory, begin to study new formations and their practical use.
- Previous lesson: Japanese candlesticks for beginners and professionals: graphical analysis of financial markets using Japanese candlesticks
- Next lesson: Lines, levels and zones of support and resistance (support & resistance) in trading: support and resistance levels in binary options
Types of charts in trading
There are many variations in displaying quotes in trading. However, there are three main types of MT4 charts:
- Candlestick.
- Bars is an American stock exchange analysis tool. It consists of vertical lines, which are considered an analogue of candles on a certain timeframe. Their meaning is identical, since there is also an opening and closing price, which is displayed as dashes instead of the “body” of the Japanese chart. Western traders most often use bars. Analysis of candlestick displays is no different from analysis of bars.
- Line graph in trading it is a line of change in quotes. It is impossible to see changes in the maximum and minimum points of an asset's movement in real time. A line chart shows a display of the close value of a trading instrument. This is currently the least popular type of price analysis, but many people consider it. The advantage of a line chart is the ease of identifying reversal formations. The main disadvantage is that you cannot see the opening and closing times of the asset price. This means that many significant events will not be visible. Often, a line chart is used to analyze strong levels and support lines.
Due to its visual and practical convenience, the candlestick chart is the most popular in trading.
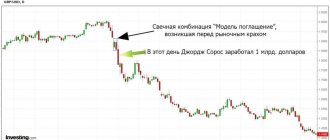
Absorption bullish and bearish (ENGULFING PATTERN bullish and bearish)
- Formed by two candles in a row;
- The main idea: the second candle “absorbs” the body of the first candle with its body. Shadows do not apply to this condition;
- The bodies are opposite in color: black-white or white-black;
- Bullish engulfing occurs at the bottom of a trend, and bearish engulfing occurs at the top.
Signal Gain:
- If the first candle of the pattern has a very small body (doji), and the second one has a very large body;
- If an engulfing pattern appears after a prolonged or very rapid trend;
- If the second candle of the pattern corresponds to a large trading volume;
- If the second body absorbs several previous bodies.