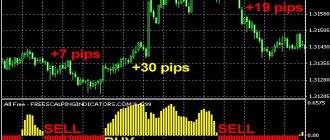
Working with volumes is important, although many traders underestimate this, preferring to do without them. Horizontal volumes give a slightly different idea of what is happening in the market compared to vertical volumes. In MT4 it is impossible to obtain such information using standard means, but there are indicators that allow you to estimate the traded volume at each level. We’ll talk about such tools today.
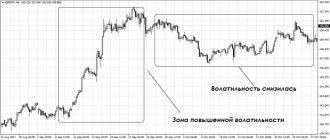
When working with regular volumes (vertical), the trader receives information for only one bar. It doesn’t matter if we are working with tick or real volumes, we only have data for the entire bar, i.e. we don’t know what happened inside this candle, how traders behaved at different price levels.
Vertical volume information is important, but it is too general. For intraday traders, especially those who engage in scalping and generally work on small time frames, horizontal volumes are critically important.
Thanks to them, it is possible to understand which price levels were critically important for traders. The simplest example is to look at yesterday’s profile and notice at what level traders’ activity was maximum. Over the next day, this level can be considered a kind of watershed; while the price is below it, we consider only selling; in case of a breakdown from the bottom up, we look for an opportunity to open a long position.
For MT4 there are very few freely available indicators that allow you to work with horizontal volumes, so in the review we will also touch on the market profile. Externally, market profile and horizontal volumes are similar, but mean slightly different things:
• horizontal volume—the activity of trading participants at each price level is given;
• market profile—for each price, the time that the price spent at this level is displayed. Displayed in the form of letters, each letter corresponds to a certain time that the price spent at a particular level.
As for where exactly you can look at the levels and market profile, there are several options:
• you can view your profile in NinjaTrader, Thinkorswim;
• the same data is also available in the SB_Pro terminal, as well as on the website sb-professional.com, however, they are published there with a 20-minute delay, so this source is not suitable for trading on small time frames;
• previously a set of indicators from ClusterDelta was also freely available, but now you can’t use them for free. You can download them from the official website and even install them in your MT4 terminal. But upon startup, a message will appear stating that they are not activated, and to activate you need to register on ClusterDelta and top up your account. Moreover, these indicators are read from the ClusterDelta server and transmitted to the trading terminal, so there are no broken versions of indicators.
Among the good all-in-one class indicators, we would like to note the offer from TradingView. If you have an account on the service, then you can use the Volume Profile indicator.
It can display all the same data as the indicators described below, but it does it online, that is, you can work from any PC. When working with stocks, data is displayed on the number of contracts, so it is even more valuable than conventional indicators for MT4.
The only inconvenient thing is that this function is available only to registered clients, and using the service is not free. You can try the demo version for 30 days, the functionality is the same, but then you will still have to pay at least $9 per month. You can try to register a new demo account every month, but during registration you also need to enter your bank card details, so this method does not solve the problem either.
WK2 Sensors indicator
The indicator is simple and convenient; it shows trading by levels over a certain period in history. There is no way to view data for individual days/candles.
There are not many settings, you can change:
• Shift — shift of the indicator scale from the current price;
• Color—volume histogram color;
• P_Color, _S_Color, _R_Color — colors of the Pivot level, as well as support and resistance levels.
Among the features, we note that this indicator also builds Pivot levels on the chart. Moreover, the Pivot here is multi-timeframe; if you work, for example, with a timeframe up to H4 inclusive, then the data is taken from the daily chart. If the trader switches to the D1 timeframe, then the levels will be built according to weekly charts, etc. Convenient, but not particularly useful, volumes are usually used for a general assessment of the situation on the market.
Forex Insider Advisor
Forex Insider is a metatrader application that allows you to see the trading positions of other market participants. It allows you to determine the extreme points of oversold and overbought. Forex Insider is a free advisor available to everyone. It shows the trader in the MetaTrader terminal open orders of market participants. This indicator reflects the mood of market participants. By studying it, you can be able to judge the expectations of other traders. Is it possible to trade with this instrument without loss?
Advisor capabilities
For quite some time now, there have been services on the network that provide the ability to see the percentage of open long-short orders. However, the practical use of this information was limited by the fact that it was not displayed on the MetaTrader screen. That is, the trader needed to be on the indicator page and periodically update it manually. With the advent of the Forex Insider advisor, an almost break-even indicator for Forex and BO, information about sentiment is quickly reflected on the MetaTrader screen.
The advisor uses the MyFXbook API to transfer data. Information about 76 instruments is displayed in real time. If necessary, the average buy and sell levels can be displayed on the chart.
You can also see the real position volumes of 100,000 clients of the MyFXbook.com portal, which makes it possible to apply elements of volumetric analysis in your strategies. An additional advantage of the advisor is that the information does not come from a broker, but from an independent provider that broadcasts data on traders from all over the world, making a snapshot of the market as a whole.
Horizontal volume indicator MR
Unlike the previous one, this indicator can be used to study horizontal volumes over a certain time period. The Range Period parameter in the settings is responsible for this; you need to set the required timeframe in minutes. The default value is 1440, i.e. The indicator shows data per day.
The indicator highlights maximum volumes with a line. Since work with horizontal volumes is carried out mainly on the breakdown of the zone of maximum volumes or a rebound from it, this simplifies the work a little.
Information is displayed only for the last 2 days. The indicator is suitable for those who use volumes as an additional tool. It allows you to determine the position of the POC (Point of Control), and nothing more is needed.
AO indicator - disadvantages.
Against the background of the new distinctive features of the AO indicator and the preservation of the capabilities of the previous MACD oscillator, in particular the search for divergences/convergences of fading trends, the Bill Williams AO indicator has a number of disadvantages that are inherent in all oscillators that include a histogram.
And the main disadvantage is the hiding of half of the information coming from the indicator, and, accordingly, from the price itself, since any indicator is derived from the price itself. Those. using the Bill Williams AO indicator or any other indicator that has a histogram, we LOSE 50% of the information that is important for a trader, both for assessing the situation and for making trading decisions.
Let's consider this fact in more detail.
In describing The Fifth Dimension of the Market, Williams said: “Look only at the highs if you are looking for a buy signal. Pay attention only to the lows if you are looking for a moment to sell.”
This means that when looking for purchases on a downward pullback, a trader should ONLY pay attention to the TOPES. And vice versa: when selling - AT THE LOW.
Fig.6. The fifth dimension of the market by Bill Williams, look at the highs on purchases.
The figure shows that when searching for purchases, 3 maximums/tops were formed. The first peak stands out perfectly on the indicator histogram and is clearly distinguishable. Unlike top No. 2 and top No. 3, which are HIDING in the “histogram body” of the AO indicator.
There is a simple explanation for this: The processing of graphic information by the human brain has a small flaw, a drawback... Which is the reason for such a property of perception as the “ILLUSION OF VOLUME”. When the human brain can see either ONE graphic information or ANOTHER.
Fig.7. Illusion of volume: are the plates in the picture upside down or not upside down?
If you look at the picture above, all the plates are upside down.
However, as it will later seem, some plates stand normally and are not turned upside down. If you find plates that are not upside down, then all the plates in the picture will turn over and take the correct position.
For some this exercise takes a matter of seconds, for others minutes.
But the truth is not how the plates are arranged in the picture! And the fact is that the brain, processing graphic information, CANNOT show you everything!!! And you will see either upside down plates or correctly standing ones.
A slightly simpler task:
Fig.8. Volume illusion - cubes: how many cubes do you see? 6 – pyramid? or 7 crystal?
And an even simpler problem:
Fig.9. Volume illusion - staircase: do you see the right staircase or the upside down one?
In all examples we can see only one graphic image. This is how the brain works...
But let's return to Bill Williams' wonderful oscillator:
Fig. 10. Hiding graphical information with Bill Williams' AO histogram
Following Williams' rule, a trader must pay attention to graphical elements that are obviously hidden by the histogram of the AO indicator itself. Because they are hidden in the histogram body. And the protruding tubercles of the top in the left part of the picture and the bottoms in the right part of the picture are not needed by the Trader or are needed.. “as much as possible.”
Conclusion: The AO histogram of Bill Williams, his wonderful AO oscillator, hides 50% of the graphical information. Moreover, the AO histogram hides IMPORTANT graphical information from the trader and shows NOT necessary graphical information. Due to the peculiarities of perception and processing of graphical information, the trader has to purposefully switch to the perception of hidden information, which requires additional attention resources and in some cases can prevent the trader from correctly perceiving the information coming from the price.
SRW indicator
This tool is exactly like the previous one, but the differences are more of a cosmetic nature.
It can be seen that, as in the MP indicator, the volume is displayed in the form of a histogram; it is calculated in exactly the same way (the histograms coincide 100%). TPO can also be configured to display a histogram of horizontal volume at different time intervals.
A couple of new settings have been added:
• PriceStep—price step; this parameter refers to the height of the rectangle. If you set its value to, for example, 20 points, then the rectangle will have a height of 20 points; with a value of 0, its width is standard;
• HGStyle – histogram style, specified by numbers from 1 to 3. Instead of rectangles, data can be displayed as lines; there is a style with rectangles filled with color.
But the base for the MR and TRO indicators is the same, so there is no difference which one to use. There are 4-5 more types of TPO indicators, the only difference is where exactly the volume histogram is located and in additional settings.
Indicators for displaying vertical volume
All volume indicators of this group can be divided into 2 types:
- Teak . They display data on traders’ activity rather than information on traded volume. When calculating the value of each histogram column, the number of price changes (ticks) over a certain time period is taken into account.
- Real . Data is taken from stock exchanges for futures corresponding to a specific currency pair. There are few such indicators.
First, we will analyze several indicators that work with tick volumes, and later we will figure out how to get real data on volumes in MT4.
Volume indicator
Volumes is included in the set of pre-installed indicators for MT4 and MT5. These are tick volumes, so each column shows how many times the price changed when the corresponding candle was formed.
Volumes does not have settings that directly affect its operation. The logic of the indicator comes down to counting ticks on each candle; there is nothing to change or customize here.
The tool is suitable for all timeframes. When analyzing, the specific value of Volumes does not matter; what is important is the dynamics of volumes and the position of the column relative to the average value. Also, tick volume readings correlate with what is happening on the chart. For example, abnormally high readings at the top of an uptrend market may indicate that bulls are closing positions.
For ease of use, it is advisable to add a moving average to the indicator field, this will make it more convenient to isolate high Volumes values. When adding a moving average to the indicator, in the “Apply to” field you need to select not the price, but the “First indicator's data” option.
Better Volume indicator
Technically, this is a complete copy of the Volumes indicator; the histogram columns are 100% identical. The difference is that Better Volumes already has a built-in moving average, and the columns are colored in several colors depending on the market situation. This makes market analysis easier.
Decoding the colors of the histogram columns:
- Blue bars correspond to the standard market situation. In terms of volumes, nothing significant is happening.
- Yellow color – insignificant volume.
- Green – large volumes.
- Red columns appear only when there is clear dominance of buyers.
- White color corresponds to the dominance of sellers.
As in the case of the standard Volumes indicator, you need to take into account not only what is happening on the histogram, but also what is happening on the chart. In terms of ease of use, Better Volume is superior to standard Volumes.
Delta Volume indicator
The term “delta” appeared in the early 2000s, when footprints began to be used. In the stock market, this refers to the difference between the volume to buy and sell. Delta can be calculated either at each price or for a certain time period.
In the case of Forex, delta calculation comes down to the difference between bullish and bearish ticks. That is, each column of the Delta Volume histogram is calculated as the difference between the number of upward and downward price changes.
This can be used, for example, to assess the truth of the breakdown of horizontal levels. If, when breaking through resistance, the delta indicates dominance of buyers, then there is a high probability that the breakout was true.
This volume indicator for MT4 does not need to be configured and optimized for yourself.
FFX Volumes
Standard volume indicator, shows tick data. Its highlight is that the basement displays information on several timeframes at once. The required time intervals can be configured.
This modification of the standard Volumes will be useful for those who work on multiple timeframes. If you work on H1 and higher, then FXF Volumes is not particularly useful; on such timeframes there is no need to save a couple of minutes.
Normalized Volume Oscillator
Normalized volume differs from tick volume in the data format. If the standard Volumes indicator shows data by the number of ticks, then the Normalized Volume Oscillator displays data as a percentage of the average value. A value of, for example, 200 means that the tick volume on the current candle is twice the average value.
The color of the histogram column is also important:
- Blue bars correspond to candles where the volume was less than average.
- Dark green color corresponds to a moderate excess of volume compared to average.
- Light green bars indicate that tick volume is 38.2% or more above average.
- Yellow color (blue in the figure for better readability) corresponds to 61.8% or more exceeding the average volume.
- White bars (red in the image below) indicate 100+% volume above average.
I also recommend reading:
Bollinger Band indicator - description, settings, application
In technical analysis, there are many indicators that have a similar structure, but at the same time differ significantly. Some of them look […]
The method of using the volume indicator differs from the standard Volumes. The excess of the volumes of the average value and the configuration of the candles at this moment come to the fore.
Laguerre Volume indicator
One of the non-standard approaches to working with volumes. This is a classic oscillator, that is, its values fluctuate within a certain range. The key feature is the application of the Laguerre transform to tick volume data.
The indicator is quite sensitive and reacts sharply even to small chart movements. In your work, you can take into account the position of the oscillator line. When it is in the oversold zone, the probability of a downward movement increases; if Laguerre Volume is in the oversold area, then purchase transactions have priority.
Through the settings you can influence the sensitivity of the indicator. The Gamma point is responsible for this.
Volume indicator SonicR VSA Candlesticks
The indicator differs from the others in that it does not build a histogram in the basement. In fact, a trader only needs to know on which candles the volume is growing sharply and in which direction (priority for bulls or bears). SonicR VSA Candlesticks cuts off everything unnecessary and indicates only the candle where there was a surge in traders’ activity.
Specific candles are highlighted in color. Green color means that the teak volumes played a sharp role and the bulls dominated. That is, during the formation of the candle there were more upward price changes. The red color is a mirror image, this confirms the dominance of bears.
There is an analogue of this indicator with the same operating logic, but a familiar information display scheme. The histogram is built in the basement and the required columns are colored red or green.
Real exchange volumes in MetaTrader
A set of indicators from ClusterDelta provides broadcasting of exchange volumes directly to MetaTrader. There is a volume indicator for MT5 and the 4th version of the platform. In addition to vertical volumes, it is possible to obtain data on horizontal volumes.
The only problem is that the indicators don't work without a paywall. The Standard package costs $4.40 per month, which is enough to get acquainted with Cluster Delta developments.
In addition to the usual volumes, there are indicators for obtaining delta, cumulative delta, and footprints. Data on the corresponding futures contracts is transmitted to the terminal.
This is a convenient tool, but what is important in the work is not the numerical values of the volumes, but the configuration of the histogram and the sizes of the columns relative to neighboring ones. The configuration of histograms of tick and real volumes almost always coincides, so you can use both types of data in your work. You won't notice a fundamental difference.
I also recommend reading:
Trading in rubles on Forex. Features, factors influencing the USD/RUB exchange rate
Typically, the trading environment discusses the possibilities and prospects for movement in major currency pairs. It is, in general, understandable – [...]
Horizontal volume indicator VL
Another clone of previous indicators. Let us only note the ability to set the position of the histogram itself through the settings. The HGPosition parameter is responsible for this:
• 0 – on the left side of the window;
• 1 – on the right side;
• 2 — on the blue line;
• 3 - on the red line.
As in the case of previous algorithms, the indicator itself draws horizontal levels through volume peaks.
It is very convenient that the area where you need to view the trading volume by price levels can be changed simply by dragging the vertical blue and red lines. The histogram itself is rebuilt with a delay of several seconds, so take your time.
MarketProfile indicator
It stands out from the rest because of the abundance of settings, but in reality we still have the same market profile as in the previous indicators.
In the settings you can:
• set the number of days on which the indicator will show horizontal volumes. The LookBack parameter is responsible for this;
• configure the histogram view, set other timeframes with which the indicator can work. In particular, it can display horizontal volumes from a weekly chart on a daily timeframe, and from a monthly chart on a weekly timeframe;
• you can turn off the display of the histogram, highlighting the area in which the greatest volatility was observed.
In fact, the abundance of settings does not bring any benefit. This did not improve the functionality of the indicator at all.
As for his work, he, like the previous ones, builds horizontal levels through maximum volumes. Among the additional functions, arrows indicate the opening and closing prices of the day.
Compared to the other volume indicators listed, we highlight this one only because of the extensive customization possibilities.
There are several other tools with a similar name:
• market profile is an absolute copy, and the difference is only in the color of the volume histogram. This indicator can also highlight the ROS on the histogram and the zone in which the price spent the most time;
• the following market profile is interesting because the histogram is divided into several zones with different colors. Each color corresponds to the work of a specific trading session - Europe, Asia and America stand out;
• market profile trandlines—it differs from the basic version of the market profile indicator only in that in addition to the histogram on the chart, the indicator also builds trend lines. Otherwise, it is still the same market profile;
• market profile VirginpPOC is another variation of volume display, differing only in the color of the histogram.
You can find a lot of indicators under this name, but the difference between them lies only in the color of the histogram itself, as well as in the presence/absence of additional constructions. So it doesn’t make much difference which market profile to use.
The author of the AO indicator is Bill Williams.
Bill Williams : Born in 1928, into a simple American family, no one predicted a future for him in the financial market. From the stories of many biographers, it is clear that Bill Williams made his difficult journey to become a multi-billionaire and the most famous person in the financial world. And it is not known whether he would have reached such heights if not for his Aunt Emily, who taught him mathematics before school, and his friend and fellow university student, Rogers, who introduced him to stock trading and became his mentor in his first steps in trading. His wife, Helen, supported him during a difficult moment of failure in trading and sincerely believed in Bill’s success.
It should be noted separately that in Bill Williams’ system the AO indicator is not the main one and is used as part of Williams’ trading strategy, which involves:
- AO indicator;
- AC indicator;
- fractals;
- alligator.
Fig.1.
An example of a chart with installed indicators of the Bill Williams trading system. And the Bill Williams AO indicator is far from some kind of secret “grail”, the owner of which will definitely earn profit after profit, confidently increasing his deposit.
The AO indicator is just part of a set of indicators that together (and only together!) provide Bill Williams’ profitunity trading strategy , which is used by many traders for trading on the foreign exchange market, the stock market, and also for cryptocurrencies.
Installing the AO, AC indicator, as well as other indicators of Bill Williams’ trading strategy, is not difficult even for a novice trader. All Williams indicators are included in the standard set of indicators by default on all trading platforms.
Let's look at an example of installing the AO indicator on the MT4 platform. On the MT5 platform, the Williams AO indicator is installed in the same way:
Fig.2. Options for installing AO on the MT4+MT5 chart
There are 2 ways to install the indicator:
- the first way: through the menu “FILE” -> “Indicators” -> “Bill Williams” -> “Awesome Oscillator”, having previously selected the chart window on which we want to place the AO indicator.
- second way: through the navigator panel (call it with the keyboard shortcut Ctrl+T or in the “View” menu)... after calling the “navigator window”, look for the “Bill Williams” section, open it and select the desired indicator from the list.
High Bolume Bar
The simplest indicator shows only horizontal volumes and nothing else. There's not much to change in the settings. You can only set the number of candles that will be taken into account when constructing the histogram and change the colors.
It differs from the listed analogues in that the color of the histogram depends on the direction of market movement. In a rising market the color is grey, in a falling market it is dark brown. POC levels are not highlighted on the histogram.
Horizontal levels indicator KG_RDL_Pembatas
The tool is not very popular; it builds the same histogram of horizontal volumes, but stands out only in the number of settings. Moreover, it is unknown how a good half of them influence the calculation algorithm.
When all additional constructions are activated in the settings on the chart, the indicator highlights the zone in which the price was most of the time, POC, and performs a number of more constructions. There is no particular benefit from additional functions.
Examples and analysis
Since there is no normal indicator for Quick, and I don’t want to install it from the Internet from an unclear site, let’s move to the Trading View platform, which has horizontal volumes, although they are paid, in pro and higher tariffs.
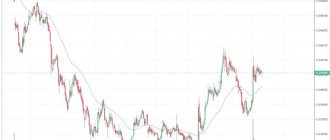
Let's look at the example of Sberbank.
Let’s say, using the daily example, we have a certain candle for September 16, and we see a vertical volume below, which shows us that on that day, trading took place for a little over 6 million contracts. And what to do with this information in its raw form is not entirely clear. Well, they passed and passed, but at what prices did they sell more? Let's start digging, switch to the watch (screenshot below).
The picture seems to be becoming a little clearer, but again, on that day we see quite volatile candles, approximately the same volumes, and in the same way there seems to be no understanding at what prices large volumes are moving. It may immediately seem that the paper was actively sold that day, does that mean the volumes will be higher?
But it’s not so, even looking at this segment of the market, many experienced traders will most likely already guess where the volume was formed. But my task today is to show how using horizontal volumes can improve trading for beginners. Let's dig further
This is what the segment looks like on M5 already, and again, experienced traders will even find the entry point into longs on the 16th, simply by vertical volumes. There is a certain chart, there are some volumes, and again, most people will most likely not understand where the volume was formed. Well, now let's take a look at this same area, but with the help of horizontal volumes
Look in the same way at the 16th, you can see that the main volumes were formed precisely at the very minimums. The volumes that were formed in the region of 327 - 328 rubles can be ignored, since the instrument simply stayed there for a long time, and accordingly, a lot of contacts passed there. But the lower range really stands out.
Based on this example, you can already make some trading ideas.
And, probably, many people still have a question: where on the regular chart did I see an accumulation of volume in advance, as well as a potential long trade?
Abstracting generally from the overall picture for Sberbank, and looking specifically at this segment, we see two large surges in volume at the very minimum. This is where the largest volumes passed, as the horizontal levels tell us in the same way.
And what will the situation with Sber look like if you look globally at the entire current sideline? As I already said, the volume there will be formed in the middle, open it and look.
The picture, to put it mildly, is not the most interesting; it is not entirely clear how to interpret it for trading. It is in such sidewalls that all the inefficiency of the horizontal volume is visible. And the signal that we found on September 16 is clearly visible both on the horizon and vertical.
But there are undoubtedly benefits, especially for beginners. It’s easy for me to talk about this already having experience, but I know that horizontal volumes really help many people at the beginning of their journey. Then, with experience, many stop using them. But it also depends on the trading strategy and the patterns you trade. We'll look at another option a little later.
Horizontal level indicator Level Sensor and Level Sensor New
These indicators are practically no different from each other. In the updated version, they just added 1 item in the settings that doesn’t really affect anything.
In the indicator parameters, you set the interval of candles at which the indicator will show volumes in the form of a histogram. Data is displayed only on the right side of the working window.
The indicator is not suitable for assessing the situation day by day, only for a certain period of time. But the basic version of Level Sensor builds a volume histogram on the left side, they have the same functionality, so just select the indicator that is more convenient.
Popular trading tools - description
1) One of the most popular is Better Volume (you can download it from the link above), which clearly displays the situation by coloring the columns in different colors. The trader can see what actions market makers are making and follow them. To carry out the analysis, compare the tick volume and the range of the current candle on the price chart, guided by the general rules for analyzing these indicators.
2) Traders often use the OBV balance volume indicator, which was created by Joseph Granville. The tool is relevant for additional confirmation of the direction of the trend at moments when the indicators are in a relatively calm state. Most often, trading data for one day at closing is taken as a basis.
3) It is worth considering the indicator of the rate of change of value - VRC, which performs calculations similar to the indicator of the rate of change of price, but takes volumes rather than cost as the source of initial data.
The instrument’s signals are quite simple and understandable, based on the assertion that before any changes in price direction, noticeable jumps in volume are first observed.
4) Klinger Oscillator – designed for short-term trading, it displays all promising movements in the value of a currency within the main trend that dominates the market and is visible on large time frames. The basis of work in this case is safe trading on pullbacks. Calculations are carried out based on the sum of the minimums, maximums of the period and the closing cost at its end. The indicator compares the values of the sums of the previous and current periods, determining accumulation or distribution.
- You can download it from the link - KVO (archived).
5) A/D (accumulation-distribution) indicator – on one chart, it connects cost and volume to provide the trader with the opportunity to continuously monitor their changes. According to the author of the tool, Williams, market volatility is directly dependent on the rate of growth of the indicator. A rise in indicator values signals an increase in bullish sentiment, while a fall signals bearish sentiment.
- The download link is at the beginning of this text!
6) Horizontal volume indicator MT4 - builds a histogram that displays the volume of concluded transactions at a particular price without reference to time. The histogram is created in the terminal window; each of its columns can be easily compared with quote values and conclusions can be drawn regarding the market reaction to a particular quote value and changes in volumes compared to the price level.
- Download - VolumesHist (archived).
And once again we attach a link to FREE training in trading using the VSA method from professional traders - Take the course ⇒
There are quite a lot of indicators for displaying volumes and there are a lot of their types, we have not yet considered the following: cluster type, candle volume and vertical, for quick, average value, from tradingview, etc. Therefore, every trader can find the one that is most suitable him and his trading strategy, providing information content and the necessary data for qualitative analysis.
Blantech Market Profile
It costs $249 in the market, it is convenient because in addition to the total volume, it also shows the trading volume by day, and also highlights the 70% zone (where the price spent the most time).
The indicator displays both the market profile and horizontal volumes; it is possible to customize literally anything. Starting from the color and type of lines used, to the way volumes are displayed on the chart and the time frames on which the volume should be shown.
The “footer” displays basic information, as well as a panel with hot keys, making it more convenient to work with the indicator settings.
There is no free version online, but if you don’t want to pay the full amount for the indicator, you can try renting it for a couple of months, the rental cost will be $25.
Volume profile mt4
In this case, you should be guided by the following rule: the smaller the thickness of the lines generated by the tool, the stronger the potential jump in the price line will be. It should be noted that this aspect should be used only in conditions of high volatility of the trading asset chosen by the trader for financial transactions. Volume profile indicator for mt4
Volume profile what it shows
Displaying such periods of market activity is done by drawing rectangular contours on the chart. When analyzing, you should use only those candles and columns that are included in the range found by the indicator, marked in red. The remaining bars should simply be ignored.
To make working with the indicator as simple and effective as possible, the user needs to optimize its parameters. Setting up the tool is extremely simple. After opening the corresponding menu, the speculator will be able to see several basic parameters:
Quantum Volume Point of Control Indicator
Another paid indicator; in the market its cost is listed at $197 for 5 activations. Among the advantages, the authors of the indicator emphasize:
• Volume Profile display—a volume histogram is displayed on the right side of the working window;
• High/Low Volume Node - designation of bulges and depressions in the volume profile. A convexity indicates that this area of price values may become resistance or support for the price, while a depression indicates an area where the price has deviated due to low volume;
• building Support/Resistance Zones - on the chart, based on extreme volume values, the indicator builds support and resistance levels;
• construction of the ROS - a key point on the chart; the price crossing the ROS may indicate a change in trend.
Despite the abundance of functions, we have, by and large, the same functionality as in most of the free indicators that we have already considered.
Indicator VWAP - Volume Weighted Average Price Indicator VWAP (Volume-Weighted Average Price) - An indicator displaying the weighted average price by volume. It is an analogue of a moving average, in which the price is averaged based on the volumes traded over a given time interval. The tool is widely used by traders working on exchange platforms for intraday and HFT (high frequency) trading, and is used for end-to-end (several periods) market analysis by major market players. The main task of VWAP is to display the activity of players at a certain point in time. In addition, using this indicator you can sometimes predict an imminent trend reversal.
Description of the VWAP indicator
A weighted average price (VWAP) is similar to a moving average in that when prices advance they are above the indicator line and when they decline they are below the indicator line. Keep in mind, however, that like a moving average, VWAP can also experience lag. Negativeness is inherent in the indicator because it is a calculation of an average using past data. That being said, VWAP is best used during intraday periods. The reason is that settlement begins when trading opens and stops when trading closes. Because of this, lag can and does occur during the intraday period. For example, if you are using a 1 minute chart, after 5 hours of trading the VWAP is calculated for 300 periods. The lag associated with this would be similar to a 300 period moving average.
At first glance, VWAP looks like a regular Moving Average. But it has several extremely important differences.
The first difference is the calculation base. In the case of VWAP calculation, the base is not only and not so much the price, but the volume traded on the exchange in price and time. This means the indicator is more responsive to changes in the market. Especially if they are not visible on a regular price chart.
The second difference is the calculation feature of the VWAP indicator. It has a beginning and an end, whereas the Moving Average, by and large, has no beginning or end. The VWAP indicator is calculated from the beginning of a specified period (for example, hour, day, week) to the end point in cumulative mode. The data is not averaged. Those. An important feature of the indicator is the choice of calculation period (timeframe). The weekly VWAP is built from Monday to Friday.
The third difference is the ability to build VWAP series. In fact, the ability to build series is a consequence of the fact that the indicator is built according to the time frame: hourly, sessional, daily, weekly.
The fourth difference is the ability to use end-to-end analysis to find the best entry point. End-to-end analysis is the analysis of quotes from the upper timeframe to the lower one and vice versa. Naturally, indicators need to be analyzed in the same way. The VWAP indicator provides the best opportunity for this.
Calculation
There are five steps to calculate VWAP:
1. Calculate the Typical Price for the period. [(High + Low + Close)/3)] 2. Multiply Typical Price x Volume 3. Create a cumulative sum of the typical price. Cumulative(Typical Price x Volume) 4. Create a cumulative total quantity. Cumulative(Volume) 5. Divide the cumulative totals.
VWAP = Cumulative(Typical Price x Volume) / Cumulative(Volume)
The formula shows that VWAP is the sum of the products of volume and price for the time period under consideration, divided by the total quantity of volume for the time period under consideration.
The summation of values demonstrates the cumulative nature of the indicator. Due to this, one of its features manifests itself - maximum sensitivity is typical for the initial candles in the selected interval; towards the end, the sensitivity drops, the delay increases and the ability to display integral market sentiment increases.
In most implementations, in addition to the main line, several additional ones are constructed, the determination of which is based on the standard deviation values (by analogy with Bollinger bands). As a rule, deviation coefficients from 1 to 3 are used. With their help, the boundaries of the price channel are determined for trend and counter-trend strategies.
Trading system using the VWAP Indicator
VWAP calculation when using a daily cycle starts with the opening price of the trading day (you can also set the calculation time for an individual trading session), and VWAP will initially be very sensitive to price changes. But as you trade longer during the day, it will become less sensitive. When you use VWAP, you should keep in mind that when the price is above the line, an uptrend is prevailing. Conversely, if the price is below VWAP, then a downtrend is prevailing.
You are probably wondering what the behavior of this indicator is when used in a sideways market. In this case, the VWAP will simply be projected in the middle of the price range. By looking at the direction of the VWAP, you can understand whether you should use a trending or reversal strategy.
Trend identification is the main benefit of using the Value Weighted Average (VWAP) indicator. The premise is very simple, but can be very useful, especially when used to confirm trading signals.
A bullish trend is characterized by price trading above VWAP.
A bearish trend is characterized by price trading below the VWAP.
A sideways market is characterized by prices trading above and below VWAP.
Thus, VWAP is a trend indicator and, at the same time, dynamic support/resistance lines. This allows you to use the tool in two types of strategies – trend and counter-trend (return).
In the first case, when the price is above VWAP, options for purchasing an asset are considered, and below - selling. The second option formulates opposite rules - in the area above the indicator line, sell signals are considered, below - for opening long positions.
The choice of strategy is determined by various factors - the direction of the price impulse, whether the market is in a certain phase, the proximity of the price to significant levels, etc. Accordingly. It is quite difficult to build a vehicle based only on the readings of one VWAP.
For professional traders, the VWAP indicator line represents the equilibrium position in the market, the average market (sometimes called fair) price.
Based on this interpretation, for large trading participants, deviation from the line is a reason to make transactions at a price better than the average.
VWAP is used by HFT traders to buy/sell at a point that would not cause a sudden movement in stock prices. This doesn't necessarily give trading signals, but it does help buy low and high sales. When used with other trading indicators, it can definitely help improve the accuracy of your trading strategy. You must understand that this is only one indicator out of a thousand, which is taken into account when placing a large volume of orders.
How do retail traders use VWAP? Retail traders want to trade momentum movements frequently. When the price crosses the VWAP line, it can be considered a signal of an uptrend. And then you can look for buying opportunities. On the contrary, you can consider sell signals if the price is below the VWAP line. When you choose this strategy, you should know that:
Strong buying pressure above VWAP indicates that price is forcing market participants to reach a new high.
Strong selling pressure below VWAP is a sign that the price is being pushed lower to reach a new low.
The chart below shows the interaction between the VWAP line and price. Often VWAP is support or resistance. This means that you can use VWAP in your strategy to determine dynamic support and resistance levels.
SUMMARY
Volume Weighted Average Price (VWAP) is an interesting indicator because, unlike many other technical analysis tools, it is best suited for intraday analysis. This is a reliable way to determine the main trend of an intraday period. When price is above VWAP, the trend is up and when it is below VWAP, the trend is down. However, there is a drawback. Even though it is used primarily on an intraday basis, there can be a lot of lag between the indicator and the price. The indicator begins to calculate when opening and stops when closing. Therefore, for a chart using a short time frame (i.e. 1 minute), there may be several hundred periods within one day. The closer to the end of the day, the greater the lag of the indicator. This is true for any indicator that calculates an average using past data.
And the most important conclusion. VWAP will show that the market is near or far from the equilibrium price within a certain period. And the further away from the equilibrium price within the period, the greater the chances of the trend ending within the period. This understanding will allow you to refuse unnecessary transactions and make necessary transactions.
Horizontal volume indicator Volume at Price
Outwardly it looks the same as standard free horizontal volume indicators. Can:
• show volume profiles for any selected time interval;
• display the volume profile for an arbitrary period of time simply by summing up the data from the current timeframe;
• You can limit the display time by date in the settings.
It is convenient that the main parameters of the advisor are set in a separate window. Here you can select the main timeframe, the location of the volume histogram, and the time interval on history at which the information should be displayed.
Whether it's worth $60 is up to the trader to decide. But in essence, the indicator is not far from standard free tools. The only additional functionality is that you can view volumes on additional timeframes.
Turning Point Detector indicator
This is more likely not a separate indicator, but a ready-made trading system, in which the market profile is used only as one of the auxiliary indicators. This TS costs $70 and marks turning points on the chart.
Able to work with several types of market profiles:
• daily - suitable for working only in the m5 - H1 timeframe range, the author recommends trading on 30-minute charts;
• weekly - optimal working timeframes m30-H4, recommended - hourly;
• monthly - you can trade on time intervals up to D1, but it is best to stick to 4-hour candles.
The indicator is a switch indicator; when using a market profile, signals are issued in the form of a price rebound from the boundaries of the 70% zone or the POC level of the previous day.
It is difficult to judge the effectiveness; there are not many reviews to talk about reliable statistics. But his example proves that horizontal volumes are not a useless statistic and not a poor analytical tool.
Horizontal volume indicator TPO Chart
These are not horizontal volumes, but a market profile indicator, and they are no different from free indicators. The author asks $50 for it.
The graph is very similar in appearance to the horizontal volume profile, but unlike it, the histogram uses letters. This designation is used to show how long the price spent at the same level.
There is absolutely nothing to pay $50 for here; standard indicators that are freely available can perform exactly the same constructions. The only thing that can be highlighted is the information window, but this is not such a significant addition.
Day trading
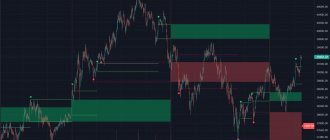
The peculiarity of scalping is that transactions are very rarely left overnight and almost never for the next week. Most often, a trader enters the market during the European or American session, and exits at the close of the session or even earlier.
Each new day starts from scratch (although benchmarks from higher timeframes may be left). Therefore, it is critical to have a guideline to prioritize sales or purchases. ROS can play its role - i.e. the level at which the maximum volume was traded for the previous day.
You need to act according to this scheme:
• extend the position of the previous day's ROS to today's day;
• observe the price behavior around it. If the graph goes down from POC, then preference should be given to sales. If the downward movement of the chart continues and the price goes beyond yesterday’s profile, i.e. forms a new one, then sales remain relevant;
• We act in the same way in the case of upward rebound from the ROS.
The rules for working with the POC level are the same as when working with regular support/resistance levels. Those. entry is made only after confirmation of a rebound or breakout.
In the example in the screenshot above, the breakdown of the POC level was confirmed only after a retest, which gave the first entry point. After the price approached this line again, it was possible to buy after the formation of a doji on the chart. This indicated the bears' weakness.
Not everything always develops as ideally as in the example given. It may be that the price the next day will continue to move in the same direction and will not approach the ROS at all. In this case, you can work when the price goes beyond the 70% zone of the previous day.
Sometimes a breakout of the 70% zone ends in a sharp movement, such as in the example. But this does not always happen, so if you decide to use this signal in your work, we recommend using it as an additional filter.
How to work with volumes
In trading there is a separate section dedicated to working with volumes, we are talking about the VSA technique. Below we will describe just a few basic techniques for using this information in trading.
I also recommend reading:
Rails pattern – principle of formation and application in trade
This design is a reversal structure and is somewhat inferior in strength to a pin bar. Like other Price Action patterns, this model […]
Application of horizontal volumes
Levels are constructed based on the maximum values of the histogram. The calculation is that the support or resistance constructed in this way will work out in the future.
The position of such levels may not coincide with the results of chart marking in accordance with the rules of graphical analysis. But if the position of the lines almost coincides, then the significance of this zone increases.
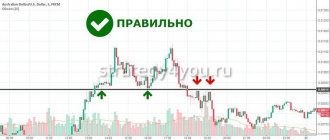
Application of vertical volumes using the example of the Prometheus strategy
The Prometheus strategy is unusual in that it only uses the Better Volume indicator. That is, the work is based on tick volumes. Prometheus is a counter-trend system; this style is associated with increased risk and is not suitable for beginners.
Rules for working in Sell:
- We need to wait for the peak of purchases. This is the moment when the chart is in the area of highs, but there is no longer any “fuel” to continue growth.
- The culmination of purchases is indicated by a large bullish candle and a red histogram column on the Better Volume indicator.
- After closing this candle, a pending Sell Stop order is placed at its maximum. If the price remains at the maximum and it is impossible to place a pending order, then you need to wait for the minimum rollback and place a Buy Stop order in the High area.
Stop loss is not used. Profit is fixed at support levels or when a counter signal is formed.
The rules for working in Buy are changing in a mirror way:
- Purchases are possible only at the bottom, at the time of the culmination of sales.
- This condition is indicated by a large bearish candle and a white bar on Better Volume.
- Entry into the market is performed with a pending Buy Limit order. The rules for maintaining a position are the same as for sales.
This strategy is rather an exception to the rule. In most cases, volume plays the role of an important filter, but not the basis of a trading system. Trading only based on the vertical volume indicator is not recommended - the risk is too great.
Accounting for higher timeframes
If you plan to work on a larger time interval, you will have to take into account the position of the POC for at least several previous days. You can use 2 horizontal volume indicators - one will show the trading volume over the previous few days, and the second will show separately by day.
The example shows that the ROS from the total traded volume over several days are used as an addition to the ROS from the daily histograms. This is similar to how technical analysis traders use support/resistance levels from higher time frames when working on smaller time frames. The principle works the same, they act as a guide.
You can combine vertical and horizontal volumes. If, for example, the price breaks through the ROS, then it is the vertical volumes that will help to understand whether the breakout was true or not.