Earnings Per Share (EPS) – reflects the amount of net profit per one ordinary share. The financial indicator EPS, calculated taking into account the shares actually traded on the stock exchange, is called the basic one - Basic EPS. It is this earnings per share that is used to calculate the P/E multiple. But taking into account the fact that the number of shares in circulation may change, for a more accurate assessment, it is better to use the weighted average number of shares for the calculation period. Therefore, it should be remembered that EPS is an absolute indicator, unlike the P/E ratio.
It is more appropriate to use EPS calculations over several years. Then it becomes clear where the company is moving, how valuable one issued security is, taking into account the volume of the issue and the quantitative indicator of profit.
EPS increases due to an increase in the company's net income or due to a decrease in the number of shares outstanding (the so-called share buyback). Thus, the higher the earnings per share, the higher the stock price.
For an investor, the absence of changes in the indicator may be a signal of refusal to place funds and choose a competing company for investment, if these enterprises are busy increasing profits. The lack of growth in profit per share indicates a lack of growth in the return on investment.
Diluted earnings per share (Diluted EPS)
Diluted EPS is a measure of diluted earnings per share. It is calculated when a company dilutes its share capital, that is, when it issues new shares, converts bonds into shares, exercises options, or pays preference dividends with new shares.
If a company has a complex capital structure (has potential common shares of convertible securities, options, warrants), then, in addition to Basic EPS , the company discloses Diluted EPS .
Under US GAAP, the calculation of diluted earnings per share includes all potential shares that may result from the exercise of convertible financial instruments, such as options and warrants.
Useful information and no spam
Join us and get new ideas on the stock market!
Calculation example
Let's look at the consolidated financial statements of Evraz plc as an example. As you know, reporting of this kind for public companies should be freely available. It can be easily found on the company’s official website by typing into a search engine something like: “Evraz consolidated statements for such and such a year.”
Here is the first excerpt from the report in which we can find information about net profit:
Fragment of Evraz consolidated financial statements for 2022
As you can see, the company's net income for 2022 was $759 million.
Next, we scroll through the report and find the following excerpt, which contains information about the number of common shares of the company outstanding:
Excerpt from the same report on the number of common shares outstanding
Here we see two numbers. The first of them shows the weighted average number of shares outstanding during the reporting period: 1427585897 pcs. And the second is the number of the same shares, but adjusted for the dilution effect (due to options): 1454560330 pieces.
Taking into account the data obtained, we can calculate the EPS ratio for Evraz for 2022:
EPS = 759000000/1427585897 = $0.53 per share
And also Diluted EPS (diluted earnings per share):
Diluted EPS = 759000000/1454560330 = $0.52 per share
It should be said that, as a rule, the value of this coefficient for most public companies has already been calculated and can be easily found in numerous sources of exchange information. In particular, it often appears in the consolidated statements of the companies themselves.
For example, here is an excerpt from the Sberbank report for 2022:
Excerpt from the consolidated financial report of Sberbank PJSC
How to calculate earnings per share?
EPS – reflects the amount of net profit per ordinary share.
EPS = Income / Total common shares outstanding
Let's look at how earnings per share of a company are calculated using the example of Home Depot's reporting for 2022.
Let's take the annual net income of $12,866 million and the number of shares outstanding to be 1,080 million. It should also be noted that most companies calculate the EPS indicator and indicate it in the financial report.
Source: Home Depot Financial Statements
Thus, we calculate EPS = $12866 million / 1080 million shares = $11.94 per share. Don’t forget to bring the common numerator and denominator to “millions of dollars.”
Should you pay special attention to EPS when choosing stocks?
Unlike many other measures of a company's financial position, earnings per share are an absolute, not a relative, measure. Therefore, comparing the EPS of two different companies or industries will not make sense.
However, when analyzing an individual company, earnings per share, and especially the dynamics of this indicator over time, will allow you to assess how successfully the business is developing. At the same time, it is worth taking into account the pitfalls that have already been discussed: the growth of EPS may not be due to the growth in the profit of the main business, but to one-time events; and the attractive level of profit may be reduced by the presence of a large number of securities that can be converted into shares.
Ready EPS
You can independently calculate the profit per ordinary share, or use ready-made calculations. For each company, our algorithms calculate all ratios and multipliers, including EPS
In the company card in the “Financial indicators” tab, you can see the calculation of EPS and other indicators over several years and understand how the company feels now in relation to the previous 10-30 years.
Company analysis
Let's compare the EPS ratios of Sberbank and Norilsk Nickel.
- Sber's EPS for last year was 38.4 rubles per share.
- Norilsk Nickel's EPS is 1,037 rubles.
Earnings per share of Sber are tens of times lower.
Does this mean that it is more profitable to take Norilsk Nickel into your portfolio?
It means absolutely nothing. Here we have not taken into account the market value of the shares. And it also differs tenfold.
For example, EPS values for Russian companies.
Can this information help you in any way when choosing securities? Probably not.
Then why do we need this seemingly useless coefficient? There's no use for him.
You cannot compare performance between companies. Select stocks by value too. A high EPS multiple doesn't mean anything. There are companies with a very small EPS value, but in relation to the same penny price of their securities, it seems there will be a good profit.
Pros and cons of the EPS ratio
Pros:
- The rules for calculating EPS are standardized by US GAAP (Generally Accepted Accounting Principles);
- Earnings per share is one of the main financial indicators used to evaluate a company on the stock market, to compare the investment attractiveness of companies and their efficiency;
- You can see how much profit the investor receives per share purchased;
- Analysts often use EPS in forecasts, which in turn allows investors to gauge where the stock price will go.
Minuses:
- The EPS indicator has an absolute value, that is, it must be correlated with the market price of the stock. Thus, to make a balanced investment decision when comparing EPS with other companies, you need to use the P/E multiple;
- EPS calculations use earnings, which may be attributable to accounting manipulation;
- The EPS indicator has four varieties, which can lead to confusion in the calculations.
Investgram. A little about EPS and P/E.
The fair value of a share depends on many factors, but most likely investors are primarily interested in the company's profit, because why buy a business that does not make a profit?
I propose to consider two fundamental analysis multipliers that are common in the world, and several ways to use them:
- EPS (Earnings Per Share) – earnings per share.
- P/E (price/Earnings) – the ratio of share price (in our case capitalization) to net profit.
Let's start with EPS. It shows how much profit belongs to the shareholder after the company has paid all taxes.
Moreover, it is more correct to look at this indicator not for a specific company, but in comparison with competitors and in percentage terms. Let's go in order.
For example, company A earned 500 million rubles, and company B earned 100 million rubles. These indicators won't tell us anything until we calculate how much the company earned us as a shareholder per share.
You can calculate EPS in two ways:
The second method is applied if the company accordingly has preferred shares
This is the so-called basic EPS.
There is also a definition of diluted EPS and forward.
Diluted EPS is a calculation of the weighted average number of shares for the period under analysis.
It is believed that this is a more correct calculation, but you can limit yourself to a simple calculation; in any case, companies’ financial statements under IFRS contain information about EPS, taking into account two types of profit:
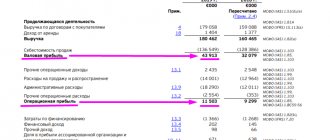
In this case, Lukoil’s IFRS report for the 3rd quarter is presented. 2019, which was released yesterday and it is worth noting that it is simply a record by the standards of the oil and gas industry. The company showed excellent results.
Let's do the math in practice using the report (18 pages)
Net profit must be divided by the number of shares = 776.42 rubles. Like in a Pharmacy.
Just having received the value of 776.42, it is not clear whether this is good or bad, but we can say for sure that if the company allocates 100% of its net profit to dividends, we will receive 776 rubles per share as a shareholder.
Having EPS = 776.42, you can understand what profitability the company provides per share relative to net profit. How to calculate?
As of today, Lukoil share price = ~6100 rubles
(776,42/6100)*100= 12,7%
It is this indicator (percentage) that needs to be compared with industry companies. Not a ruble value, but a percentage. This refers to the question that company A earned 500 million, and company B 100 million rubles.
The 12.7% indicator tells us that if the company allocates 100% of its net profit to dividends, then by purchasing a share at the current price, we will receive a 12th yield.
But not all companies pay 100%, we must take into account that growth companies can also direct money to business development, and this is where the second coefficient of fundamental analysis comes into play, which is responsible for the return on investment.
P/E helps to determine what lies behind the absolute values.
P/E tells us that if a company, with current profits, allocates 100% of its net profit to dividends, then... it will pay off in so many years. But again, you should not always focus on dividends. The company can invest profits in its development and this can also have a positive impact on its future value.
Using Lukoil as an example, you can calculate P/E. I believe that it is better to use annual reporting, but the age of high speeds and high technologies makes us also look at quarterly reporting.
So, calculations for Lukoil (report Q3 2022)
Company capitalization = number of shares * price of 1 share = 670,862 * 6100 = 4,092,258,200 rubles (do not count the signs - these are trillions). Capitalization can change every second, so let’s round it up to 4,100,000,000 rubles
Next we need profit - 520,868
P/E=4,100,000/520,868= 7.8 (almost 8 years). The calculation shows capitalization in millions, so the profit in the report is in billions (extra zeros are simply removed).
P/E by itself is useless, there are several interpretations of this indicator, I’ll try to display them on a chart:
You can calculate it differently, look at P/E by industry or by a specific company.
In this case, historical P/E values for Lukoil are presented. The values are rounded, the average is about 7.7 years. What the 6-year indicator at the end of 3Q2019 indicates is that the company’s price by the standards of the average value and Russia’s P/E in general is underestimated.
In Russia, P/E has historically been about 8-10 years; today in the oil and gas sector it is about 11 years.
Knowing the average value of a company or industry, we can calculate the fair value of a stock.
This article suggests taking the industry average = 11 years.
Fair value of Lukoil = P/E*EPS = 11*776.42=~8540 rubles. This value may seem too high, again. This result is calculated relative to these figures.
P/E = 11 is the industry average; you can take the lower or upper limits of the industry values and the future EPS for the stock.
All calculations, of course, are relative, and may differ from each other by substituting other values for both P/E and EPS. Because it is possible to calculate the value of Lukoil based on what we invest in - capital (P/B), which is not entirely correct; it turns out that Lukoil is trading at its values. P/B = ~ 1. It is worth noting that the calculations also did not take into account the company's dividend policy.
Unfortunately, there are no universal calculations for business valuation. Only one of the options is offered. And even EPS is no exception to this rule, despite the fact that it can show a more objective picture than just an assessment of the issuer's net profit.
Thank you for your attention!
VKontakte: vk.com/1nvestgram
Insta: https://www.instagram.com/_investgram_/
This information does not constitute individual investment advice and does not take into account your risk profile as an investor.
People's assessment
Car enthusiasts were very enthusiastic about the creation of a steering and chassis control adjustment system. Gradually, consumers began to get used to the innovation, significantly increasing the number of sales in the car market. The designers did not waste their working time, trying to modernize the system and come up with something more useful and economical. Corrections were made to the manufactured products. The most effective in this regard include the EPS systems of Mercedes.
What errors can there be in the models?
There are no specific errors for a specific model. The codes obtained during diagnostic procedures in the Volkswagen EOS will be similar to the coding on the Tuareg and Passat. The year of serial production also does not play any role. Diagnostics on modern Volkswagens and competitive foreign cars of recent years is built-in, and errors are calculated in thousands. It is not difficult for a road travel enthusiast to identify the problems with the system. You need to come to a service station, where a team of craftsmen will eliminate any type of electronic defect.
Example 3: Zoom and AT&T
To understand, let’s look at the example of two companies from the same sector - Telecom Services: Zoom and AT&T.
1. To do this, let’s take the moving average (TTM) Diluted EPS (for simplicity, you can look at the stock reports):
- Diluted EPS Zoom (TTM) = 1.44.
- AT&T Diluted EPS (TTM) = 1.52.
As you can see, the EPS values are not very different. But until we look at the share prices of these issuers, this in no way indicates any advantages.
2. Let’s find the stock price (for example, as of 12/10/20):
- Zoom price = $385.96.
- AT&T price = $31.46.
3. Let's look at the price/earnings per share (P/E) ratio:
- P/E Zoom = 385.96 / 1.44 = 268.02.
- AT&T P/E = 31.46 / 1.52 = 20.7.
As we can see, Zoom shares are actually very overvalued. Zoom's P/E is behind most of its sector peers. And in the overall valuation picture, AT&T shares are much more attractive to investors.
Flaws
- EPS gives a quick indication of profitability, but the indicator must be viewed in conjunction with cash flows and other indicators.
- EPS is subject to misstatement on repurchases.
- Shareholders do not have direct access to net profits and their distribution, despite publicly available information.
- EPS in the broad sense does not take into account financial leverage (an investor cannot know about its impact on profit).
- EPS can be easily manipulated through adjustments to depreciation/amortization rates or non-recurring items.
- One aspect that is often overlooked is capital. In this case, the indicator that will fully reveal the efficiency of the business will be ROE.
EPS manipulation
Because EPS has a strong influence on investor decisions, its value can be manipulated. Manipulation can occur due to an increase in net profit due to severe cost cutting, sale of part of the business, or buy back of shares. As a result, in the long term, this reduces the company's performance, but in the short term, it increases interest in the company's shares in the stock market.
This strategy was used by the “activist investor” K. Aiken, who bought controlling stakes. After that, he put pressure on the board of directors and changed the company's policies. He was forced to make decisions that were not effective for the company: reducing costs by firing staff, selling assets, repurchasing shares at an inflated price.
EPS, excluding results of extraordinary circumstances
EPS can be distorted, either intentionally or unintentionally, by several factors. Analysts use variations on the basic EPS formula to avoid the most common ways of inflating EPS.
Imagine a company that owns two factories for the production of smartphone screens. The land on which one of the factories is located has become very expensive as new startups have surrounded it over the past few years. The company's management decides to sell the plant and build another one on less expensive land. This deal brings a windfall to the firm.
Although this sale of land resulted in an actual profit for the company and its shareholders, it is considered a “result of extraordinary circumstances” since there is no reason to believe that the company will be able to repeat this transaction in the future. Shareholders may be misled if windfalls are included in the numerator of the EPS equation, so they are excluded for a more accurate estimate.
A similar argument could be made if a company were to suffer an unexpected loss (such as a factory burning down) that would temporarily reduce earnings per share, that loss should be excluded from the calculation for the same reason. Calculation of earnings per share without taking into account the results of extraordinary circumstances:
EPS = (NP - DP ± RPO) / Weighted average ordinary shares
where: PE - net profit DP - dividends of preferred shares RCHO - results of emergency circumstances
About types of codes
The error designation indicates problems with airbags, particulate filter devices, camshaft or crankshaft meters, and rotary sensors. Coding of such a series confirms power system failures. There is no reason to worry when you see a light come on when you start the ignition. In this position, the electronic stabilization device is activated to indicate its operating status. Stable burning of the lamp - here you have to involuntarily think about “illnesses”. Periodic switching on/off indicates interruptions in contacts.
Formula 1
Data is taken from the balance sheet and operating statements: the number of ordinary shares at the end of the period, net profit, as well as dividends on preferred shares (if any).
Earnings Per Share = Net Income / Total Number of Shares Outstanding
- The practice of using the weighted average number of shares for a certain period in the calculation is considered more accurate (time restrictions are eliminated).
- This method is used to account for the splitting of shares/dividends on them for the reporting period.
- EPS is sometimes adjusted to account for extraordinary items and preferred stock dividends. Holders of preferred shares have priority in receiving dividends over common shares.
- “Extraordinary items” refer to events that are considered unusual for the company, rare in nature. Gains/losses arising in connection with these items are disclosed in the financial statements separately for the period in which the item arose.