Good afternoon, dear readers! Andrey Mamontov is with you, we have the 2nd article in line about Japanese candlesticks for beginners. After reading it, you will receive popular Japanese candlestick models, with which you will improve your trading performance and learn to understand market dynamics. Today we’ll talk about Japanese candlesticks and combination analysis. In 1992, the Quantum , led by George Soros , collapsed the British pound. The day before this event (September 15), a clear “ Bearish Engulfing ” candlestick pattern formed on the chart. Everyone who read this market signal was able to make money with Soros. The rest of the participants simply watched this well-planned financial manipulation.
11.05. 2017, the situation is repeated on the pound/dollar chart. I have already entered into a downward trade, moved the position to a slight plus, and next week I expect the “ Absorption Pattern ” candlestick pattern to work out.
We will look at ten formations that, according to my personal rating, are considered the best. If you have your own option, I’ll be glad to test it. Illustrate your patterns in the comments below the article, and let's develop together .
What do you need to know before reading?
The first article in the series about Japanese candlesticks for beginners, “What are Japanese candlesticks and how to make money on the stock market with them,” will help you fully understand the topic. With its help you will learn:
- how to read Japanese candlesticks and why they can be used to really track the actions of major exchange players;
- why you shouldn’t use short time intervals and trade only on assets with a high level of volatility.
Be sure to study the proposed material and only after that start choosing candlestick reversal patterns.
Additionally, this article on how to start investing in stocks may help you. In addition, you will need information about the types and classifications of securities. Below will be a series of articles that you can read in your free time.
- "Investing for Beginners: First Steps into the World of Financial Freedom."
- “Why 95% of Beginning Investors Fail and How to Avoid Becoming One of Them.”
- “Stocks or bonds: where to invest your money?”
- “The process of competent investment in securities.”
- “Learning to buy securities: where to go and where to look?”
Let's move on to a review of candlestick combinations.
Japanese candlestick patterns: summary
Candlestick patterns are not a 100% trading strategy.
Moreover, they must be used wisely - filtered by support and resistance levels, oscillators, Fibonacci levels, trend lines, etc. If you take and open a blank price chart and start finding Japanese candlestick patterns on it, the result may be will be positive, but far from the best! There are many models - you should study them gradually. To begin, select 3-4 clear candlestick patterns and try to find them on the emerging charts and open trades on them. Once you are sure that these models are deposited in your memory, begin to study new formations and their practical use.
- Previous lesson: Japanese candlesticks for beginners and professionals: graphical analysis of financial markets using Japanese candlesticks
- Next lesson: Lines, levels and zones of support and resistance (support & resistance) in trading: support and resistance levels in binary options
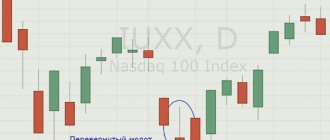
Hammer/Hanged Man
This is a single candle with a small body and a long lower tail. The appearance of this formation warns of the proximity of a strong level that can stop the existing trend.
Model features
- The body is located at the top;
- The lower shadow is at least twice as long as the body;
- The upper shadow is absent or has a small size;
- The body color of the figure is not taken into account during analysis.
Factors that enhance the formation
- Long shadow, 5 or more times the body size;
- Appearance of 2-3 hammers/hanged men in a row.
Note from Steve Nisson
The signal generated by the Hanged Man pattern needs additional verification . You can do this using one of the following filters:
- the new candle should be black;
- The opening price of the new candle was lower than the closing price of the Hanged Man.
This recommendation does not apply to the “ Hammer
Model variations
Inverted Hammer and Shooting Star.
These are weak candlestick patterns that require an indicator or other technical analysis tools to work with. Remember them and try not to use them in your trading .
What is a candle made of?
Traders whose strategy is based on Japanese candlesticks note that such a tool provides all the important information about the behavior of the asset price - I completely agree with them.
In addition, the shape of the candle allows you to quickly interpret the market situation and make decisions.
First of all, it is important to consider that candles come in 2 types:
- Bullish - the price has increased
- Bearish - the price has decreased
Both types have a similar structure and consist of several parts:
- The body is the wide part. The upper border of the body indicates the opening price (for a bearish candle) and the closing price (for a bullish one). The lower border of the body, on the contrary, provides information about the closure of the bearish and bullish ones.
- Shadow (or wick). The shadow is represented by vertical lines at the top and bottom of the candle body. The wick boundaries indicate the maximum and minimum prices in the specified time range. In some cases, shadows may be missing.
In the classic application, rising candles are white and falling candles are black, but modern trading terminals allow you to customize any colors. For example, it is popular to set up rising candles as green and falling ones as red, this way a psychological correspondence is achieved.
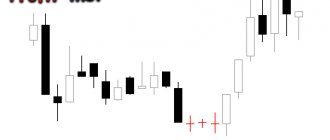
Absorption
This is a powerful reversal signal that is formed by a combination of two contrasting candles. For a long time, this model could be used as an independent trading strategy.
Model features
- Several candles are always involved in the formation of a figure;
- The bodies of the candles of a given combination always have a different color;
- The first candle should completely dissolve in the body of the second.
Factors that enhance the formation
- The second body is 4 times larger than the first;
- The pattern was formed after a sharp impulse movement in the direction of growth or decline;
- Several bodies dissolved in the second candle.
My observations
Unfortunately, in 2022 the situation changed and the formation was no longer considered reliable . Here's why this happened:
- In the history of the chart, “ Absorption ” is worked out in about 70% of cases;
- Due to its high accuracy, most beginners adopt this formation;
- Large players have tracked this activity and now, with every obvious “ Takeover ,” they try to work against the crowd.
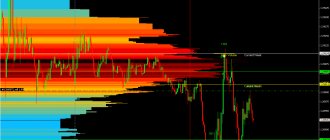
Daily chart of the dollar/canadian dollar . Absorption models that did not work : after their appearance, the market practically did not react or went against the expected forecast.
To avoid falling victim to market maker manipulation, I recommend using this combination only in conjunction with strong horizontal levels .
Conclusion
It is difficult for novice traders to notice important patterns. To learn this you need to spend some time analyzing and monitoring Japanese candlestick charts. To facilitate this process, you can use special indicators, such as CandleStick; this algorithm will independently identify important figures on the chart and notify the trader about their appearance. Here you can find a description of the most popular Forex reversal patterns.
In this article, I tried to talk about the long shadows of Japanese candlesticks, what they mean, and how they can be used in trading.
In order to keep abreast of all the most effective strategies, advisors, indicators and much other interesting things, subscribe to my newsletter. I wish you all good luck and good profits!
Clouds
These are trend reversal candlestick patterns that reflect a sharp change in market sentiment. A very strong signal that is worth taking a closer look at.
Model features
- This pattern is always formed by two candles;
- Candlestick bodies must have different colors;
- The second candle should close part of the body of the first candle.
Factors that enhance the formation
- The second candle covered more than 50% of the body of the first;
- With an upward trend, the second candle opened without an upward shadow, and with a downward trend, without a downward shadow;
- With an upward trend, the second candle closed below the resistance level, and with a downward trend, it closed above the support.
My recommendation
Cloud pattern has sufficient strength and can be used as a separate trading strategy. To improve signal accuracy , do the following:
- Wait for this candle combination to appear;
- In the middle of the second candle of the “Clouds” pattern, draw a horizontal level;
- Place a pending buy or sell order in the marked area.
This maneuver will somewhat reduce the number of transactions carried out, but will significantly improve their quality. The best way to raise your own level of trading is practice, and here you can’t do without registering with a good, proven broker company. The list of such options is in the table.
| Company | Just2trade | United Traders | BKS | Tinkoff investments |
| Minimum deposit | From $100 | $300 | from 50,000 rub. | Unlimited, you can even buy 1 share, they recommend starting from RUB 30,000. |
| Commission per cycle (buy + sell trade) | 0.006 USD per share (min. 1.5 USD), 0.25 USD for each application. that is, per lap – $3.50 | “Beginner” tariff – $0.02 per share Average $4 per round | At the “Investor” tariff – 0.1% of the transaction amount, at the “Trader” tariff it is reduced to 0.015% | 0.3% for the “Investor” tariff |
| Additional charges | The ROX platform will cost at least $39/month. (for the American market), for an additional $34.50 they connect Canada/TSE, Level II On the over-the-counter market, the additional fee is 0.75% of the transaction volume (minimum $30), in the case of dividends - 3% from the issuer (minimum $3) | On the Day Trader tariff, they charge $60/month for the Aurora platform, free on other plans | If the account has less than 30,000 rubles - 300 rubles/month. for access to QUIK and 200 rub./month. for access to the mobile version of QUIK, | — |
| Account maintenance cost | $5/€5/350 rub. reduced by the amount of the commission paid | — | 0 RUR/ month on the “Investor” tariff. On other tariffs, funds are debited only if there was activity on the account this month | Free for the "Investor" tariff |
| Leverage | for Forex Up to 1 to 500 for stocks up to 1 to 20 (day) to 1 to 5 (night) | 1 to 20 on the Day Trader tariff, this is the maximum leverage (daily) | Calculated for each share, within the range of 1 to 2 – 1 to 5 | Calculated for different instruments, the calculation is linked to the risk rate |
| Margin call | -90% | Standard -30% of the deposit, in technical terms. support can be set -80% | Calculated based on the risk for each security | Depends on the asset |
| Trading terminals | MetaTrader5, ROX | Aurora, Sterling Trader, Fusion, Laser Trader, Volfix.Net, Pair Trader | My broker, QUIK, WebQUIK, mobile QUIK, MetaTrader5 | The purchase of shares is implemented like an online store, professional software is not used |
| Available markets for trading | Forex, American, European and other stock markets, cryptocurrency | American and other stock markets, more than 10,000 assets in total, cryptocurrency | Foreign exchange, stock, commodity markets, there is access to foreign exchanges | American and Russian stock markets |
| License | CySEC | Lightweight license from the Central Bank of the Russian Federation | TSB RF | TSB RF |
| Open an account | Open an account | Open an account | Open an account |
Stars
This candlestick pattern reflects a gradual change in market sentiment : dominance of one side, a reversal, seizure of initiative and movement in the opposite direction.
Model features
- The pattern is always formed by three candles;
- The second candle consists of a short body and small shadows;
- The color of the second candle is not taken into account during combination analysis;
- The trailing candle should cover most of the body of the first candle.
Factors that enhance the formation
- The second candle has a “ Dodge ” shape, that is, its opening and closing occurred at the same level;
- The second candle was not located at the same level as the first and third, but formed a price gap up or down;
- The third candle covered almost the entire body of the first.
My recommendation
I only pay attention to " Stars " when all three enhancing factors come together. The resulting formation is called " Abandoned Baby ". If you combine it with strong horizontal levels, then the probability of signal processing increases to 70%.
“ Abandoned Baby ” is an enhanced version of the “ Morning Star ” and “ Evening Star ” patterns.
Psychology of traders
Experienced traders need only look at the chart to understand the market situation. The structure of candles allows you to determine the behavior of market participants.
Based on these data, we can assume possible developments in the near future. When briefly studying a candlestick chart, you should pay attention to several indicators.
- The presence of candles (dark or light) with long bodies. The size of the candle body characterizes the increased activity of market participants. White long ones indicate buying pressure, black long ones indicate increased seller activity. If white long bodies appear after a long downward trend, this may indicate a trend reversal (and vice versa). If the bodies are short, we can talk about stagnation or consolidation.
- Long shadows. The peculiarity of candlestick formation is that the body shows only price indicators at the time of opening and closing. However, in this time period the price indicator can fluctuate over a wide range. This is what the shadows will indicate.
- If the candle body turns into a thin line with long shadows, this indicates an active struggle between sellers and buyers where the winner has not yet been identified.
Ricochet
These are very unusual reversal patterns that occur quite rarely and usually cause major players to intervene or publish unexpected economic forecasts.
Model features
- In an uptrend, three sequentially rising candles are formed, the bodies of which do not intersect with each other. During a downward trend, this rule is worked out in a mirror manner;
- The fourth candle opens with a gap and does not intersect with the body of the third candle;
- In a downtrend, the fourth candle must meet two conditions: open above the close of the second candle and close above the open of the second candle;
- In an uptrend, the fourth candle must meet two conditions: open below the close of the second candle and close below the open of the second candle.
For this model, there is no need to look for additional factors that enhance its significance. If you see a similar combination on the daily or weekly chart, I recommend immediately entering the trade at the market price. In most cases, the Ricochet is followed a strong price impulse , from which you can make good money.
Bearish candlestick patterns
Bearish Japanese candlestick patterns are patterns, after the formation of which, the price falls. They should also be filtered by resistance levels or Fibonacci retracement levels, and you can also use indicators that predict price reversals.
Abandoned baby – bear model (abandoned baby)
The abandoned baby (bearish pattern) is a complete mirror image of the bullish pattern. The first candle is bullish, the second candle is a doji with small shadows, the third candle is a reversal (bearish). The pattern is formed at strong resistance levels. Entry after the formation of the third candle.
Dark cloud cover
A dark curtain (in Price Action - bearish CPR) is a candlestick pattern in which the second candle breaks the high of the first candle, but closes well below its opening level. The candle indicates the strength of the bears and the continuation (or beginning) of a downward trend. Login immediately after the model is formed.
Evening doji star
Evening Doji Star is a candlestick pattern that forms only at the tops of trending movements. The price moves up, after which it encounters a strong resistance level, from which a reversal occurs. Enter down immediately after the formation of a pattern of three candles.
Evening star
The evening star is exactly the same pattern as the “evening star-doji”, with one difference - instead of a doji, there is a small candle with a shadow on top (or just a small candle). Formed at the tops of upward trends.
Three inside down
Three inside down – a reversal candlestick pattern, consisting of an inside bar and breaking through the boundaries of the mother candle against the current trend (breakdown downwards). Enter a bearish trade immediately after the formation of the third (confirming) candle.
Three outside down
Three outside down is a variant of a reversal candlestick pattern with engulfing. The second candle engulfs the first bullish candle, and the third candle only confirms the price reversal. The model is quite strong and is formed at the tops of trend impulses. Entry immediately after the confirmation candle closes.
Advance block
The repulsed offensive is three ascending candles, the last of which has a long shadow at the top. The fourth candle should be a reversal candle. It’s not bad at all if it forms a bearish CPR (breaks the high of the previous candle and closes below the opening price – as in the example above). Entry immediately after the formed reversal candle.
Breakaway candlestick
A breakout candle is a formation of five candles. The first four candles are moving upward, the fifth candle is bearish. It should absorb the last three candles - a signal to open a downward trade.
Deliberation
Reflection – reversal pattern or trend continuation candlestick pattern. A distinctive feature of the formation is that the second candle, most of its body, is located within the first candle, and the third candle is a doji candle or a candle with a small body. The fourth candle is a reversal candle - entry down after its formation.
Downside tasuki gap
The lower tasuki gap is a candlestick pattern of three candles. The first and second candles are downward, the third candle is upward. The second candle is formed with a gap (the gap between the candles), the third candle begins to form approximately from the middle of the second candle. Enter a bearish position after the formation of the third candle.
Dragonfly doji
Dragonfly Doji is a reversal pattern with a dragonfly Doji (a Doji candle whose shadow is directed against the uptrend). Before opening a trade, be sure to wait for the reversal candle!
Engulfing
Absorption is a candlestick pattern (in this case, bearish), in which the first candle is completely contained within the second candle (the second candle formed above the high of the first and closed below the low of the first candle). Enter immediately after the formation of the pattern - expect a strong downward price movement.
Meeting lines
Colliding candles are an interesting candlestick pattern in which the first upward candle collides with a second downward candle. It is interesting that the second candle begins its formation significantly higher than the high of the first candle, and the closing of the second candle very often occurs at the high of the first candle. Enter immediately after the formation of the second candle.
Three stars
Three stars are three dojis formed at the top of a trend and at the same horizontal level. A signal for a further price decrease, although first it is better to wait for a confirming candle - a candle with a downward movement, which should form immediately after the third doji candle.
Gravestone doji
A Tombstone Doji is a pin bar formed at a strong resistance level after a strong upward move. The pin bar should have no body and no shadow below (or a very small shadow). The longer the shadow above, the stronger the reversal pattern. You can enter a bear market immediately after the pin bar appears, or after a confirmation candle.
hanging man
A hanging man is a small candlestick with a long shadow at the bottom at the top of a trend. The color of the candle does not matter - only the shape matters. After the hanging man there should be a candle confirming the reversal - entry into a decline only after it.
Belt hold
Belt grab is a candlestick pattern where one downward candle engulfs three previous upward candles. It is formed both at the tops of trend movements and during price corrections. Entry immediately after the engulfing candle.
Harami
Harami is a pattern where the first second candle closes approximately in the middle of the first candle. At the same time, their maximums are the same. This formation is worth considering. Like a reversal, but it is better to wait for confirmation in the form of breaking the low of the first candle.
Shooting star
A shooting star is a pin bar that formed at the top of a trend or a local maximum. The pattern must be confirmed by the resistance level at which the pin bar was formed. The color of the candle does not matter, the main thing is that the body of the candle is three times (or more) smaller than the shadow above. Enter a trade immediately after the formation of a pin bar or after a confirmation candle.
Harami cross
A harami cross is a pattern consisting of a full-bodied candle followed by doji candles (uncertainty candles). The model is formed at local highs, but to enter you should wait for confirmation of the reversal.
Tweezers top
The top of the tweezers is a formation of one full-bodied rising candle and a candle with a small bearish body and a long shadow below. This pattern is considered a reversal pattern, but it is better to wait until the low of the first candle is broken and only then open a downward trade.
Harami
This is an easily recognizable combination that resembles a pregnant woman in appearance. Harami is considered an early signal that warns of imminent market instability . After this pattern appears, it is advisable to take profits and wait for new conditions to arise using indicators.
Model features
- Always consists of at least two candles;
- A large candle completely dissolves the second and all subsequent candles in its body;
- The trailing candle has a small body and short shadows. The color of this candle itself is not important and is not taken into account during the analysis.
Factors that enhance the formation
- The closing candle looks like a “ Dodge ”. This formation is called a “ Harami Cross ” and usually occurs in an area of strong price levels;
- More than 5 trailing candles have dissolved in the body of the mother candle;
- After the Harami , a control candle appeared. During a downward movement it should be white, and during an uptrend it should be black.
Tweezers
These are two or more candles that formed equal price highs or lows within the same market period.
Model features
- The tweezers must consist of at least two candles;
- The group of candles participating in the combination must follow one after another;
- Each candle must exactly repeat the minimum/maximum of the previous one.
Factors that enhance the formation
Tweezers pattern becomes more significant if it is part of another reversal candlestick combination. Below you can see some examples of how this can happen.
My observations
Tweezers is an excellent pattern that tells traders the location of a significant horizontal level . I check this combination with indicator readings, and if the value is confirmed, I place pending limit orders at the minimum/maximum.
Candlestick patterns
Candlestick analysis refers to a number of patterns that help analyze the situation on the financial market and predict price behavior. The term pattern is usually understood as a combination or figure consisting of candles. Their presence signals a continuation or reversal of the trend.
From the author
Roman Zif
Ask a question to the author
It so happened that the same candlestick pattern can have several names because they are called in the Japanese manner, in translation, and sometimes the same pattern was renamed from the original to the modern one. For example, Hammer and Inverted Hammer are now more often called Pin Bar.
I tried to describe most of the patterns, even if they are the same, but have different names, so that it would be easier for you to navigate among traders who use the same pattern, but under a different name.
Hammer
The hammer is an important chart pattern and is represented by a candlestick with a long lower tail and a short body at the top of the pattern. Body color doesn't matter. A hammer can only form during a bearish trend in the market.
Such a figure on the chart is a signal for an imminent trend reversal, especially if the hammer acts as a local maximum.
The Hammer pattern intensifies if the shadow is more than 5 times the size of the body or several hammers appear on the chart in a row.
Hammer
If we talk about the psychology of traders, then the presence of a hammer means a long-term predominance of bearish sentiment. This is evidenced by a long tail in this direction. However, at the last moment the bulls still seize the initiative.
Today, with an understanding of how Forex works, we can say with confidence that such a pattern is a capture of liquidity before a market reversal - this is how we see the intention of the major players.
Interestingly, in Japanese such a candle is called “Takuri”, which means “trying to measure the depth by feeling the bottom with your foot.”
Inverted Hammer
The structure of the Inverted Hammer is a mirror image of the previous pattern (Hammer). You should always look for such a pattern at the bottom of the chart. If this condition is not met, then it is another figure.
The inverted hammer is considered a weak pattern and requires additional confirmation by other means of technical analysis.
Inverted Hammer
Hanged
The Hanged Man is identical in appearance to the Hammer. It has a short body in the upper part and a lower shadow, which must be 2 times longer than the body. The only difference is that the Hanging Man forms at the top in a bullish direction. Like previous figures, it appears before an imminent change in price direction.
When the Hanged Man appears, you must wait for a confirmation signal. This could be a price gap (GAP) down or a bearish candle.
Hanged
Top
This element is represented by a candle with a short body (it can be either light or dark). The wicks on both sides are long and approximately equal to each other. As an independent signal, the Top is almost never used due to its low information content. However, it can enhance the performance of other candles in the pattern.
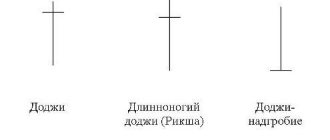
Doji (Doji)
These patterns are characterized by the fact that the opening and closing prices were the same. For this reason, the body of the figure becomes a thin strip, the color of which cannot be determined. If the Doji appears on the chart, it indicates that the bears and bulls are unsuccessfully trying to gain the upper hand in the trade.
Doji's shadows can be different; taking into account this characteristic, it is customary to highlight several figures (Rickshaw, Grave, Dragonfly).
Pattern Long-Legged Doji (Doji)
This figure is a type of Doji and is characterized by the fact that the lower shadow is longer than the upper one. When it appears on the chart, you should expect a quick reversal of the current trend.
Rickshaw pattern
The rickshaw is a variation of the Doji figure, which has already been described above. The distinctive features of the Rickshaw are:
- a short body that turns into a feature;
- The top and bottom wicks are too long.
Rickshaw and the Long-Legged Doji
Japanese Candle – Dragonfly
This figure is considered a type of Doji, since it has an extremely short body in the form of a feature. However, it differs from Doji in the location of the body and the length of the wicks. So, a dragonfly has only a long lower shadow (tail). There is no top wick, so the body is located at the top of the candle.
Dragonfly
Gravestone or headstone
Gravestone has similar characteristics to Doji. Its opening and closing price levels are equal, so there is no big body - it is replaced by a thin line at the price low. In this case, there is only a long upper wick, there is no lower shadow. If the Gravestone appears on top, this is an indicator of a reversal.
Gravestone (Tombstone)
Marubozu
This name is given to a candle that has a body, but is devoid of shadows. This figure can be painted either white or black.
A white body is a sign that the bulls have dominated the market during the current period of time. The trend will not change in the near future and the price will only rise. With the black Marubozu, things are exactly the opposite.
Marubozu
Stars
Stars are candles with a small body and short shadows. They are located on tops or bottoms and necessarily open with a gap.
Stars are included in four reversal patterns:
- morning Star
- Evening Star
- Doji Star
- Falling star
Morning and evening star
The Star figure is a candle with a short body and small shadows. It occurs after gaps (price breaks). This model refers to reversal patterns and comes in two types:
- Morning Star - it is located at the base of the price chart (price minimum);
- Evening Star - acts as a pinnacle.
If the small candle is a doji, then the reversal patterns will be called “Morning Star Doji” and “Evening Star Doji” respectively.
morning Star
Evening Star
Falling star
A shooting star appears at a resistance level and indicates the end of an uptrend. It has a small body and a very long upward shadow. The body of the candle can be either black or white.
Shooting Star
The Shooting Star, like the Inverted Hammer, is a weak reversal pattern and requires additional confirmation.
Paper umbrellas
The Paper Umbrella figure is also sometimes called Caracas. It is a candle, the small body of which is located at the very top. Her lower shadow is long, and her upper shadow is completely absent.
Pattern Tweezers
Tweezers belong to the category of reversal patterns. Such a figure can form both at price highs and lows. Among its characteristic features:
- tweezers consist of at least two candles;
- candles must go sequentially one after another;
- The top “tweezers” has the same price highs, the bottom “tweezers” has the same price lows.
The significance of tweezers increases after a long trend or when confirmed by other candlestick signals (doji, hammer, hanging man, etc.)
Top "Tweezers"
"Tweezers" base
Veil of dark clouds
This reversal pattern consists of 2 candles and appears only in an uptrend. Among the main features:
- the first figure with a white long body;
- the second figure with a black body, its opening level appears above the high of the first (there is a gap);
- The close of the second candle should be lower than the middle of the first.
Veil of dark clouds
Clearance in the clouds
This pattern occurs after a downtrend and forms a depression. There are several mandatory signs of Clearance in the Clouds:
- after several black candles, the white one opens with a gap;
- the lower shadow is necessarily short or completely absent;
- The white figure must close with partial absorption of the black one, in other words, the closing occurs higher than the middle of the previous figure.
Clearance in the clouds
Two flying crows
The extremely rare pattern of Two Crows Flying Up means an imminent reversal of the uptrend. A similar model includes 3 candles:
- the first is bullish - it must have a long body;
- the second is bearish - it is smaller, but it opens with a gap;
- the third is also black. Its body should completely absorb the body of the previous black candle; the size of the shadows is not important.
Two flying crows
Grips
Candlestick capture refers to a large single candle that occurs in opposition to the current trend. This pattern should not be confused with “ Clouds ”, where two candles are approximately equal in size. “ Capture ” is a contrast candle that is visually easy to identify on the chart.
Model features
- It is always one candle that appears against the trend;
- If the trend is downward , then a white candlestick without a lower shadow should appear. If the movement is upward , then you should expect a black candle with a cut top;
- The pattern should open with a price gap, and the closing point will cover most of the previous candle.
Factors that enhance the formation
- " Capture " appeared after a protracted unidirectional movement;
- Two large candles appeared in one price zone against the current trend (a “ Double Capture ” was formed);
- After the Bullish Takeover , the next candle turned out to be white, and after the Bearish Takeover , it was black.
My recommendation
“ Capture ” is an aggressive pattern, after which you need to open a trade against the trend . This option is suitable only for experienced traders who know how to properly control risk and find the optimal entry point.
Counterattack
These are two contrasting candles, whose closing points are at the same price level, called the “ balance line ”.
Model features
- Two oppositely colored candles with approximately the same body sizes were formed;
- The trailing candle always opens with a price gap that matches the main trend;
- The bodies of the candles participating in the combination do not overlap each other and always close at the same level point.
Factors that enhance the formation
- On the path of the price movement, a round level with a double or triple zero (1.1000, 1.2500) was formed;
- After the appearance of a new candle, the “ Counterattack ” pattern moved into the “ Tweezers ” formation;
- The next candle that occurred after the " Bearish Counterattack " closed below the " balance line ". For a Bullish Counterattack , the new candle must settle above the Balance Line .
Offensive
The appearance of the candlestick combination in question indicates that the new trend is gradually gaining strength .
Model features
- Three candles should follow each other and be painted the same color;
- Each subsequent candle must set a new price high/low;
- All three candles have approximately the same body size.
Be extremely careful
Advance pattern has a variation called the Three Methods . The appearance of this pattern indicates that there has been a temporary correction and the old trend continues.
- “ Bull offensive ” or “ Three soldiers ” - buy (for “Three methods” - sell);
- “ Bear offensive ” or “ Three Crows ” - sell (for “Three methods” - buy).
My recommendation
When working with the Advance , always wait until the fourth candle closes . This simple action will slightly reduce the number of entries, but will protect you from the “ Three Methods ” model and opening a trade against the trend.
Summary
Friends, you have studied the 10 strongest candlestick combinations that can help you make money today. Unfortunately, until you put this knowledge into practice, it will not be useful. To prevent this from happening, I recommend that you do the following:
- Review the article again;
- Make your own rating in which you rank all the patterns on a scale from 1 to 10 ;
- Leave the first three positions and cross out the rest;
- Open a demo account and test the selected patterns. The best broker for stock trading is Just2trade, an excellent broker for forex trading is Amarkets ;
- Evaluate the result and leave for work only one candlestick formation that showed the maximum result ;
- Proceed to trading on a real account;
- Share examples of several successful transactions in the reviews below this article.
Thanks to all. I hope that the proposed material contained only information that was useful to you. Don't act like the hero of this meme
As always, it's all up to you . See you in new articles!
If you find an error in the text, please select a piece of text and press Ctrl+Enter. Thanks for helping my blog get better!