One of the classic technical analysis tools is the Parabolic SAR indicator. This is a visual graphical way to determine the current trend, which allows you to predict a change in trend.
Modern traders most often use the parabolic indicator not separately, but in combination with other indicators. Selecting the right strategy takes considerable time, but as a result, it allows you to get a stable profit by correctly predicting changes in the price of cryptocurrency and other assets.
What is Parabolic sar
Parabolic SAR is one of the classic and most common indicators that was developed in the 1970s. American expert Welles Wilder. He is also the author of such famous tools:
- ATR;
- RSI;
- DMI.
The main purpose of the parabolic is to track the current trend in the market and its possible reversal (SAR means “Stop and Reverse”, i.e. stop and reversal). Graphically, the indicator is depicted as several points following each other.
If they are located above the candles, there is a downward trend in the market; if below them, there is an upward trend. When one trend changes to another, the points move under or above the cryptocurrency chart.
The calculation of the indicator is based on a fairly simple mathematical formula. The parabolic is determined by the highest and lowest prices of the previous period. After analyzing market trends, Wilder derived 2 formulas:
For long positions:
For short positions:
Here SAR represents the parabolic value for a specific period i (for example, 5 minutes, 1 hour, 1 day, etc.), LOW is the minimum price value for the previous period, HIGH is the maximum price for the previous period, AF is the acceleration factor.
For modern traders studying the charts of cryptocurrencies and other assets, these theoretical calculations are not of particular interest. The main task is the practical application of Parabolic. To do this, you need to install it on the trading platform and study the features of the signals sent by this tool.
Setting stop loss and trailing stop
Perhaps the main advantage of the parabolic is its convenience for working with the feet.
Stop can be placed directly on the indicator point. As soon as a new candle and a new point appear, the stop is moved to it. and so on until the price and indicator get so close that the position is closed. Or the deal will close itself at take profit.
This indicator is very good in terms of risk management discipline. Many traders, especially beginners, knowing the importance of cutting risks and not allowing losses to grow if it is clear that the situation is against them, still often, during drawdowns, begin to pull the stop further from the opening price in the hope that a reversal will occur and the transaction will become profitable. This also happens, but it’s still better to rely on your original plan rather than rely on luck.
You can strictly set your stop along the parabolic line, thereby cutting off doubts and thoughts about the correctness of the setting. If the market moves against the position, the indicator will still move closer to the price so that the stop placed on it will be very small and will not allow your risks to grow.
How to install the indicator
The parabolic sar indicator can be found in any program - for example, in the MT4, MT5 terminal or on a live chart.
To install in MT4/MT5 you need:
- Log in to the MT4 terminal.
- Select the "Insert" tab.
- Then – “Indicators”.
- Go to the “Trending” section.
- Select "Parabolic SAR".
- Specify the required parameters - you can leave the basic ones in increments of 0.02 and a maximum of 0.2. It is better to change the color to black for easier perception.
- As a result, the parabolic will appear in the form of points above and below the asset candles.
Unlike the terminal, you do not need to download the Live Chart program - just go to the desired platform and select a parabolic.
The instructions are simple:
- Click on the icon with a wave and a plus sign.
- Find the indicator in the list or enter “Parabolic SAR” in the search line.
- Select a tool.
- After which the parabolic will appear on the platform.
- Its settings can also be changed. To do this, click on the “gear” icon.
- And then select the desired parameters Start, Increment and Value, click OK.
If the indicator is not available on the trading platform, it can be downloaded and installed from any resource. The file is downloaded as a document, which is then installed in the terminal.
To do this, you need to open MT4 and follow this path:
- File.
- Open the data directory.
- MQL4 or MQL5.
- Indicators – the downloaded file is copied to this folder.
Then you need to restart the MT4 terminal - that is, close the program and open it again. The further sequence of actions for adding parabolic sar is exactly the same.
Installing on a chart and setting up Parabolic
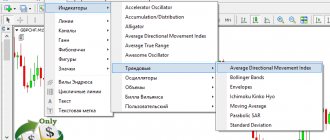
To install this tool on a chart, you do not need to first search the Internet and download it. The indicator is included in the package of standard tools of any trading terminal and can be pulled out onto the terminal chart from the “Insert” menu:
Installing Parabolic SAR on a chart in MT4
After clicking on the instrument, you will see a window with its settings on the chart:
Setting the properties of the Parabolic SAR indicator
In the picture above you see two tabs with the properties of this tool - “Options” and “Display”.
Options Tab
Allows you to configure three properties of Parabolic ATS:
1) Step – the set parameter here is responsible for sensitivity to price changes. By default its value is "0.02". If you want to change the step, remember that:
- by setting a lower value, you will receive more reliable signals from Parabolic SAR, but they will appear with a delay;
- setting a higher value makes the indicator more sensitive to price changes, it will be able to determine the direction of the trend earlier, but you will receive more false signals from it.
2) Maximum – this parameter defaults to “0.2”. It corrects the “step”, smoothing out its distortions in well-defined trends. Changing its value will not have much effect on its operation.
3) Style – here you can set the color and line thickness for optimal visualization of the Parabolic SAR curve on the graph.
Display Tab
Allows you to set the time period (TF) over which the indicator curve will be displayed. Remember that the author of the tool recommended working with it on the H1 time frame.
A few recommendations for setting up:
- When changing the “Step” parameter, change the “Maximum” parameter in proportion to it. If, for example, you gave the first a value of 0.07, then the second should also have a corresponding value – “0.7”.
- Here you can experiment with Parabolic SAR. Optimal settings of its parameters can be achieved by comparing them on trading results, depending on your chosen trading style and type of trading strategy.
- Remember that the changed Parabolic ATS settings have different effects on trading efficiency, depending on the currency instrument you choose and the time period (TF).
It should be added that the indicator works according to a complex algorithm, which is based on complex mathematical calculations. There is no point for us to go deeper into these calculations and build the Parabolic curve manually when any terminal has a ready-to-use instrument - just install it on the chart and start working.
Signals for entry using the indicator
The use of the indicator is so simple that even a beginner can master the basic strategy:
- Login to buy (BUY) is carried out in cases where the indicator point has moved from the position “above the candle” to the position “below the candle.
- Similarly, sell entry (SELL) is done when the point under the candle is replaced by a point above the candle.
One of the rules of technical analysis states that the time for predicting a trend is determined based on the time frame - the price of one candle is multiplied by 5. For example, if you analyze an hourly chart, a trader can assume that the development of a new trend will take at least 5 hours (the price of one candle is 1 hour* 5 ). If we take the M5 chart as a basis, the trend can be predicted for 25 minutes ( 25 min*5 ).
From the figures it is clear that the indicator predicts a trend reversal - a change from an upward trend to a downward one or vice versa. However, such a simple understanding of the entry point into the market leads to losses in the long run. In fact, parabolic sar is almost never used alone, i.e. this indicator is not a solo indicator. Almost all modern trading strategies involve its use in combination with other trading instruments.
Important! The basic settings of the indicator can be changed by increasing or decreasing the step. However, in most cases, the settings remain by default, since this is the approach that allows you to best predict changes in the cryptocurrency rate.
Parabolic trading: let's summarize
So, what did we finally come to?
- Parabolic is a trend indicator and works only in a trend.
- It makes it easier to spot trends and is quite good at Forex.
- Parabolic and sideways price movements are not friendly at all.
- Parabolic is often combined with other indicators, such as MACD, ADX, etc.
- The sensitivity of the parabolic can be increased or decreased.
This is an advanced indicator, definitely not for beginners who can start with something simpler like the Rainbow strategy or Bollinger Bands.
Like any other indicators and strategies, there are people for whom it will be a discovery, and there are those who will look at it with complete bewilderment, not understanding the principle itself.
And that's okay. This is why there are tens of thousands of indicators - because traders try to create options that suit their psychology and trading style. So try it, take a closer look at it, look at real charts and share your experience in the comments or on the forum .
How to set Stop-loss and Take-profit
If for binary options traders it is enough to simply predict the direction of movement of an asset “up/down”, then for the Forex market it is necessary to clearly understand at what level to set the stop loss and take profit.
The first tool allows you to close an order if the price reaches a critically low or high value, the second allows you to fix the minimum profit so as not to lose it if the trend changes.
There are no general rules for setting these levels - they depend on the strategy and preferences of a particular trader. However, in most cases the following criteria are used:
- Stop-loss is set slightly below the local minimum or slightly above the local maximum. For example, if the parabolic shows a trend reversal, you can open a buy order and then set a stop loss just below the nearest “hole” - the minimum price value.
- Take-profit should be set at least along the midline between the nearest minimum and maximum.
At the same time, you should pay attention to the main rule of risk management: the maximum size of the bet and possible loss should not exceed 2-3% of the total deposit amount. For example, if a trader has $100 on his balance, he must set a stop loss so that the loss is no more than $2-3.
Read more in our article: What are Stop Loss and Take Profit in trading?
Practice of application according to the trend
The parabolic shows not just the trend, but also its strength, and hints when the trend will end. For example.
The trend is going down, big red candles, that's it. But look - the distance between the parabolic signs is getting larger . This suggests that the trend is running out of steam.
Finally, the last parabolic sign came close to the candle (red arrow) - the trend ended. As usual, after a trend, a new one does not immediately begin - the price can rest and sit in a sideways movement, which is indicated by a rectangle.
Having rested, the price decides to win back and a small upward trend begins, with a green arrow and the first parabolic sign. Here is your signal for Call.
Another example.
The same eggs, only in profile. The parabolic shows the trend. Gradually, the distance between the parabolic signs begins to increase.
The last parabolic sign almost touches the candle (red arrow) – the trend is complete. And a sideways movement begins, after which the price falls to win back the previous rise.
That is why this indicator is so popular in Forex, where there are no expirations and where there is continuous work along the trend, which the parabolic shows very skillfully.
Binary traders need to remember that the parabolic, as in the example above, resembles trend lines - and where is the best place to enter a strong trend? Correctly on a small pullback. In our case – on red candles.
Another example. Look how similar it is to the previous one.
Similar situation. The trend from the first sign of the parabolic goes slowly upward, the distance between the signs expands, the sign touches the candle - bam, the trend is complete. Sideways (rectangle) and followed by a trend reversal, at the very first sign of the parabolic from above, into which the green arrow is poking.
Beauty, blunder.
Strategies with Parabolic SAR
All modern strategies are based on the use of 2-3 or more indicators. Basically, other classical technical analysis tools are used in combination with the parabolic.
Parabolic + ADX
ADX is another classic technical analysis tool that can be found in the MT4 terminal (Custom tab).
The strategy signals are:
- If the parabolic point goes from top to bottom, and the green ADX line is located above the red line, you can open a BUY .
- If, on the contrary, the parabolic point goes from bottom to top, and the green ADX line is located below the red line - a SELL .
Paraboli SAR + Stochastic + EMA strategy
To use this system, you need to add Stochastic (values 7, 10 and 4, standard levels 37 and 63) and EMA (100) to the parabolic. Stochastic can be found in the “Oscillators” tab, and EMA can be found in “trend indicators”.
The sell signals are as follows:
- The parabolic point moves from the lower to the upper position.
- The chart goes below the EMA.
- The fast Stochastic line crosses level 63 in a downward direction.
Buy signals look exactly the opposite.
Parabolic + MACD
MACD is an indicator that can be found in the Oscillators tab. Its settings remain standard (12, 26, 9). A signal to sell is a combination of the following parameters:
- The parabolic points go above the candles.
- The MACD histogram bars cross the “0” line, moving downward for at least 3 parabolic points.
Signals for buying are opposite.
Will the indicator help you in trading?
Parabolic is a very effective tool for predicting market conditions. Various advisors and strategies are created on its basis. It is necessary to use it, but with strict adherence to certain rules:
- use only as a primary analytical mechanism if additional funds are available;
- take into account the ability to calculate historical intervals;
- use it as the main one, without tools that clarify its indicators, only on a timeframe lasting more than one hour;
- trade only after changing the color and direction of the chain;
- take into account expiration time;
- enter into a contract only at the beginning of the formation of the next candle;
- open a deal after the formation of at least 3 new points;
- do not trade in flats, during accumulation, on rebounds and false breakouts.
You need to start learning Parabolic only on a demo account. In addition to it, there is no need to use complex mechanisms for analytics with a large number of lines and calculations.
Parabolic is undoubtedly very effective. And its effectiveness is achieved due to its simplicity and visual basis. Such an indicator does not show sharp jumps and flat fluctuations. Only trading in a calm market, with an average rate of change in the value of an asset, can give positive results and maximum profit. Following the rules of use, calculating the dynamics and duration of the trend and analytics paired with an additional indicator will help you create an ideal Parabolic-based and highly effective strategy. Advisors based on one Parabolic are also considered effective.
The developers are trying to improve an already profitable and very effective tool. Various strategies are built on its basis, thereby complicating the standard algorithm. Finding a profitable advisor is difficult and often expensive. It is better to use the standard Parabolic SAR indicator - we have discussed how to use it today in as much detail as possible. And with the right approach, it can easily become one of the most effective solutions in the field of analytics, concentrated in the hands of a successful trader.
Pros and cons of the tool
The review shows that the parabolic indicator has both pros and cons. Its tangible advantages include:
- It shows general trends well, especially on large timeframes at a level not lower than hourly.
- Easy to understand for both experienced and novice traders.
- Easily combined with almost all other indicators – trend and others.
- Does not require significant adjustments to the settings - in most cases, traders recommend using the default basic settings.
However, the tool is not without its drawbacks:
- The tool works well only in conjunction with other indicators.
- To create a truly effective strategy, it will take considerable time - making entries simply based on parabolic readings is risky.
- Parabolic works quite well only in a trending market. Practice shows that flat situations often arise on the stock exchange, when the price cannot decide on the direction of movement for several hours or even days.
- Finally, the indicator does not work during news releases, which is a common flaw in technical analysis. In such situations, you should use strategies based on fundamental analysis, which takes into account not mathematical algorithms, but the market reaction to important socio-economic and political events.
Parabolic and other indicators
However, as a rule, people use the parabolic along with other indicators that help confirm the trend. Now let's look at a few of them.
Parabolic and Stochastic
The stochastic (in this case, Stochastic RSI) crosses in the overbought zone, and the Put entry is at the first sign of the parabolic, which confirms this crossover.
But where the light rectangle is – that’s it, the train has left. The movement is sideways, and look: neither the stochastic intersection nor the parabolic signs really work there.
Lateral movement is evil.
Parabolic and DMI
The strategy has already been described . The essence is shown on the screenshot, and if something is not clear, read the link.
Parabolic and MACD
It was also described in detail at the link above.
Parabolic and ADX
The ADX indicator shows the strength of the trend. If its value is below 25 , the trend is sluggish and uninteresting. What we observe: ADX is less than 25, the price is moving sideways. Boring, sluggish and uninteresting. By the way, to more conveniently indicate the value of 25, simply draw a horizontal line along ADX at this level.
However, ADX confidently went up, exceeded 25 , the parabolic gave a lower signal to enter Call - off we go.
To select ADX, find Directional Movement in the list of indicators on the live chart and uncheck the extra boxes. Like this.
The importance of optimizing the Parabolic robot
I have already written about the importance of optimization earlier. I just want to remind you that the expert will show the best results if it is optimized for the maximum time period, with the maximum possible matches of option options. Thus, it is important to perform optimization to get the most promising results. This will require a powerful computer and time. However, when the optimization is completed, you will have a very powerful tool in your hands, with which you can earn quite consistently for quite a long time. Until optimization is required again.
Download
Read about the rules for installing the advisor here. And about how to read here. Please note that I test both paid and free advisors and give feedback to VIP groups where I provide free training.
Exit from positions
It's just as easy as entering.
If a purchase was opened, then as soon as the price chart crosses the indicator from top to bottom, the deal can be closed. If there was a sale, then the price chart crossing the indicator points from bottom to top can serve as a signal to exit the market.
This is provided that the exit is done manually.
If you use a stop loss at indicator points, then the exit would occur automatically when the stop loss is triggered.