In order to select the most promising investment options among the huge number of investment options on the Internet, investors need universal evaluation criteria. The most obvious is return , a measure of how much an investment has increased or decreased over time.
Return is measured as a percentage and shows the ratio of profit from real or financial investments to the amount of money invested. It shows not exactly how much the investor earned, but the effectiveness of the investment. When analyzing investment options, investors look primarily at profitability, often forgetting about possible investment risks.
I wouldn’t write a long article if one formula worked for all cases - there are plenty of pitfalls when calculating profitability in different cases. In principle, you don’t have to bother and use my free tool for these purposes, but it is still advisable to understand the essence of the issue. The article describes frequently occurring situations related to investment returns. There will be a lot of 8th grade math, so get ready 
This article is part of my free educational series on investing basics. If you have questions, problems or need advice, I am at your service in the comments.
Before moving on, I invite you to subscribe to my Telegram channel
Webinvestor Blog : there you will find weekly investment reports, notes on different investment methods and important news, etc. - everything that does not fit the format for the site. And be sure to repost on social networks: they bring readers and improve the position of the article in search engines. Thank you in advance! Thank you for your attention, let's continue!
How to calculate return on investment?
Profitability is measured as a percentage and is calculated as the ratio of profit (loss) from investment to the amount of investment, multiplied by one hundred percent. The investment amount is the initial amount of money contributed + additional investments (for example, repairs).
Profit is calculated as the difference between the cost of purchase (the amount of investment) and the sale of the asset + the amount of financial payments received during the ownership of the asset, i.e. interest income (for example, rent).
A real example of calculating the return on investment: I purchased an apartment for 49,400 euros + tax, as well as repairs cost 10,000 euros = 59,400 euros (investment amount), sold the apartment for 97,000 - 2,500 (sales tax) = 94,500 euros \ (sales amount), during the period of owning the living space, I received 3,700 euros (rent). I calculate the profitability: ((97000-2500)-59400+3700)/59400*100% = 65.32%.
Formula No. 2 There is a second formula, according to which profitability is calculated as the amount of sale of an asset + the amount of financial payments divided by the amount of investment - one multiplied by one hundred percent.
Sample calculation of profitability: ((97000-2500)+3700)/59400 - 1 ∗ one hundred percent = 65.32%.
Profitability taking into account the movement of funds
How can I display the overall result, for example, for a year?
Adding up all the returns is not very convenient and labor-intensive.
The simplest and most obvious option is to fix the value of the portfolio at the beginning and end of the year. And calculate the total profit.
Example. At the beginning of the year, the investor had a capital of 200 thousand rubles. Due to profitable investments, a year later his portfolio was valued at 240 thousand.
Net profit 40,000 rubles or 20% per annum.
This method of calculating profitability has one significant drawback that will distort the real numbers. But to put it simply, doing them is not at all correct.
During the period under review, possible movements of funds in the account or portfolio are not taken into account.
What are these movements?
- deposit/withdrawal of funds;
- making a profit “from the outside”. For example, coupon income on bonds or dividends on stocks.
From the example above. If a month before the end of the annual period the investor contributed an additional 40 thousand rubles. How will this affect the result? In absolute numbers, we also have +40 thousand profit or 20% per annum. But in fact the result is zero.
Another variant. After 1 month, the investor did not deposit, but withdrew 40 thousand. As a result, for almost a whole year he operated with an amount 20% less than the original one. And still earned 40 thousand in profit.
Or dividends and coupons were paid during the year. There were constant deposits and withdrawals of funds from the account. As then? How to determine real profitability?
For calculation, there is a special formula for calculating interest depending on the date and amount of funds movement. But I think most (probably all) will not use it. It's too complicated and cumbersome. I won’t even bring it here.)))
How to correctly compare the returns of assets whose holding period is different?
To do this, calculate the yield in % per annum . It is calculated in order to compare the performance of assets whose holding periods differ.
For example, some shares brought 25% in 12 months of ownership, and the living space from the previous example brought 65.32% in 48 months, which is more profitable? At first glance, it’s living space, since it gave more profitability. However, the investor owned it for more than 3 years, so the profitability seemed to stretch over the period, compared to shares. In order to correctly compare stocks and housing, the return on assets must be calculated in % per annum.
To do this, the indicator 365/T is added to the formula, where T is the number of days of holding the asset.
Sample calculation of profitability in % per annum: I purchased living space for 49,400 euros + tax, as well as repairs of 10,000 euros = 59,400 euros (investment amount), sold an apartment for 97,000 - 2,500 (sales tax) = 94,500 euros (sales amount), during Ownership of living space acquired 3,700 euros (rent). I calculate the yield in % per annum: ((97000-2500)-59400+3700) /59400(365/1460)100% = 16.33%.
It follows that in this case, shares became the most profitable instrument.
The following calculation of our real project: I purchased living space from the bank. It consisted of 2 for 219,000 euros (investment amount), divided and sold the 1st for 143,000 euros, and sold the 2nd for 145,000 euros.
As a result: 288,000 euros (sales amount), for a holding period of 45 days (asset holding period). I calculate the profitability: (288000-219000/219000)(365/45)100% = (51750/219000)(365/45)100%= 191.66% per annum.
Brokers, banks, and investment firms can manipulate the annual return. In my project, the return on investment is 191.66% per annum. However, it was received in just 45 days. And this profitability is conditional, which is why it is necessary to calculate the average annual profitability for absolutely all projects.
We count profits
The simplest and most basic formula for determining the “profitability” of an investment.
The difference between the final amount and the initial amount forms the net profit.
To display the percentage, use the formula:
Profitability = (net profit) / investment amount * 100%.
Example.
We bought Gazprom shares for 10,000 rubles. A year later, everything was sold for 13,000 thousand.
Net profit amounted to 3 thousand rubles (13,000 - 10,000).
Return on investment 30% (3,000 / 10,000) * 100%).
There is one significant drawback to this formula. It allows you to calculate only absolute profitability. Without reference to the period for which it was received.
We could earn 30% in 1 year. Or they could do it in 5 years.
How to calculate the average annual return on investment?
The holding period for assets varies. Moreover, most assets do not increase by the same amount. Assets such as stocks can decrease or increase by 10s or hundreds of% in 12 months. Therefore, I would like to understand how much capital investments will grow on average over 12 months. How to calculate the average annual return? The average annual return is calculated by taking the root using the formula:
Formula No. 1
where n is the period (in years) of holding the asset.
An example of calculating profitability, because I owned the living space for 4 years: 4√((97000-2500)+3700)/ 59400 - 1 ∗ one hundred percent = 13.39%. Formula No. 2 Another formula for calculating average annual profitability is by exponentiation.
Profitability using this formula can be easily calculated in Excel. To do this, find the Power function, in the Number line enter the quotient of division ((97000-2500)+3700)/59400, and in the Power line enter 1/n, where instead of n indicate the number of years, add -1 outside the brackets.
In the cell the formula will look like this = Degree ((97000-2500)+3700)/ 59400;1/4)-1. To convert a number to %, select the Percentage cell format.
Profitability charts
A yield chart is an indispensable tool for analyzing investment options. It allows you to look not just at the overall result of investments, but also to evaluate what is happening in the interval between the events of “investment of money” and “withdrawal of profits.”
There are several types of profitability charts. The most common is a cumulative profitability chart - it shows how much the initial deposit would have grown in %, based on returns over several time periods or based on the results of individual transactions.
This is roughly what the cumulative yield chart looks like:
Graph of the investor's net return on the Solandr PAMM account
From it you can understand several important things - for example, whether profits are growing evenly (the smoother the graph, the better), how large drawdowns (that is, unrecorded losses during the investment process) an investor can expect, etc.
I wrote in great detail about the analysis of profitability charts in an article on how to choose a PAMM account for investing.
Profitability charts by week or month are also often used :
Graph of the investor's net profitability of the Stability Dual Turbo PAMM account by month
The columns speak for themselves - March was successful, but over the last three months there was no profit at all. If you look only at this chart and do not take into account older Stability accounts, then you can draw the following conclusion: the trading system has failed and has stopped making profits. A smart strategy in this case would be to withdraw money and wait until the situation returns to normal.
In general, profitability charts and PAMM accounts are a separate interesting story.
How to calculate the average annual return if the return by year is known?
If the return on an asset by year is known, then the average annual return can be calculated by multiplying the annual returns, as well as taking the root of the product to the power that equals the number of years.
First, convert the yield from % to numbers. For example, the 1st 12 months yield is +20%, the 2nd 12 months -10%, the third 12 months +30%. In numbers it will be like this: 1.2, 0.9, 1.3. The yield will be 3√1.20.91.3 - 1 *100%= 11.9%. These formulas provide the result of complex %. The elementary formula for calculating profitability does not provide for this and increases profitability, which is not entirely correct.
Why Annual Percentage Yield is Unique
Compared to simple interest (without compounding), APY gives a more accurate idea of how much you'll earn in a deposit account because it takes into account compounding.
Compounding occurs when you earn interest on both the money you invest (or your original principal) and your earnings (or past accrued interest).
Example of a lump sum annual payment : Let's say you deposit $1,000 into a savings account that pays a simple annual interest rate of 5%. If your bank calculates and pays interest only once at the end of the year, the bank will add $50 to your account. At the end of the year, you will have $1,050 (assuming your bank only pays interest once a year).
Example of monthly compounding : Now suppose that the bank calculates and pays interest on a monthly basis. You will receive small additions every month. In this case, you will end the year with $1,051.16, which is more than the stated interest rate of 5%.
The difference may seem small, but over many years (or with larger deposits) it can be significant. In the table below, notice how profits increase slightly each month.
| Period | Profit | Balance |
| 1 | $ 4.17 | $ 1004.17 |
| 2 | $ 4.18 | $ 1008.35 |
| 3 | $ 4.20 | $ 1012.55 |
| 4 | $ 4.22 | $ 1016.77 |
| 5 | $ 4.24 | $ 1021.01 |
| 6 | $ 4.25 | $ 1025.26 |
| 7 | $ 4.27 | $ 1029.53 |
| 8 | $ 4.29 | $ 1033.82 |
| 9 | $ 4.31 | $ 1038.13 |
| 10 | $ 4.33 | $ 1042.46 |
| 11 | $ 4.34 | $ 1046.80 |
| 12 | $ 4.36 | $ 1051.16 |
Key Findings
- The annual percentage yield is the annual percentage return of an investment that takes into account the effect of compound interest.
- This is a useful metric to have on hand, especially if you can differentiate it from simple interest and understand how to calculate it.
- Once you understand APY, you can decide how to make the most of the money you have in the bank.
- When calculating APY manually, the following formula is used: APY = 100 [(1 + Interest/Principal Amount)^(365/Days Due) – 1]
Igor Titov
Economist, financial analyst, trader, investor. Personal interests – finance, trading, cryptocurrencies and investing.
Paradox - the average is never average
In the figure below, the dots represent the returns of the S&P 500 index (and its earlier counterpart) for each calendar year since 1926. The horizontal gray bar is the average index return range of 10% (plus or minus two percentage points). We get a spread of 8-12%.
As can be seen from the graph: over 93 years, the market fell into the average return range only 6 times. In other cases, there was a strong deviation from the average without any pattern.
S&P 500 index returns by year
Gold
Gold has been a measure of wealth for several millennia. States, banks, and investors willingly buy it. foundations and ordinary citizens.
The true value of gold (at any given point in time) cannot be determined. Quotes depend on the balance of supply and demand. If there are more people wanting to buy than people wanting to sell, then prices rise.
This is one of the main dangers for an investor. It cannot be said unequivocally that gold will rise in price in the future. There have been periods in history when, after the fall of gold, quotes returned to the previous maximum several decades later.
The second disadvantage of gold is that it does not add value. A kilogram (quintal, ton) of gold will remain a kilogram (C, T) in a year and in 100 - 200 years.
What is our profitability?
From 1972 to 2022, the average annual return on gold was 8%. Less inflation (real return) - 4%.
On the one hand, not bad. But most of the profits were made in the 21st century.
If we divide the period into 2 intervals (before 2000 and after), we get the following data:
| Interval | Gold yield, average per year | |
| nominal | real | |
| 1972 - 2000 | 6,55% | 1,35% |
| 2000 - 2022 | 9,35% | 7,1% |
Real estate
Here we will look at real estate funds - REITs. Real estate investments have generated an average annual return of 8.88% over the past 30 years. Or 6.55% real return.
In some years, the real estate market grew by 30-35%. But there were also significant falls. From their peak, quotes fell by 68%. And restoration took several years.
But nevertheless, investors earned on real estate an average of 6.55% per annum.
APY Maximization
The annual percentage yield increases with more frequent compounding periods. If you save money in a bank account, find out how often it accumulates. Daily or quarterly compounding is usually better than annual compounding, but check the APY for each account to be sure.
You can also increase your APY on your own by looking at all your assets as part of a larger financial picture. In other words, don't think about investing in one certificate of deposit (CD) in isolation from your checking account—all investments should work together to help you achieve your goals, and each should be positioned accordingly.
To maximize your personal annual percentage return, make sure your money grows as often as possible. If two FDs pay the same interest rate, choose the one that pays interest more often (and therefore has the highest interest rate). You can automatically reinvest your interest income - the more often the better - and you'll start earning more interest on those interest payments.
Investment Basics
Smart investments bring stable income to their owner every month or other periodicity. It is this income that will help us during difficult periods of life.
When creating your investment portfolio, you need to take care of dividing it into at least two parts. One of which will be aimed at increasing our capital, and the other will ensure the protection and safety of our funds.
It is the second protective part of our portfolio that provides our constant and stable additional income.
At a certain point, the investor is faced with the need to conduct analytical calculations of the performance of his investment portfolio. This action is necessary for an objective forecast of its future value.
Without such analytics, it is impossible to make an informed decision on the size of the next replenishment and its timely rebalancing. Analytics will also be required to build an effective strategy for replenishing your case.
Size matters
Despite the wide dispersion of returns (even negative), investors can increase their chances of a positive outcome through time. The longer the investment horizon, the greater the likelihood of achieving positive results.
Let's look again at the statistics from previous years:
- On an annual investment interval, the probability of making a profit is 75%.
- An interval of 5 years - the chances of a positive outcome increase to 87.7%.
- 10 year period - with a 97.7% probability the investor will make a profit.
Please note: this is not a 100% guarantee of profit. We're talking about probabilities.
Important nuances of investing
Frequent misconceptions among newcomers to investing are related to small numbers when determining performance. Novice investors believe that an error of 1-2% does not mean anything; they consider it pennies. Multiplying 10,000 rubles by 1% gives 1,000 rubles; this figure seems so insignificant. The determination of profitability is done within one year, but if you look at the amount of 1000 rubles within several investment periods. Therefore, it is important to take into account all the points when carrying out analytical calculations so that the result is obtained with the greatest accuracy.
Conclusion
The described algorithms help to objectively assess the profitability of investments, the main indicator being accuracy. Such an algorithm takes into account all the nuances associated with the deposit and withdrawal of received funds and obtains a correct calculation of profitability.
When an investor uses trust management services, he is provided with reports based on the algorithm for reporting, and he will be able to assess the correctness of using the algorithm when assessing the profitability of his investments.
If the investor takes the calculation of the profitability of the project seriously, since this parameter is important when analyzing the effectiveness of the contribution. If the calculations are made incorrectly, it will create an incorrect impression of the effectiveness of the chosen strategy for your investments. Therefore, for an objective analysis and correct selection of an investment strategy, economists choose the most accurate algorithms, while knowing the exact investment period.
Now you know that return on assets is an important indicator for an investor. And you understand how to calculate it as a percentage or per annum. And also evaluate the return on assets.
Stock
Is it possible to earn tens or hundreds of percent profit annually on individual stocks? - YES.
Is it possible to do this constantly? For many years. - AND YES. AND NO.
Let us formulate the question more precisely: Can the majority of investors correctly choose stocks that will bring them consistently high profits, many times higher than the market returns? - DEFINITELY NOT.
So what about the stock market? How much can you earn from it?
Shares are considered the most profitable instrument. Over the long term, they consistently outperform other asset classes.
Let's see if this is true?
The American market from 1986 to 2022 showed a real return of 8.04% per annum.
The total global stock market return (excluding the US) over the same period was 4.2% real return. If we slightly expand the horizon over several decades, we will get approximately a rate of return of around 5% per annum.
US and rest of the world stock market returns
ROI Analysis
Due to the constant change in the profitability of many financial instruments, it is convenient to use the average indicator. Thanks to the average profitability, it is possible to adjust changes in value to one numerical indicator, which can be conveniently used for detailed calculations and analytics of other investment options
Calculation of average profitability of deposits
There are two options for calculating average profitability:
- In the first method, the emphasis is on the total interest formula, where the exact amount of initial injections and income is known, and the number of investment periods is determined;
- The second method involves finding the average profitability number for the same period. Calculation algorithm: Average return = ((number of investment periods (return1 + 1) * (return2+1) * 1) * 100%.
Calculation of the average using the second method: the startup had a profitability of 8% in the first reporting quarter, 15% in the second, 5% in the third, 7% in the fourth. Calculate the average profitability for one reporting quarter.
Substituting values into the algorithm:
Average return = (((8%+1) * (15%+1) * (5%+1) * (7%+1)) (14 - 1) *100%= (1.18*1.15 *1.5*1.7) (14 - 1) *100%= 3.46035 -0.75= 0.49744 - 1 * 100% = 5%
In some cases, clarifying the average profitability comes down to determining the annual interest that the depositor faces in the text of advertising brochures for bank deposits. Having determined exactly the profitability of financial investments for a certain period, the annual profitability is calculated based on the following algorithm:
Profitability = (investment profit / investment amount * 365 / number of days of deposit) * 100%.
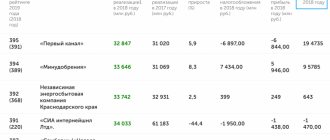
For example, the initial amount of financial investment is $20,000.00, profitability for 150 days is $3,000.00. What is the annual rate of return?
To do this, the investor substitutes digital values into the formula:
Profitability = ($3'000.00/$20'000.00*365/150 * 100%= 32.84% per annum.
Calculation of profit from a deposit taking into account input and output
This task is relevant for experienced investors who replenish their portfolios monthly. At the moment of input and output, the denominator of the main formula for calculating performance—the amount of injections—changes constantly. To calculate the exact profitability of deposits, the weighted average size of deposits is determined, and the profit from deposits is accurately calculated, taking into account input/output.
wealth formula
The analysis is carried out according to the following analogy:
- Profit - (final amount + volume of withdrawals) - (starting capital + total amount of deposits);
- The exact figure for the weighted average investment size is calculated by dividing the investment period into parts, separated by input and output transactions: amount of injections = period1* amount of deposit + period2* (investments + input - amount of withdrawals1/length of the investment period.
An example of this algorithm in practice: a depositor replenished the project with $1000, and after 4 months contributed another $300. Five months later he withdrew $150. At the end of the year, his investment portfolio reached $1,800. What is the profitability of the invested project:
- Stage 1 - calculation of the received investment profit: profit = (1'800$ +150$) - (1'000$+300$) = 650$;
- Stage 2 - the value of the weighted average investment return: deposit amount =(4*$1'000+6*($1'000+$300)+2*($1'000+$300-$150))/12=( 4'000$+7'800$+2'300$)/12 = 1'175$;
- Stage 3 - calculation of profitability: profitability = ($650/$1,175)*100%=55.3%.
Sharpe ratio
This calculation algorithm is also used to assess the profitability of an investment portfolio. The formula was first developed and introduced by the American economist William Sharp. The algorithm remains relevant due to the ability to assess and calculate probable risks and effectiveness. The algorithm looks like this:
KS = (YES - BD) / SO
Where:
- YES - return on the asset for the specified period
- DB - income with zero risk
- SD - standard deviation.
Depending on the final value, economists clarify the potential profitability of a particular project. The resulting value has 3 possible outcomes:
- KS >= 1 most significant result, contribution to this project will bring a certain profit;
- KS = 0 or 1 - this indicates a high degree of risk, due to the strategy being worked out in detail. These types of investments are used only after careful study;
- KS < 0 - the strategy is low-effective, its use as part of a portfolio will cause damage.
The basic rule of the Sharpe ratio is that risks can be significantly reduced by choosing a strategy with the highest ratio. Investors are always guided by this rule when choosing a particular strategy.
Disadvantages of the method:
- It is not always clear which values to consider. This algorithm is suitable for making approximate calculations, because when setting different values, the result differs significantly;
- Due to inaccurate comparisons, multiple values must be used. The greatest effect will come from calculating several values over the same period of time;
- There is no need to compare high-risk and low-risk investments because the result is very clear.
All these nuances are taken into account when using this calculation algorithm.
Average annual profitability and CAGR algorithm
The average annual value is calculated quite simply - add up all the profitability for the period and divide them by the number of years. If there are few such indicators, then the result of such calculations is close to the true one.
If the necessary data on profitability is not available, but the amounts of starting and final capital are precisely known, then the CAGR formula is perfect in this situation:
(Portfolio price at the end of the period/portfolio price at the beginning) 1/number of years - 1
This formula is suitable in the case when the deposit was entered once at the start, after which the depositor did not make any transactions on the account.
Method for assessing deposits IRR or internal rate of return (IRR)
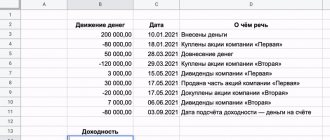
This is the easiest way to evaluate the performance of deposits and investments. IRR is an interest rate, where the stated cost of financial investments is equal to the amount of the original investment. Using this economic value, the prospects of the project are assessed.
IRR is easily calculated in EXCEL tables. Using this template, profitability is calculated for each of the investment periods separately or for the 6th period at once. In the date column indicate any desired date. The only point is that the investor needs to enter data every time he replenishes and withdraws funds. When carrying out the analysis, the algorithm used is XIRR (NET IRR).
In addition to the IRR of the portfolio, with the help of this tool, investors look at the overall growth of investments, how much its size differs from the amount of invested funds.
The main quality of such a calculator in the EXCEL program is to determine the prospects of investments for diversified deposits.
wealth of choice