To date, a sufficient number of various indicators have been developed. Therefore, it is often difficult to choose the most suitable one. But if you choose the right tool, it will help you build your own system to suit your trading style and become a reliable assistant in making a profit.
We offer for your consideration a list of 10 trend indicators. Some of them have proven themselves for decades, and some are barely familiar. Which one is the best is up to you, dear traders, to decide. Write in the comments which ones you used and which one you recommend, based on your own experience. What are the preconditions for opening and closing transactions.
Supertrend
This is a hybrid indicator, as it is based on the signals of two fairly well-known products: ATR and CCI. ATR is an average true range indicator that determines the range of minimum and maximum price fluctuations, as well as closing prices. As a result - indicates the current market volatility. CCI is an indicator of the oscillator family. The indicator helps to calculate the oversold and overbought levels of a trading instrument.
When a trend changes, the SuperTrend indicator uses color signaling: green when changing from downward to upward, and red when changing from downward to downward. You can use the SuperTrend indicator when entering the market after its correction. If the indicator changes color to green, you need to wait for the first downward correction and then open trades to buy the asset. And to sell (change color to red), wait for the first upward correction and sell the asset on it.
The SuperTrend indicator also provides a good indication of short-term resistance and support levels. But this factor must be used in trading with great caution. More accurate are the Tenkan and Kijun lines (Ichimoku indicator).
Bollinger Bands
The Bollinger Band indicator also acts as a channel and is very similar to the Keltner channel, except for its multifunctionality. Bollinger is perfectly used both in scalping and trend trading.
It combines the principle of trading according to Keltner, but also adds the feature of trading based on channel exits. The scalper strategy involves catching small knives, and Bollinger will tell you where exactly to catch.
Smoothed Repulse
A rather exotic indicator that also uses color signaling. It needs research and description, like the Ichimoku indicator did in its time. Based on the few comments from traders, Smoothed Repulse is suitable for scalping, so it is recommended to use it on small timeframes.
Smoothed Repulse indicator on the AUDUSD M15 chart Main signals:
- Buy: open a long position if the indicator line changes color to light green.
- Exit a buy trade: close all orders if the green indicator line changes color to silver during an uptrend.
- Sell: open a short position if the indicator line changes color to orange-red.
- Exit a sell trade: close all sell orders if the orange red line of the indicator changes color to silver during a downtrend.
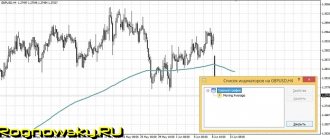
Trend lines auto
This indicator is necessary for constructing trend lines in automatic mode. You can work with the indicator on every time period and any currency pair.
This indicator is capable of performing one more task, in addition to plotting trend lines. It has a sound signal, which is necessary to notify the trader that the price chart has broken through a particular trend line. A separate window also appears, which displays all the information about the output signal and draws an arrow at the place where the signal is generated.
The indicator is set with the parameters shown in the screenshot below.
To change the type of line drawing with this indicator, you must select the “zigzag” settings. It will not be displayed on the chart; its values are necessary for smooth alignment of trend lines based on peaks and valleys.
TEMA
TEMA (Triple Exponential Moving Average) indicator - triple exponential smoothing. It can be used instead of classic moving averages (EMA) to smooth out price data. The TEMA indicator works on the same principle as DEMA (Double Exponential Moving Average) - double smoothing, but with additional processing.
First, DEMA is calculated, then the error of price deviation from DEMA values is calculated. Then the exponential mean error value is added to DEMA to obtain TEMA. Thus, the values of the next indicator smooth out the values of the previous one.
It is well known that the moving average lags slightly behind the price (lags). Therefore, the smaller the gap from the price, the better. And the TEMA indicator shows the upcoming price change earlier than others.
It is worth considering that the delay directly depends on the selected period. And the longer the period, the greater the delay will be. There is an opinion that on short periods the TEMA indicator often gives false signals.
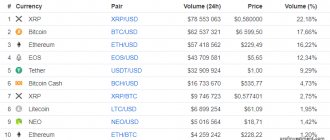
Trend indicator Currency Pairs
This indicator can definitely be included in the best trend indicators. It is based on calculations that are carried out based on trend lines for a large number of instruments at once. Let us immediately note that the indicator consumes quite a lot of computing power, so you should not be surprised that when switching time frames it freezes for a few seconds, just at this time trend analysis occurs.
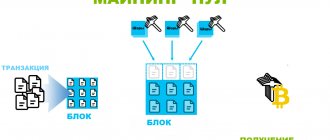
The operating principle looks like this:
- The indicator takes the main pairs with a specific currency. It evaluates trends by slope angle and gets a certain value for this particular currency, that is, it considers pairs, but evaluates a specific currency.
- Next, the algorithm moves on to the next currency and evaluates pairs with it. So, step by step, he explores all the major pairs and all the currencies in the context of these pairs.
- The obtained values are compared and a conclusion is drawn about which currency is currently being sold the most and which is being bought the most.
- Based on these values, each currency is ranked relative to the others.
As a result, we get a window under the chart where currencies and their positions are shown. Each currency in this trend indicator corresponds to a line of a certain color. Based on the data obtained, we can conclude which currency should not be bought and which should not be sold. This principle works great both for short periods and for large ones, but you need to remember that you should not pay attention to news movements, since they cause activity on a specific currency, and these movements often play back quite quickly.
Signals are considered to be line intersections, but only when this occurs not so far from the average value. In a good situation, you can catch big movements when one currency begins to rise in relation to all others, and the other, on the contrary, begins to fall in relation to all others. In this case, we get the maximum divergence between supply and demand, which is reflected on the CP trend indicator as a divergence between the lines of these currencies. Also, this is usually followed by a powerful correction, which also allows you to make money.
Parabolic SAR
The SAR (Stop And Reverse price) indicator - stop and reversal, indicative price, or simply Parabolic - is designed to determine the tolerances within which price movement is possible. And as a result, stay in the current trend.
That is, Parabolic is designed to determine the stop price and reversal points. Therefore, the indicator draws dotted lines on the instrument charts. If an upward trend prevails in the market, the points will be located under the candles and form a support line. If the trend is downward, the dots will appear above the candles and form a resistance line.
In fact, each SAR marker means the level that the price must reach in order for the trend to reverse. In addition to the direction of the trend, Parabolic also shows its strength to some extent. So, if the current trend accelerates, the distance between the indicator points and the price chart increases. And if the trend fades, the markers approach the current price values.
When trading with Parabolic, it is recommended to use time frames from 1 to 4 hours.
Sale transaction:
- The parabolic has drawn 4 points in a row, which form a descending line - a signal to sell;
- Stop Loss is set above the first point by 3 - 5;
- The transaction is closed when a reverse signal is formed.
For a buy transaction, the opposite conditions are required.
ZigZag
The ZigZag indicator is an excellent assistant for building Fibonacci levels and reversal patterns. It is used in many strategies and helps to correctly identify such figures as Double Top, Double Bottom, HHLL and others.
It’s easy to use, you just need to put the indicator on the chart and look at it, ignoring the candles, so unnecessary noise will disappear and you can see the patterns more clearly.
Heikin (Heiken) Ashi
Heikin Ashi is a useful indicator of the price oscillator family. To determine the trend and its strength, the indicator uses Heikin Ashi values instead of the “net price”. This is an additional signal line that is used to achieve the following purposes:
- Use it as a signal line at intersections with the oscillator.
- To smooth values and filter out some false signals, since oscillator values are prone to rapid fluctuations (nervousness) against the background of a natural lag.
Heikin Ashi is developed on the basis of ordinary Japanese candles, but the method of constructing candles itself is unusual. And visually, the opening and closing points of Heikin Ashi candles do not always correspond to the same points on the charts of “classic” Japanese candles.
The opening price of a Heikin Ashi candle (HA candle) is the smoothed value of quote fluctuations in the range between the opening and closing of the previous HA candle. Thus, the opening and closing prices are first added and then divided by 2. The indicated prices are taken from the previous HA candle.
The closing prices of an HA candle are the average of all indicators of a regular candle. That is, this is the minimum, maximum, as well as the opening and closing prices of the timeframe. Divide them by 4 and get the closing price of the HA candle.
The maximum price is obtained by comparing the parameters of the maximum of a regular Japanese candle with the opening and closing prices of an HA candle. The minimum price is obtained by comparing the minimum of a regular candle with the opening and closing prices of an HA candle. To make it more informative, HA candles are colored differently than regular Japanese candles. When analyzing, you need to take into account the shadows of candles.
With Heikin Ashi, trend reversals are easy to recognize. To do this, you need to draw a trend line and highlight the rollbacks in the trend. The lower shadow indicates where to set Stop-Loss. And Take Profit is usually set around the support/resistance level
How to find a trend?
The main problem with technical analysis lies in the specific decision maker. Each trader must clearly formulate for himself what exactly he considers a “trend” and what is a “moment of reversal.” Moreover, the analysis is always performed on history and any indicator of a trend reversal is necessarily delayed .
We will consider a trend to be a directional trend, limited in time, having statistical significance within the analysis period.
It turns out that for a scalper 2-3 Japanese M5 candles of 10-30 points in size in one direction are already a strong trend, a mid-term investor needs a clear direction within a few hours to make a decision, and a serious long-term investor does not need a movement of less than 2-3 day ranges at all will notice. The “lag” period of the reversal signal is different for everyone, and so are the methods for dealing with this phenomenon.
Bollinger Bands
Bollinger Bands are an indicator that helps assess market volatility. They allow you to determine not only the direction of the trend, but also volatility, as well as the range of fluctuations. That is, the direction of the trend and the nature of trading.
The indicator consists of three main lines. The middle line is the moving average (MA). The outer bands are also MA, but they are displayed taking into account the deviation.
The distance between Bollinger Bands depends on the nature of price behavior. If market volatility increases, the corridor expands. And when market volatility falls, the corridor narrows.
The most common is trading using the price crossing the center line of the indicator. When the price crosses the moving average from below to above, buy trades are opened. And if from top to bottom, a sell transaction is opened.
Another trading method is buying on reversals. Considering that the extreme lines are support and resistance levels, trades are opened when the price pushes away from one of them and goes to the opposite one.
When price touches the lower Bollinger Band and then reverses, long positions are entered. In a situation when the price touches the upper border of the indicator and turns down, short positions are opened.
It is not recommended to use this instrument in markets with low liquidity.
Trend indicator Monster II
Some algorithms for assessing market movements contain combinations of methods that represent trend indicators of technical analysis. An example of such a combination is the fairly well-known trend indicator Monster II .
It includes the following popular indicators:
- Momentum . A fairly simple classic indicator, it is calculated as a percentage of the difference between the current price and a certain number of candles in the past. This is a relatively accurate method of determining the trend, especially if used on a time frame from H4.
- Moving average . Another classic of trend analysis, a very simple and understandable principle of determining direction by calculating the average price value over a certain period of time. Used in a huge number of other indicators as part of the algorithm.
- Bollinger Bands . A distinctive feature is the use of deviation, that is, the indicator does not just use some kind of averaging, but has a deeper meaning. That is why it has been used for many years.
It is quite logical that the combination of such indicators ultimately produced an excellent trend indicator. It occupies a separate window in the work area under the chart and is presented as a sequence of bars of different colors:
- bright green bars indicate the presence of a strong bullish trend; you can enter into a trade immediately after such a bar appears;
- bright red bars indicate a strong bearish trend, you can also take a short position immediately after the signal appears;
- pale green and pink bars indicate the presence of bullish and bearish trends, respectively, but these are weak trends that can end at any moment, so if you enter, then with a short stop and on a rollback on small time frames;
- the absence of bars indicates a flat; here this indicator suggests not trading.
This completely simple system of signals makes it easy to navigate the current situation, and, as you can see in the example from the picture above, the indicator quite accurately works out turning points and changing the color of bars or the appearance of single bars occurs extremely rarely. This is due to the serious filtering of signals using the three described trend indicators; together they provide such a high signal processing efficiency. But you should avoid consolidation zones, where each fluctuation occurs sharply and directionally.
This is a trend indicator and similar situations can cause it to show a constant change in trend, and with a delay. If there is a hint of consolidation, then we move on to using oscillators. It is also worth noting that algorithms built on classic trend indicators of technical analysis are truly reliable over larger periods, for example, hourly and higher. For scalping, you should use other indicators specially made for it.
MACD
The MACD indicator (MACD) - Moving Average Convergence and Divergence can be translated as “Convergence and divergence of moving averages.” It is used in technical analysis to evaluate and predict price fluctuations in markets.
It is used to check the strength and direction of a trend, as well as to determine reversal points. It belongs to the family of oscillators, and is essentially an improved version of two moving averages.
The MACD indicator is built on the basis of two lines - solid (main) and dotted (signal), which is usually of a brighter color.
The main line is built based on two average fluctuations in the exchange rate of the instrument being traded. It is more mobile and reacts quite quickly to price changes in a short period of time. The signal line reacts much more slowly to price fluctuations, but covers a longer time interval.
Trading using the MACD indicator is based on the intersections of the Main and Signal lines. So, in the case when the Home falls below the Signal (dashed) line, this is a signal to sell. And in the case when the Main rises above the Signal line, this is a signal to buy. Also, the moments when the Home crosses the zero line down or up are used as sell/buy signals.
Example: we buy when the histogram columns begin to go below the zero line and then close above the moving average. The trade is closed when the histogram columns cross the average in the opposite direction. A sell transaction requires the opposite conditions.
On hourly timeframes (and less), the MACD indicator gives a lot of false positives. It is recommended to use it on daily charts or higher.
TRIX
The TRIX indicator (TRIple eXponential average) - Triple Exponential Average, is an overbought and oversold oscillator. It differs from MA in that it produces fewer false signals.
When calculating, TRIX excludes values with shorter periods than the indicator period, thereby smoothing the resulting line and excluding short-term market fluctuations from it. As a result, during trading it allows you not to make unnecessary movements.
The TRIX indicator is displayed in a separate terminal window and consists of a line and level 0. If the TRIX line is located above zero, the market is in an upward trend. And if below the trend falls. If the TRIX line is above level 0 and continues to rise, the uptrend is intensifying, and if it is below 0 and continues to fall, the downward trend is intensifying.
TRIX is an impulse indicator, so it is recommended to use it during pronounced trend movements. During a flat period, TRIX can produce quite a lot of false signals. That is, if the TRIX line fluctuates near the zero mark for a long time, this usually indicates uncertainty in the market. At such moments it is better not to take active actions. It's better to analyze.
For a sell transaction:
- The TRIX line broke through the zero mark from top to bottom;
- Stop Loss is set 3-5 points above the local extreme;
- When there is an opposite signal, we close the deal.
A buy transaction requires the opposite conditions.
Combined reversal analysis schemes
Standard tools have been studied for a long time, tested in many variants, and only non-standard solutions can provide any advantage. The availability of programming tools allows you to combine several analysis methods in one indicator with virtually no loss of accuracy. In addition, it is possible to get rid of many indicators on the working screen - the trend reversal indicator recommended below can be found for free on the Internet. Signals are processed according to a standard scheme.
Click the button to go through a step-by-step guide to trend reversal indicators and master these tools in a few simple steps Explore »
Non-standard VisualMACD indicator.
An assessment of the reversal potential is necessarily included in complex technical tools, such as the Forex Eye indicator, which, in addition to clear trading signals, calculates possible target levels for movement in both directions.
General trading scheme using the Forex Eye indicator.
RSI
RSI (Relative Strength Index) indicator - The Relative Strength Index is an oscillator that follows the price and fluctuates in the range from 0 to 100. At first, its 14-period version was used, later 9 and 25-period indicators became popular.
It is important to remember that the shorter the calculation period, the more sensitive the RSI indicator becomes and produces more false signals. So you need to be careful when setting it up.
TS with RSI is based on searching for divergences (discrepancies), in which the price forms a new high, but the indicator fails to exceed its previous high. With such discrepancies, we can say that there is a high probability of a price reversal. If the RSI subsequently falls below the last trough, then the so-called The “failed swing” ends and indicates an imminent price reversal.
To open sell trades:
- The RSI broke through the overbought level (70) from top to bottom.
- We sell on the next candle after the breakdown.
- We set the Trailing Stop to the level of the local maximum price that preceded the opening of the transaction. That is, Stop Loss will automatically follow the price at a certain distance.
- We set Take Profit 2.5 times further (in points) than Stop Loss.
- If a reverse signal has formed, but Take Profit or Stop Loss has not yet triggered, we close the deal manually.
Buy transactions require the opposite conditions.
Stochastic Oscillator
Stochasticity is a goal, an assumption, an accident. This is a process whose behavior is not defined, and its subsequent state can be either predicted or random.
The Stochastic Oscillator is compared to a certain indicator of price speed. It shows the ratio of the closing price of the current period to the maximum or minimum for a specific period. That is, its main purpose is to determine trends and price turns, their changes by tracking the distribution of closing prices in an extreme series of market highs and lows. Stochastic values range from 1 to 100.
Experts divide the Stochastic indicator into 3 types:
- Fast Stochastic (pure %K) is determined by diagnosing its values for lack of smoothing using an averaging method. It is used quite rarely because it is too variable in itself.
- Slow Stochastic (slow %K) - values smoothed by the averaging method.
- Full Stochastic (universal) is the most flexible and advanced. Is the average of the oscillator types listed above. Sometimes it may coincide with their meanings.
The Stochastic Oscillator consists of two lines: the main (%K) and the signal (%D). Typically %D is a moving average of %K. The main line is shown as a solid line, and the signal line as a dotted line.
Most often, Stochastic is used to search for divergences and analyze trends. If the Stochastic value rises above 80%, the market is in the overbought zone. And if it drops below 20%, the market is in the oversold zone.
To open buy trades:
- Both Stochastic lines entered the oversold zone.
- The lines intersected in this area.
- The oscillator broke through the oversold level from bottom to top.
- We buy on the next candle, after the breakdown.
- We set the Trailing Stop to the level of the local maximum price that preceded the opening of the transaction. That is, Stop Loss will automatically follow the price at a certain distance.
- We set Take Profit 2.5 times further (in points) than Stop Loss.
- If a reverse signal has formed, but Take Profit or Stop Loss has not yet triggered, we close the deal manually.
Sell transactions require the opposite conditions.
Price channel
Price Channel Upper-PCU
Upper limit: U = [ 1 + u / 100] * SMA (P, n); Lower limit: L = [ 1 - d / 100 ] * SMA (P, n),
where U is the upper band of the price channel,
L-lower band of the price channel,
U - % deviation of the upper band from the average,
D - % deviation of the lower band from the average,
SMA (P, n) - moving average.
With a successful choice of parameters, the channel will correspond to the equilibrium state of the market, and all price exits beyond its limits should be accompanied by its return back. About 5% of prices should be outside the lines, 95% inside.
Download Price Channel indicator - MT5
Also see 25 Useful Channel Indicators